

Abstract
Myocardial ischemia is one of the most common cardiovascular pathologies and can indicate many severe and life threatening diseases. Despite these risks, current electrocardiographic detection techniques for ischemia are mediocre at best, with reported sensitivity and specificity ranging from 50%–70% and 70%–90%, respectively. Objective: To improve this performance, we set out to develop an experimental preparation to induce, detect, and analyze bioelectric sources of myocardial ischemia and determine how these sources reflect changes in body-surface potential measurements. Approach: We designed the experimental preparation with three important characteristics: (1) enable comprehensive and simultaneous high-resolution electrical recordings within the myocardial wall, on the heart surface, and on the torso surface; (2) develop techniques to visualize these recorded electrical signals in time and space; and (3) accurately and controllably simulate ischemic stress within the heart by modulating the supply of blood, the demand for perfusion, or a combination of both. Main results: To achieve these goals we designed comprehensive system that includes (1) custom electrode arrays (2) signal acquisition and multiplexing units, (3) a surgical technique to place electrical recording and myocardial ischemic control equipment, and (4) an image based modeling pipeline to acquire, process, and visualize the results. With this setup, we are uniquely able to capture simultaneously and continuously the electrical signatures of acute myocardial ischemia within the heart, on the heart surface, and on the body surface. Significance: This novel experimental preparation enables investigation of the complex and dynamic nature of acute myocardial ischemia that should lead to new, clinically translatable results.
Export citation and abstract BibTeX RIS
1. Introduction
Despite several decades of research progress, ischemic heart disease remains one of the most common heart pathologies, affecting over 8 million people globally (Safdar et al 2018). Myocardial ischemia occurs when there is inadequate perfusion to a specific region of the heart, leading to mechanical, electrical, and functional abnormalities. A surprising range of pathologies can cause acute transient ischemia, including coronary artery disease, coronary microvascular dysfunction, Takotsubo cardiomyopathy, and coronary artery dissection (Jespersen et al 2012, 2013, Noel et al 2017, Safdar et al 2018). Each pathology carries a significant risk of short- and long-term mortality that can be reduced substantially by early detection. Therefore, detecting myocardial ischemia early is paramount to preventing long-term negative consequences (Kontos et al 1999, Noel et al 2017, Knuuti et al 2018, Safdar et al 2018). For decades, the electrocardiogram (ECG) has been the primary acute detection method for myocardial ischemia (McCarthy et al 1990), however, current performance using these methods is mediocre at best, with reported sensitivity and specificity ranging from 50%–70% and 70%–90%, respectively (Stern 2002, Knuuti et al 2018). This poor performance indicates that many patients may be discharged from clinical care unaware of their potentially life-threatening condition, and others may receive care they do not need. Improvements in the electrical detection of myocardial ischemia must be made to ensure confident and accurate diagnoses of myocardial ischemia to prevent fatal long-term consequences.
This poor ECG-based performance may stem from our limited understanding of the ischemic bioelectric sources within the myocardium and how they manifest as electrical signals on the body surface. Past studies based on limited measurement capabilities have suggested that myocardial ischemia originates on the endocardial surface of the heart and progresses radially outward to the epicardium (Savage et al 1977, Janse et al 1979). However, our recent experimental studies have shown that these assumptions are not supported, at least in large mammal models. Aras et al showed acute ischemia originating throughout the myocardial wall (Shome et al 2007, Aras et al 2011b). These findings and the poor clinical performance of ECG ischemia detection have spurred discussion about other assumptions and re-evaluations of the conventional description of ischemic sources within the heart, but conclusions have been limited in their understanding of physiology and clinical application because experimental models have lacked some key components. Currently, no experimental model has been reported that can control the ischemic load and simultaneously record the electrical potentials within the heart, on the heart surface, and on the body surface. Without these data from an experimental model, improved methods of detection cannot be verified, which in turn inhibits the testing and implementation of new methods for detecting myocardial ischemia.
To maximize its translational potential, an experimental model of acute myocardial ischemia must (1) have comprehensive and simultaneous high-resolution electrical recordings within the myocardial wall, on the heart surface, and on the torso surface; (2) be supported by techniques to visualize these recorded electrical signals in time and space; and (3) accurately and controllably simulate ischemic stress within the heart by modulating the supply of blood, the demand for perfusion, or a combination of both. Previous experimental models that have included some of these criteria have been applied to other targets: high-resolution recordings on some surfaces, controlled ischemic load, and other unique recording or interventional techniques (Spach and Barr 1975, Bear et al 2015a, Cluitmans et al 2017, Zenger et al 2018). However, all previously reported models have lacked at least one of the three necessary criteria for a comprehensive examination of acute myocardial ischemia.
Here we report on the development and validation of an experimental preparation to detect and analyze bioelectric sources of myocardial ischemia and determine how these sources reflect changes in body-surface potential measurements. We have achieved all the requirements listed above and created an experimental preparation that will enable significant progress in the understanding and detection of acute myocardial ischemia.
2. Methods
We developed techniques to achieve the three major goals for this study. To simultaneously record within the heart, on the epicardial surface, and on the body surface, we used custom arrays of recording electrodes based on silver and silver chloride substrate and a custom multiplexing system that could record up to 1024 channels at 1 kHz. To process the recorded signals and create three-dimensional models, we used a combination of open-source and custom software applications produced at the Scientific Computing and Imaging Institute (www.sci.utah.edu). This processing pipeline was used to create three-dimensional geometric models that provide a framework for interactive visualization and for simulations of bioelectric fields, such as electrocardiographic imaging (ECGI) (Cluitmans et al 2017, Tate et al 2018). Finally, we controlled ischemic load by increasing cardiac demand through pacing or pharmacological stimulation and by decreasing cardiac supply with a hydraulic vascular occluder placed around the left anterior descending coronary (LAD).
2.1. Animal model
Swines and canines were selected for this experimental preparation because their cardiac anatomy, electrical system, and vascular structure are similar to those of humans. The animals were 25–35 kg in weight and 8 months to several years of age. They were purpose bred for use in experimental research and all studies were approved by the Institutional Animal Care and Use Committee at the University of Utah and conformed to the Guide for Care and Use of Laboratory Animals. After 12 h of fasting, canines were sedated using an intravenous propofol bolus of 5–8 mg kg−1, and swine were sedated using a mixture of telazol (4.4 mg kg−1), ketamine (2.2 mg kg−1), and xylazine (2.2 mg kg−1). Once intubated, isoflurane gas (1%–5%) was used for anesthesia. At the end of the experiment, the animals were euthanized while under general anesthesia, with intravenous Beuthanasia 1 ml/10 kg. The heart was then removed for further evaluation.
2.2. Surgical procedure
Following sedation, a sternotomy was performed to expose the thoracic cavity. The pericardium was opened and the heart was suspended in a pericardial cradle. Following exposure, a portion of the left anterior descending coronary artery (LAD) was dissected, and a calibrated hydraulic occluder (Access Technologies, Skokie, IL, USA) was placed around the dissected LAD. An atrial pacing clip was then placed on the appendage of the right atrium. Following placement of the electrical recording equipment (described below), the pericardium was sutured closed, and the sternum was wired and sutured together. To limit air within the volume conductor, chest tubes were tunneled into the mediastinal, pleural, and pericardial cavities and held under constant suction (5–20 mmHg). The outer layers of dermis were sutured closed and checked for separations. Standard laboratory markers, including blood pH, , oxygen saturation, temperature, and blood pressure, were measured and recorded throughout the experiment.
2.3. Electrical recording equipment
2.3.1. Electrode arrays
All electrodes and recording equipment were custom-built at the Nora Eccles Treadwell Cardiovascular Research and Training Institute (CVRTI) and similar to our work described previously with several important modifications (Shome et al 2007, Aras et al 2009, 2011b, 2016b). The electrical signals within the myocardium were measured using the Utah intramural plunge needle arrays (UIPNAs) Each needle in the array had 10 electrodes on a 1.5 mm shaft spaced 1.8 or 1.1 mm apart for left and right ventricular needles, respectively (figures 1(A)–(C)). The needle electrodes were housed within of a hollow plastic tube with openings for each electrode that was custom fabricated using 3D printing (FormLabs, MA, USA). All ten electrode wires (0.0762 mm, high purity silver, California Fine Wire Company, CA, USA) terminated at an individual hole in the tube and passed through the tube, through strain relief built into the tube end, and then to 24-pin connectors. For these experiments, 12–25 needles were placed in the approximated perfusion bed of the LAD and concentrated on the anterior aspect of the heart.

Figure 1. Custom electrode configurations. (A) Schematic drawing of a left ventricle intramural needle recording array. (B) Schematic drawing of a right ventricular intramural needle. (C) Photograph of a left ventricular intramural needle recording array. (D) Photograph of a 247 lead electrode sock array over a plaster mold of a sample heart, with colored beads marking selected electrodes used for registration of sock geometry.
Download figure:
Standard image High-resolution imageThe epicardial potentials were measured separately using the Utah high density epicardial sock (UHDES), an array of 247 silver wire electrodes tied into a nylon sock. The electrode wires were 0.127 mm insulated silver wires (California Fine Wire Company, CA,USA) spaced at approximately 10 mm; the end of each was stripped and then electroplated with silver chloride to reduce polarizing potentials. A subset of the electrodes also received color-coded beads that provided references for subsequent digitization of sock position (figure 1(D)).
The torso surface electrodes were grouped in strips of 12 electrodes evenly spaced 3 cm apart. Each electrode had an 11 mm diameter Ag–AgCl sensor embedded in an epoxy housing with a 2 mm deep gel cavity. The number of strips applied to the torso surface varied between 6–10 (72–120 total electrodes) depending on the body-surface area accessible for each animal.
2.3.2. Signal acquisition
The electrical potentials from the needle, sock, and torso surface electrodes were captured using a custom acquisition system that could record simultaneously from 1024 channels at 1 kHz sampling rate and 12 bit resolution (Ershler et al 1986). The acquisition system consisted of variable gain input amplifiers, multiplexers, A/D converters, interface circuitry, and a personal computer (PC) hosting a custom program written in Labview (National Instruments, Austin, TX, USA) that managed the hardware and allowed continuous signal acquisition. A bandpass filter with cutoff frequencies at 0.03 and 500 Hz avoided both DC potentials and aliasing. Wilson's central terminal leads were used as the remote reference for all the unipolar signals recorded from the sock, needles, and torso surface electrodes. Prior to each experiment, calibration signals were recorded on each channel to allow subsequent gain adjustments to accommodate thermal variations (figure 2 right pathway).

Figure 2. Data processing and visualization pipeline. This set of techniques was implemented in our custom software and combined all the geometric and signal information into a common coordinate framework suitable for visualization and subsequent analysis.
Download figure:
Standard image High-resolution image2.4. Ischemia intervention protocols
Ischemia intervention protocols can be designed to test different clinical or scientific hypotheses by varying the time of ischemia, relative ischemic load, and other important variables. We induced several transient ischemic interventions, each lasting 8–15 min, during each experiment, followed by a 30 min recovery period, similar to our previous studies (Aras et al 2016b). One ischemic protocol mimicked the Bruce exercise stress test by first reducing the coronary diameter by 50%–70% and then pacing the heart at an increasing increment above resting heart rate every 3 min for a total of 15 min similar to protocols reported in the literature (Okin et al 1986). The intervention was terminated prematurely by the presence of a sequence of three or more premature ventricular contractions.
Another example of an ischemic protocol we applied was based on the clinical dobutamine stress test. Dobutamine is used as a pharmacological stress agent because of its direct stimulation of beta-1 sympathetic receptors on the heart, causing increased heart rate and contractility. In our dobutamine stress protocol, the animal was continuously infused at a sequence of increasing doses, each for 3 min, following routine clinical protocols (Mannering et al 1988). As with the Bruce protocol, the intervention again lasted 15 min or until a sequence of three or more premature ventricular contractions occurred. The LAD occlusion level was again fixed throughout the 15 min episode.
Each of these protocols utilized changes in the ST segment voltage as a surrogate for ischemia within the myocardial wall. Cellular and mechanistic studies have shown that changes in the ST segment correspond to ischemia forming in the underlying myocardial substrate (Kubota et al 1993, Li et al 1998).
2.5. Image acquisition and processing
2.5.1. Image acquisition and segmentation
A major goal of studies using this model is to construct accurate, subject-specific geometric models that include the anatomy and electrode locations. To this end, after the animal was euthanized, the intact torso was imaged with a clinical 3 T MRI scanner (Siemens Medical, Erlangen, Germany) for gross anatomy and electrode positions. Following the torso scan, the heart was excised, filled with dental alginate to preserve heart chamber shape, fixed in formalin, and scanned with a 7 T MRI scanner (Bruker BIOSPEC 70/30, Billerica, MA) using FISP (fast imaging with steady-state precession) and FLASH (fast low angle shot) imaging sequences. To visualize fiber orientation in each heart, a diffusion-weighted MRI sequence was also performed. Capitalizing on the combined advantages of both FISP (consistent volume boundaries) and FLASH sequences (high internal contrast), we produced geometric segmentations of cardiac tissue, blood, and intramural plunge needle geometries using the Seg3D open-source software package6. To visualize the perfusion bed and vasculature, the coronaries were injected with BriteVue contrast agent (Scarlet Imaging, SLC, UT, USA), and the heart was scanned using an Inveon microCT Scanner (Siemens, Munich, Germany) (figure 2 center pathway).
From the segmented cardiac volumes we then created three-dimensional, tetrahredral meshes of the heart and torso using the the Cleaver open-source software package7 for use in subsequent visualization and simulation (figure 2 central pathway).
2.6. Geometric registration
2.6.1. Landmark point recordings
At the conclusion of each experiment, the locations of the torso surface electrode strips, the reference sock electrodes, and plunge needle insertion sites on the cardiac surface were measured manually using a microscribe three-dimensional digitizer (Solution Technologies, Oella, MD, USA). In addition, anatomical landmark sites, including the location of the occlusion site, major epicardial coronary arteries, and the outline of the myocardial shape were also captured using the digitizer. Once the locations of the plunge needles were recorded, they were replaced with plastic spacers that preserved the intramural needle array tracts and could be visualized in subsequent imaging (described above) (figure 2 left pathway).
2.6.2. Registration pipeline
We have developed and implemented a sequence of registration techniques to identify and register electrode locations relative to cardiac and gross anatomical structures (Berguist et al 2019). First, the high-resolution ex vivo FISP and FLASH MRIs of the explanted heart were registered to the full torso MRI scan via an affine transformation using the needle electrode locations in each geometric space. Next, the 247 electrode sock array was registered to the high-resolution heart mesh generated from the images. This step involved an affine transformation that moved the digitized subset of sock array electrodes to the torso MRI space. The transformed, digitized sock points were then snapped (by nearest neighbor) to the myocardial surface. To register the rest of the sock electrodes, we used a nominal sock mesh generated previously by stretching the sock over a heart model and digitizing all electrodes. This nominal sock mesh was first roughly fitted to the high-resolution heart mesh by contracting the sock along its base-apex axis to adjust vertical electrode spacing. The sock was then aligned on the heart mesh using correspondence-driven iterative closest points registration and then snapped to the heart mesh. Finally, the sock correspondence points were used to register the remaining electrodes with a geodesically constrained radial basis deformation as described previously (Berguist et al 2019) (figure 2 right pathway).
2.7. Signal processing
The electrical signals recorded during the study were processed in the preprocessing framework for electrograms intermittently fiducialized from experimental recordings (PFEIFER), an open-source MATLAB-based signal processing platform designed to process bioelectric signals acquired from experiments, as outlined schematically in the upper right panel of figure 2 (Rodenhauser et al 2018). Using PFEIFER, the recorded signals were calibrated, baseline corrected, filtered, and marked at specific time instances within each beat for further analysis. The filter was an amplitude normalized 11th order rational transfer function. Gain correction for the amplifiers was performed on each individual channel by acquiring a reference sine wave of known amplitude(s) at the start of each experiment. A linear baseline drift correction was applied by selecting two assumed isoelectric points at the beginning and end of each beat. Signals of obviously poor quality from any electrode were discarded and Laplacian interpolated from the nearest neighboring electrodes (Oostendorp et al 1989). We also identified and discarded electrograms recorded from needle electrodes within the blood cavities from their morphology; electrograms without an initial positive deflection were assumed to be from within the blood pool (Taccardi et al 2008).
A separate global root mean squared (RMS) signal was computed from each of the sock, intramural, and torso surface signals and then used to mark temporal fiducials around the QRS complex and the T wave. PFEIFER can then utilize intermittent, manually annotated beats to automatically identify and annotate the remaining beats within the recorded signals. From these markings, we extracted the ST40%, QT-interval, and QRS amplitude for further analysis. ST40% is the measured voltage at 40% of the ST segment duration, selected because of previous studies that showed changes in the ST segment relating to ischemia (Janse et al 1980). Algorithms also automatically extracted the activation and recovery times from the each electrogram using methods described previously (Millar et al 1985, Lux and Ershler 1987). PFEIFER greatly accelerated these processing steps by propagating and adjusting fiducial markers set by the user from one beat to all subsequent beats in an continuously acquired run.
2.8. Electrical potential mapping and data visualization
Finally, the processed electrograms and extracted parameters (ST40%, QT-interval, etc) were mapped to the associated electrode locations within the heart and on the epicardial and torso surfaces. Experimental model datasets were then visualized interactively using map3d (www.sci.utah.edu/software/map3d) or SCIRun (www.sci.utah.edu/software/scirun), open-source software packages that provided for extensive spatio-temporal exploration, an example of which is shown in the lower panel of figure 2.
2.9. Model validation
2.9.1. Canine and porcine comparison metrics
We implemented several standard electrocardiographic metrics to verify our signal processing techniques and compare baseline and ischemic electrophysiological parameters in canine and porcine subjects. Time intervals were determined from the root-mean-square of all recorded signals, voltages were calculated from each individual electrode within a recording surface. The QRS amplitude was defined as the absolute difference between the minimum and maximum voltage measured during the QRS interval independent of morphology. The corrected QT interval was calculated using Bazett's formula. Each metric is reported as an average plus or minus standard deviation. Student's t-tests were performed on a subset of experimental data as described in results where p-values less than 0.05 were considered significant.
2.9.2. Changes induced by electrical recording equipment
A natural concern in such a preparation is that signals recorded after the surgery do not resemble those beforehand. To examine such questions, prior to sternotomy, we placed torso surface electrodes and recorded normal sinus rhythm. We then opened the chest, placed the sock and needle electrode arrays and ischemic control equipment, and then closed the chest and recorded normal sinus rhythm from the same torso surface electrodes. We then compared the pre- and post-surgical values of QRS duration, QRS amplitude, and ST40%. To evaluate the changes specifically induced by placement of the needle electrodes, we applied the epicardial sock array and recorded before and 90 min after the insertion of the needle arrays and then compared values of QRS duration, QRS amplitude, and ST40% values. Student's t-tests were performed on a subset of experimental data as described in results, where p-values less than 0.05 were considered significant.
3. Results
3.1. Multiregion detection of ischemia
Figure 3 shows sample measurements of electrograms and ECGs across all measured regions during normal sinus and induced ischemia. The left main panel shows measured potentials along a single transmural needle ordered (from top to bottom as endocardium to the epicardium); a strip of sock electrodes ordered from base to apex, and an approximate 12-lead ECG signal including leads I, II, and III and unipolar precordial leads V1, V2, V3, V5, and V6 during a normal sinus control recording. The right panel shows signals from the same electrodes recorded during significant ischemic stress.

Figure 3. Example recording of sinus control and paced ischemic beats. Left panel: Recorded electrograms from the 10 electrodes down the shaft of anteriorly placed needle ordered from endocardial to epicardium, 10 electrodes of the anterior aspect of the epicardial sock from the base (superior) portion of the heart to apex, and approximate 12-lead ECG locations (I, II, III, V1, V2, V3, V5, and V6). All three simultaneously recorded sets of signals captured control conditions. Right panel: Signals from the same electrodes acquired during significant ischemic stress. The heart rate for signals in the left panel was 70 bpm and the heart rate for signals in the right panel was 171 bpm.
Download figure:
Standard image High-resolution imageAll signals across the different recording domains were automatically time aligned because they were all recorded simultaneously and all signals in the figure show typically high quality and with low noise following standard filtering. The differences in signal morphologies between control and peak ischemia in the figure are dramatic with ST-segment deviations and T-wave changes through the myocardium (needles) and the superior leads of both the epicardial and precordial torso leads. The QRS complexes also showed Q waves and prolonged activation duration throughout most of the regions.
3.2. Processing and visualization pipeline
To register all elements of the anatomy and electrode locations and visualize these signals, we used a novel processing and visualization pipeline that leveraged tools from a combination of open-source projects. Figure 4 shows one example of the electrode locations and thoracic anatomy after registration into the same coordinate space. Panel (A) in the figure shows the epicardial sock and measurement electrodes (black dots) and the plunge needles (purple points at the ends of cylinders), and the gray occluder placed over the red LAD. The sock electrodes were evenly distributed around the entire ventricles, from the apex to the base. Panel (B) shows a subset of the torso surface electrodes (black dots) and the overall electrode coverage (orange surface) in a cutaway view of the torso with the heart partially visible (in red). The distance between intramural plunge needles was typically 9–11 mm, the distances between epicardial recording electrodes in the range of 6–8 mm, and the spacing between torso surface electrodes was 4–5 cm.
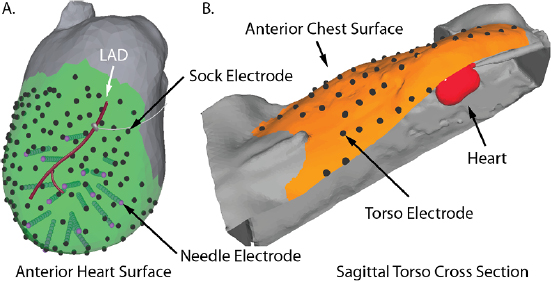
Figure 4. Example geometric registration. Panel A: Epicardial (black dots) and needle electrodes (purple dots and associated cylinders) are registered to the high-resolution heart surface (gray) generated from MRI images. Panel B: The heart (in red) and the torso electrodes (black dots) are registered to the (high resolution) torso surface. The orange region shows the electrode coverage on the torso.
Download figure:
Standard image High-resolution image3.3. Ischemic load control
Figure 5 shows an example of the results from the same episode of induced ischemia, in which we rapidly stimulated the heart under reduced coronary flow. Panel (A) shows the control values of ST40% potentials in all three regions and panel (B) shows the this same parameter during peak ischemic load. The range of measured ST40% values during peak ischemia was −1 mV to +11 mV in the intramural plunge needles, −2 mV to +7 mV on the epicardial sock, and −0.2 mV to +0.2 mV on the torso surface. Typical clinical indications for acute myocardial ischemia are ST segment deviations of more negative than −0.1 mV or more positive than +0.2 mV
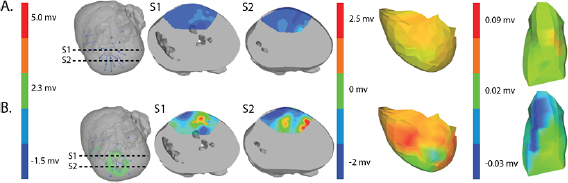
Figure 5. ST40% Potential measurements over all three sampled regions panel A: Control recording of ST40% within the myocardium, on the epicardial surface, and on the torso surface. Panel B: Peak ischemia values over the same locations within the same episode. The leftmost elements of both panels shows the locations of two slices, S1 and S2, through the heart and the potentials over these slides. The center elements contain epicardial potentials from the sock and the rightmost elements the equivalent torso potentials.
Download figure:
Standard image High-resolution image3.4. Model validation
3.4.1. Effects of surgery and electrode placement
Table 1 shows recorded torso potentials before and after surgery and the placement of the epicardial sock and needle electrode arrays during one experiment. Using a paired Student's t-test, the QRS interval and QRS amplitude showed no significant difference on the torso surface recordings before and after placement of the electrode recording equipment.
Table 1. Recorded torso potentials prior to sternotomy, with no sock or needle electrodes placed, compared to those acquired after placement of the cardiac electrodes and closure of the chest. Values were the mean and standard deviations across all torso electrodes.
| Metric | Prior to sternotomy | After chest closure |
|---|---|---|
| QRS Interval (ms) |  |
 |
| QRS Peak to peak amplitude (mV) |  |
 |
| ST40% (mV) |  |
 |
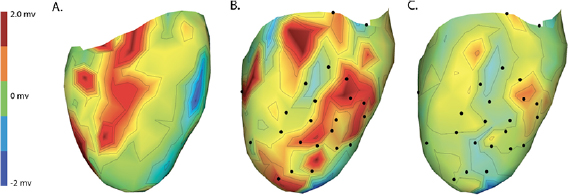
Changes caused by the placement of needle electrode arrays were also observed on the epicardial sock in figure 6 and table 2. Figure 6 shows ST40% potentials measured on an example sock array before, immediately after, and 90 min after placement of the transmural plunge needles. Immediately following needle placement there is an increase in ST40% potentials which recover to below baseline recordings within 90 min of final needle placement. Table 2 shows little changes to relevant ECG parameters before and after 90 min rest following needle placement. There was no significant difference in QRS amplitude before and after placement of the plunge needles (p > 0.05). There was, however, a significant difference in QRS interval before and after placement of transmural plunge needles (p < 0.05).
Figure 6. Recorded epicardial sock electrode ST40% potentials during electrode placement and after recovery. Panels A–C contain spatial maps of the epicardial ST40% recordings prior to, immediately following, and 90 min after needle placement, respectively. Black nodes correspond to approximate needle insertion locations and all three maps use the same color scaling with maps in panels A and B showing color saturation at maximum values of 2.3 mV.
Download figure:
Standard image High-resolution image
Table 2. Recorded epicardial sock potentials before, 30 min after, and 90 min after placement of needle electrodes. Values were the mean and standard deviations across all sock electrodes.
| Metric | Prior | 30 min | 90 min |
|---|---|---|---|
| QRS interval (ms) |  |
 |
 |
| QRS Peak to peak amplitude (mV) |  |
 |
 |
| ST40% (mV) |  |
 |
 |
3.4.2. Canine versus porcine species
Tables 3 and 4 show a statistical comparison of signals recorded for both canine and porcine subjects during sinus rhythm and atrially paced beats at control rates. Canine subjects showed larger voltages across all surfaces compared to porcine. Results in table 4 show no significant difference between QRS intervals (p > 0.05), however, QTc intervals were significantly different between species (p < 0.05).
Table 3. Table showing the recorded voltages separated by canine, porcine, and different recording surfaces. S and AP stand for Sinus and Atrial Paced recordings, respectively, QRS Amp and VRange stand for QRS peak to peak amplitude and voltage range across all electrodes, respectively. Each metric was derived from each individual electrode.
| Canine (n = 2) | Porcine (n = 3) | |||||
|---|---|---|---|---|---|---|
| Metric | Needles (mV) | Sock (mV) | Torso (mV) | Needles (mV) | Sock (mV) | Torso (mV) |
| S QRS Amp |  |
 |
 |
 |
 |
 |
| AP QRS Amp |  |
 |
 |
 |
 |
 |
| S VRange | (0.01–47.30) | (0.002–40.73) | (0.007–3.20) | (0.006–29.00) | (0.005–29.31) | (0.0002–1.10) |
| AP VRange | (0.01–47.59) | (0.002–41.41) | (0.007–3.14) | (0.002–27.42) | (0.006–28.90) | (0.005–1.48) |
| Peak ST40% |  |
 |
 |
 |
 |
 |
Table 4. Table showing the recorded time intervals in canine versus porcine subjects. Each metric was derived from the from a manual marking of the root-mean-squared (RMS) signal.
| Metric | Canine (n = 2) | Porcine (n = 3) |
|---|---|---|
| Sinus QRS interval (ms) |  |
 |
| Atrial paced QRS interval (ms) |  |
 |
| Sinus QTc interval (ms) |  |
 |
| Atrial paced QTc interval (ms) |  |
 |
4. Discussion
In this study we developed a novel experimental approach that supports comprehensive, high-resolution, three-dimensional exploration of the development and electrical manifestations of myocardial ischemia. We have shown that it is possible to create controllable, transient myocardial ischemia documented by measurements of bioelectric time signals from the heart and torso and associated anatomical images. We have shown that it is also feasible using open source software tools to process these recordings and visualize the spatial and temporal development of ischemia. Specific improvements over other reported models include simultaneously measuring bioelectric signals within the myocardium, on the heart surface, and on the torso surface in a physiologically and anatomically realistic setting of a closed chest under cardiovascular and respiratory control. Our previous studies reported on progress in controlling ischemic load via hydraulic occlusion of coronary vasculature combined with rapid pacing or pharmacological stress (Shome et al 2007, Aras et al 2009, 2011b, Aras et al 2011a, 2014,). We have also created a signal processing pipeline and registration system to generate the associated geometric model and to visualize the electrical signals in three-dimensional space, across geometries, throughout an ischemic intervention (Rodenhauser et al 2018, Berguist et al 2019).
Previous studies have reported similar, closed chest animal models (Spach et al 1977, Bear et al 2015a, Cluitmans et al 2017), but none have achieved the extent and resolution of coverage of this study, nor were they designed to explicitly study myocardial ischemia. The first such reports by Spach et al showed that a re-closed torso preparation was surgically feasible. They achieved simultaneous recordings from 200 sites within the myocardium, 20–30 sites on the epicardium, and 50 sites on the torso surface (Spach et al 1977). While a masterful achievement, the limits of technology at that time restricted the scope and resolution of the measurements and also the reconstructions and visualization of the results. Bear et al again achieved the closed-chest preparation in the early 2000s, but they did not record electrical signals from within the myocardium, but rather the ventricular and torso surfaces (Bear et al 2015b). Finally, Cluitmans et al succeeded in placing epicardial and torso surface electrodes, but they, too, had no recordings from within the myocardium and focused their approach on activation sequence recovery in order to validate their electrocardiographic imaging (ECGI) approaches (Cluitmans et al 2017). Another important element missing from these preparations was the ability to control ischemic load on the heart. None of these preparations had an efficient and standardized way to induce this pathology, which further limited their application to the study of myocardial ischemia.
Our early findings using a somewhat simpler experimental model of myocardial ischemia have motivated both the reported advances and additional interventions and analyses. Results from those studies suggested a mechanism of variable, distributed ischemia development, in sharp contrast to conventional assumptions. For example, we have showed that distributed ischemia was more likely to form in the midmyocardium rather than at the endocardial borders. Results from studies that capture the three-dimensional extent of intramyocardial ischemia by means of the needle electrodes have also motivated simulation studies and allowed us to compare measured and simulated epicardial potentials (Burton et al 2016, 2018, 2018b), studies that allowed us to refine the understanding of the fundamental nature of intramyocardial bioelectric sources (Burton et al 2018b).
The data collected from the experiments conducted by Aras et al also supported studies of ECGI and simulation of ischemia, which have shown that representing ischemia with realistic source models produces more accurate potentials on the heart surface than those based on simplified source models or those anchored to the subendocardium (Burton et al 2011, 2018, 2018b). However, these studies all lacked measured body-surface potentials, limiting their translational impact. The combination of these findings and other similar preliminary results has motivated our novel experimental preparation. Following analysis, these experimental datasets will be made publicly available on the experimental data and geometric analysis repository (EDGAR) that hosts datasets for such applications (Aras et al 2015).
Both canines and porcines were used in this experimental preparation, providing an opportunity to compare their responses to acute ischemia and at least speculate on the relevance of these responses to humans. There are relevant anatomical and physiological differences between the two species and humans that may contribute to the differences seen in the measured bioelectric fields. First, canines have an extensive coronary collateral vascular network which decreases the amount of ischemia induced during an ischemic intervention, unlike humans and swine, who have comparatively limited coronary collateral circulation (White et al 1992). Second, the swine conduction system is located in the midmyocardial region, unlike humans and canines, which have conduction systems anchored on the endocardial border (Verdouw et al 1983). While both species showed very similar QRS duration, the canine subjects show shorter QT intervals and substantially larger amplitudes of QRS complexes, T waves, and ST-segment shifts than the porcine subjects. The explanations for the amplitude findings could be twofold as the canines had larger heart sizes (measured as nearly double the tissue volume) and also closer distances from the heart to the torso surface, which were reflected by relatively larger increases in torso potentials than cardiac potentials. The slightly reduced QRS duration in canines may be due to the differences in conduction system between the species. The increased QTc duration between species could explain the increased susceptibility of porcine subjects to ventricular fibrillation during procedures and interventions on the heart.
We also carried out careful evaluations of the impact of both instrumenting the heart and closing the chest on torso potentials and inserting the needle on the epicardial potentials. On the torso surface, we found relatively small and insignificant changes in the QRS duration and QRS amplitude values before and after surgery indicating no significant insulative effects from the needles or epicardial sock. However, there was a change in the measured ST40% potentials before and after surgery, as measured on the torso surface. These changes remained a small fraction of those observed during acute episodes of myocardial ischemia and may arise due to the effects of anesthesia and general injury from the procedure.
Immediately following needle insertion, there was a substantial and expected increase in ST40% epicardial potentials in the regions explored by the needles. However, 30 min after the needles were in place, the ST40% values had returned to levels obtained prior to needle placement and at 90 min, ST40% values had fallen below the original baseline levels. We suspect that the levels fall below baseline values because the recordings at baseline were immediately after the midline sternotomy and severing the pericardium, which could already insult the heart and increase epicardial potentials. To create context for these injury potentials, ST40% changes immediate following insertion varied between −2 and +2 mV, while the changes during peak ischemic stress were tenfold larger, from −10 to +20 mV. Changes in QRS duration following needle insertion were also minimal and recovered to near normal levels after 90 min. These results suggest that our recording and occlusion equipment did not substantially change the overall electrical function of the heart.
Creating and standardizing this experimental preparation presented several challenges and retains several limitations. We had to manufacture very high capacity (1024 channel) signal-acquisition equipment to record simultaneously from the different high-density electrode arrays. Such equipment is becoming available on the market, albeit at either high cost or only with substantial customization. Interfacing so many signals from individual electrodes designed for different locations and capturing signals at a range of amplitudes spanning two orders of magnitude also presents instrumentation challenges that result in some compromises in the achievable dynamic range and signal quality. Another challenge was maintaining the stability of the animal model in the face of surgical insult. Specific challenges included the invasiveness of the procedure, puncturing the heart wall with intramural plunge needles, and the resulting increased likelihood of cardiac arrhythmia, which was mitigated in swine with constant low-dose lidocaine infusions. There was inevitable variability in ischemic responses across different animals and experiments because of difference in cardiac and coronary anatomy and physiology. To reduce such inconsistencies, we placed the hydraulic occluder at approximately the same segment of the LAD for each experiment and also developed 'stress protocols' at the start of each experiment to capture individualized values for parameters such as maximal heart rate and level flow reduction that the subject could tolerate. Despite this approach, inconsistencies are typical in most large-animal preparations and require that the resulting measurements be considered somewhat independently. Finally, because of difference in human and animal anatomy, human 12-lead ECGs are impossible to completely recreate. Therefore, we approximated the location of each lead based on replicating the spatial relationships between each electrode location and the heart.
Our experimental model has several important applications in acute myocardial ischemia detection and the potential to contribute to the knowledge of acute ischemia. First, the addition of torso-surface recordings makes this the most clinically translational animal model of electrocardiography to date. Even with interspecies differences, this model still accurately detects and controllably induces episodes of transient myocardial ischemia that generate realistic electrical changes on the torso-surface ECGs.
While this experimental model was developed to detect and examine acute ischemia, it could also be used to study other cardiac pathologies. For example, it would be very straightforward to induce complete acute infarction to simulate STEMI or NSTEMI similar to clinical studies in humans using percutaneous coronary intervention balloon angioplasty. We could also induce premature ventricular contractions over a wide range of intramyocardial locations via bipolar stimulation with the needles and record the resulting three-dimensional activation patterns throughout at least a portion of the heart as well as over the epicardium and body surface. Because of the control of pacing location and rate, the model could also be used to study general arrhythmia formation and development. Even though intramural coverage is restricted to a region of the heart, the epicardial sock provides 360-degree, high-resolution coverage of the ventricles that could be used to examine complex wavefront development.
Such data sets have clear value for developing and validating bioelectric field models, specifically for electrocardiographic imaging (ECGI). ECGI requires an anatomical model of the heart and torso surface and high-density recordings of potentials on the body surface (Brooks and MacLeod 1997, Pullan et al 2010, Rudy and Lindsay 2015). Validation of ECGI requires measurements from the heart against which to compare computed values (Oster et al 1997, MacLeod and Brooks 1998, Brooks et al 1999, Potyagaylo et al 2014, Cluitmans et al 2015, Dubois et al 2015, Shah et al 2015, Wang et al 2016, Wann et al 2018, Cluitmans et al 2018). The inclusion of both epicardial and intramyocardial source measurements will provide unique opportunities for ECGI approaches that can be specific to ischemia or focus on general detection of localized cardiac activity.
In summary, we have significantly improved an experimental model of electrocardiographic evaluation of myocardial ischemia to be used as a novel standard for studies of mechanisms, bioelectric source computations, and cardiac simulation and modeling studies. With these data now achievable and available, significant strides can be made to improve the accuracy of noninvasive clinical tests to detect and localize myocardial ischemia. Future goals of this model includes improving its stability and further perfecting our experimental preparation. We will use it to assess and validate several key modeling and physiological parameters such as three-dimensional conduction velocity, bioelectric field and source models, different approaches to clinical stress testing, and ECG Imaging.
Acknowledgments
We would like to acknowledge the support from the Nora Eccles Treadwell Cardiovascular Research and Training Institute staff including Jayne Davis, Ala Booth, Wilson Lobaina, and Bruce Steadman for preparing and maintaining equipment and coordinating logistics of the experiments.
Author contributions
Brian Zenger:
- Scientific need and development
- Data analysis
- Manuscript preparation
- Experimental model design
- Experimentation setup and execution
Wilson W Good:
- Scientific need and development
- Data analysis
- Manuscript preparation
- Experimental model design
- Experimentation setup and execution
Jake A Bergquist:
- Scientific need and development
- Data analysis
- Manuscript preparation
- Experimental model design
- Experimentation setup and execution
Brett M Burton:
- Scientific need and development
- Experimentation setup and execution
Jess D Tate:
- Scientific need and development
- Experimentation setup and execution
Leo Berkenbile:
- Scientific need and development
- Experimentation setup and execution
- Recording equipment design and manufacturing
Vikas Sharma:
- Scientific need and development
- Experimental expertise
- Experimentation execution
Rob S MacLeod:
- Scientific need and development
- Data analysis
- Manuscript preparation
Novel translational experimental ischemia model
In this manuscript we have created the first experimental preparation to record intramural, epicardial surface, and torso surface electrical potentials from the heart during controlled episodes of acute myocardial ischemia. We have also created a data processing and visualization pipeline for investigation and analysis.
Grant support
Support for this research came from the NIH NIGMS Center for Integrative Biomedical Computing (www.sci.utah.edu/cibc), NIH NIGMS Grant No. P41GM103545 and the Nora Eccles Treadwell Foundation for Cardiovascular Research.