
Abstract
Respiratory rate (RR) is an important physiological parameter whose abnormality has been regarded as an important indicator of serious illness. In order to make RR monitoring simple to perform, reliable and accurate, many different methods have been proposed for such automatic monitoring. According to the theory of respiratory rate extraction, methods are categorized into three modalities: extracting RR from other physiological signals, RR measurement based on respiratory movements, and RR measurement based on airflow. The merits and limitations of each method are highlighted and discussed. In addition, current works are summarized to suggest key directions for the development of future RR monitoring methodologies.
Export citation and abstract BibTeX RIS

Original content from this work may be used under the terms of the Creative Commons Attribution 3.0 licence. Any further distribution of this work must maintain attribution to the author(s) and the title of the work, journal citation and DOI.
1. Introduction
Respiration involves a complex interaction between the central nervous system, respiration-related motor neurons, and the muscles of respiration (Sowho et al 2014). The effectiveness of the respiratory system also depends on the circulatory system (heart and blood vessels) (Elstad et al 2018). The central nervous system is responsible for determining respiratory drive in accordance to the input from peripheral and central chemoreceptors e.g. lungs, central chemoreceptors (pH), carotid and aortic chemoreceptors (CO2 and O2), and baroreceptors (blood pressure) (Mitchell 2004). Respiration-related motor neurons innervate the respiratory pump muscles to control alveolar ventilation (the production of respiratory rate and tidal volume) based on the input of central nervous system (Sowho et al 2014). Should hypoxaemia and hypercarbia be sensed by the peripheral and central chemoreceptors then respiratory rate (RR) and tidal volume are regulated to deliver oxygen to the pulmonary and systemic circulation and eliminate carbon dioxide from the lungs to return the system to the equilibrate state.
Clinically, RR is generally defined as the times of respiration observed during a minute (in breaths per minute, or bpm). RR is a vital sign whose abnormity is an important indicator of serious clinical events. Any derangement in the body system that causes hypoxaemia or hypercarbia could be detected by measuring RR. There is substantial evidence showing that an abnormal respiratory rate is a predictor of such potentially serious clinical events as intensive care unit (ICU) readmission (Cardoso et al 2014, Mlgaard et al 2016), cardiopulmonary arrest (Hodgetts et al 2002, Maharaj et al 2015), chronic heart failure (Ponikowski et al 2001a, 2001b, 2001c), pneumonia (Rambaud-Althaus et al 2015), pulmonary embolism (Egermayer et al 1998, Galle et al 2001, Jiménez et al 2016), weaning failure (Emídio Jorge 2013), and overdose (Hochhausen et al 2018). RR is a better discriminator than blood pressure and pulse rate in identifying high-risk patient groups of cardio-pulmonary catastrophic deterioration, since relative changes in RR are of a much greater magnitude and are therefore more likely to be better at discriminating between stable patients and patients at risk (Subbe et al 2003). This result was also supported by the research of Buist et al which suggested that an abnormal RR (<6 bpm or >24 bpm) is a stronger predictor of mortality than heart rate or hypertension (Buist et al 2004). A subtle deviation of RR as 4 bpm from the normal range could indicate an imminent medical emergency such as cardiac arrest due to cerebral hypoxia (Flenady et al 2017). More importantly, abnormal RR is a common feature hours before serious deterioration and consequent cardiac arrest (Smith and Wood 1998). Hypoxaemia and hypercarbia do not always increase RR and tidal volume. Medications such as opiates and anaesthetics depress the respiratory drive and the respiratory response to hypoxia and hypercarbia. In this case, RR monitoring is very important in the safe and effective administration of anaesthesia, since the lowered RR often reflects the reduced consciousness (Cretikos et al 2008, Ermer et al 2017). Due to its potential in the early detection of patient deterioration, respiratory rate has been introduced to a range of early warning systems (Subbe et al 2001, Prytherch et al 2010, Williams et al 2012).
Although RR is clinically a strong indicator of serious events, RR measurement is still widely performed by manual counting with inaccurate results (Kellett et al 2011), or neglected (Flenady et al 2017). Research has indicated that RR measurement by nursing staff could be unreliable (Edmonds et al 2002, Lim et al 2002, Lovett et al 2005, Bianchi et al 2013, Flenady et al 2017). RR was often not recorded routinely, even when the patient's primary problem is a respiratory condition (Smith and Wood 1998, Edwards and Murdin 2001, Chellel et al 2002, Helliwell et al 2002, Hodgetts et al 2002, Hudson 2004, Ryan et al 2004, McBride et al 2005, Hogan 2006), possibly due to the unreliable results and poor compliance with timely procedures in a busy triage setting (Bianchi et al 2013). Considering the reliable monitoring of other vital signs such as heart rate and blood pressure, which can be automatically performed using simple electronic devices (Edwards and Murdin 2001), it is reasonable to deduce that the lack of a reliable automated RR monitor system contributes to the unsatisfactory situation of patients' RR monitoring (McBride et al 2005).
Clinically, RR could be recorded with a range of techniques, including spirometry, capnometry, and pneumography, as listed in table 1. These techniques often require cumbersome and expensive devices that may interfere with natural breathing, and can be unmanageable in certain applications such as ambulatory monitoring, stress testing, and sleep studies (Bailón et al 2006). Automatic, reliable and convenient sensors and devices could largely improve the situation of RR monitoring.
Table 1. Current mainstream methods used for clinical RR monitoring.
| Methods | Advantages | Limitations |
|---|---|---|
| Manual counting | Easy to perform, non-contact | Inaccurate, time-consuming |
| Spirometer | Accurate, simultaneous measurement of multiple respiratory parameters | Interfere with natural breathing |
| Difficult for continuous RR monitoring | ||
| Capnometry | Accurate, easy to perform, able for continuous RR monitoring, simultaneous measurement of biochemical parameters. | Uncomfortableness caused by contact, special devices needed for analysis |
| Impedance pneumography | Accurate, continuous, simultaneous measurement of multiple respiratory parameters | Difficult to perform, special devices needed for analysis |
In recent years, owing to the technical improvements and prolonged lifespan, the development of medical devices has gained power. RR could be monitored automatically by the electronic monitors, with various benefits in pathological and physiological applications. Automatic RR monitoring could predict potentially serious clinical events such as cardiac arrest or admission to the ICU. The deviations of RR from the normal range during the measurement can be identified as high risk up to 24 h before the event with a specificity of 95% (Al-Khalidi et al 2011). Automatic RR monitoring is more sensitive than manual methods in detecting tachypnea (Kellett et al 2011, Bianchi et al 2013). In sleep studies, automatic RR monitoring could improve the diagnosis of apnea, which currently depends heavily on the expensive polysomnogram (Bailón et al 2006, Schöbel et al 2018).
Automatic respiratory monitoring devices are in urgent need to improve the clinical RR monitoring. In recent years, many automatic RR monitoring methods have been proposed. Based on different mechanisms, these methods are on different stages of development with different advantages and limitations. This review aimed to provide a technical overview of mainstream emerging methods of automatic RR monitoring.
2. Methods of respiratory rate measurement
In this section, the automatic respiratory rate measurement methods are reviewed. The approach for literature search was introduced. The methods were technically classified by their mechanisms (hardware and algorithm), with the operational process, the advantages, the limitations, and major applications discussed.
2.1. Literature search strategy
2.1.1. Preliminary search
This literature review includes published works that have been peer-reviewed. Our search was mainly focused on articles in journals, chapters of periodicals and proceedings of conferences written in English published between 2000 and 2018. We firstly searched on Google Scholar search engine with key words 'respiratory rate', 'respiration rate', 'breathing rate', 'tachypnea', or 'apnea', in combination with 'measurement', 'monitoring', 'detection', 'estimation', 'wearable devices', or 'extraction'. More than 800 papers were found. From the titles of the works, technical keywords were extracted including electrocardiogram (ECG), photoplethysmogram (PPG), radar, thermal imaging, and others.
2.1.2. Technical categorization
Due to the large quantity of literature, categorization was firstly performed based on the technical keywords, as shown in the titles of sections from 2.2.1–2.4.3. These techniques were then categorized into the methods based on the respiratory modulation on other physiological signals (section 2.2), methods based on volume changes and body movement (section 2.3), and methods based on airflow changes (section 2.4).
2.1.3. Categorized search
For each technique, searches were conducted with its technical keyword combining the keywords in the preliminary search, on PubMed, IEEE Xplore, ACM Digital Library, and Google Scholar, between 2000 and 2018. The latest 20 papers were selected for each technique. The selected papers were checked to filter out some duplicated works, or following-up works with identical technical basis. For ECG and PPG, due to the large quantity of papers in the last five years, we chose the review papers and preserved some of the newest original algorithmic studies only. Finally, 235 papers were included in this review.
2.2. Methods based on the respiratory modulation on other physiological signals
With subjects periodically inhaling and exhaling, there are significant respiratory influences on physiological signals such as ECG, PPG, ballistocardiogram (BCG), seismocardiogram (SCG), osillometric cuff pressure pulses (OscP) and Korotkoff sounds (KorS), which are measured by electronic devices for different clinical applications. ECG records the electrical activity of the heart. PPG reflects the volumetric changes in blood in peripheral circulation. BCG is a measurement of the recoil forces of the body in reaction to cardiac ejection of blood into the vasculature while the seismocardiogram (SCG) represents the local vibrations of the chest wall in response to the heartbeat (Inan et al 2015). The OscP and KorS are the oscillometric and auscultatory methods that are widely used for blood pressure measurement (Chen et al 2016b). All these signals are modulated by respiration in various ways. Therefore RR could be estimated by the algorithms based on respiratory modulation. Compared with other methods, the RR estimation based on respiratory modulation of other physiological signals is less expensive, non-invasive and convenient, as RR could be measured simultaneously without adding extra instrumentation. In this section, RR extraction methods based on the respiratory modulation phenomenon will be detailed.
2.2.1. Mechanisms of respiratory modulation on ECG, PPG, BCG, SCG, OscP and KorS
Respiratory modulations of ECG, PPG, BCG, SCG, OscP and KorS have different physiological mechanisms. For a certain signal, its amplitude, baseline, waveform, and frequency could be changed during inhalation and exhalation (figure 1). During inspiration, the apex of the heart moves towards the abdomen due to diaphragm contraction, whereas during expiration, the apex moves upwards (O'Brien and Heneghan 2007). Consequently, the periodic changes of transthoracic impedance and positions of the ECG electrodes relative to the heart (Clifford et al 2006, O'Brien and Heneghan 2007) result in the morphological changes, amplitude modulation (AM) and baseline wander (BW) of the ECG signal.

Figure 1. Idealised respiratory modulation of PPG (left) and ECG (right). During three respiratory cycles, from top: no modulation, baseline wander (BW), amplitude modulation (AM), and frequency modulation (FM), as of Addison et al (2012) and Mukhopadhyay (2015). Adapted from Charlton et al (2016a). © 2016 Institute of Physics and Engineering in Medicine. CC BY 3.0.
Download figure:
Standard image High-resolution imageAlthough the mechanisms of the PPG signal have not been fully understood, it was observed that respiration directly influences the fluctuations in venous return, stroke volume, and arterial blood pressure, resulting in AM and BW of PPG (Meredith et al 2012), as shown in figure 1.
Reflecting the minor body movements caused by cardiorespiratory effects, BCG and SCG are composed of several independent peaks. These peaks indicate the cardiovascular activities in different phases of a cardiac cycle. By changing the position and amplitude of these peaks, respiration influences the waveform and amplitude of BCG and SCG (Pandia et al 2012, Alamdari et al 2016).
Similar to PPG, the tissue volume changes the pressure of the OscP measurement site, which is reflected on the amplitude of OscP signal. Despite the debated genesis of Korotkoff sounds, it is widely supposed that KorS is generated by the distension of the arterial wall caused by the changing transmural pressure gradient (McCutcheon and Rushmer 1967, Tavel et al 1969, Ur and Gordon 1970, Venet et al 2000). The respiratory modulation of stroke volume will directly influence the force deployed in opening the artery and consequently the blood flow sound, reflected by the amplitude of the KorS signal. Experiment results also showed the existence of amplitude modulation on OscP and KorS by respiration (Zheng et al 2014, Chen et al 2016a).
Frequency modulation effect, which exists commonly in ECG, PPG, BCG, SCG, OscP and KorS, is based on the respiratory sinus arrhythmia (RSA) in which the heart rate variation is associated with respiration, as shown in figure 2. Heart rate (HR) accelerates during inspiration and slows down during expiration (Yasuma and Hayano 2004, Grossman and Taylor 2007). This is a cardiorespiratory phenomenon universally observed among vertebrates (Yasuma and Hayano 2004). HR could be demodulated from many physiological signals, enabling the extraction of RR (figure 1).

Figure 2. Respiratory sinus arrhythmia (RSA). The heart rate increases during inhalation and decreases during exhalation, resulting in the longest heart period during exhalation (L-IBI) and the shortest heart period during inhalation (S-IBI). Reproduced from Nederend et al 2016. Copyright © 2016 by the authors. CC BY 4.0.
Download figure:
Standard image High-resolution image2.2.2. Algorithms for respiratory rate extraction from ECG, PPG, BCG, SCG, OscP and KorS
2.2.2.1. General process of RR extraction
Theoretically, the respiratory rate can be derived from the variations in the amplitudes or the beat-to-beat intervals of a physiological signal if the heart rate is at least two times greater than the respiration rate, which is often the case. Based on this, many algorithms have been proposed for extracting RR from ECG, PPG, BCG, SCG, OscP and KorS. Algorithms can be divided into three stages: extraction of respiratory signals, estimation of respiratory rate, and fusion of estimates (figure 3) (Mukhopadhyay 2015, Charlton et al 2016a).

Figure 3. The three stages of estimating RR from other physiological signals. The dashed stage is optional. Adapted from Charlton et al (2016a). © 2016 Institute of Physics and Engineering in Medicine. CC BY 3.0.
Download figure:
Standard image High-resolution imageIn the first stage, the respiratory signal could be extracted by AM, FM, BW, and the changes in waveform between cardiac cycles caused by respiration. The techniques are often applicable to all the six signals since they are all primarily cardiac in origin, with secondary respiratory modulations of much lower magnitude (Mukhopadhyay 2015). The extraction could be feature- or filter-based. A systematical evaluation of major algorithms on RR extraction from ECG and PPG indicated that for respiratory signal extraction, feature-based technologies performed better than filter-based technologies (Charlton et al 2016a). Therefore, feature-based technologies were adopted by most of the top ranked methods (Charlton et al 2016a). Feature-based extraction of a respiratory signal is based on the time series of beat-by-beat feature measurements. Beat detection is typically performed using a segmentation algorithm (such as that proposed by Li et al (2010) for PPG signals and Pan and Tompkins (1985) for ECG signals). To derive the respiratory signal, the AM, FM and BW methods are then performed by measuring the pulse peak-to-trough amplitude (Karlen et al 2013), the beat-to-beat intervals (between consecutive fiducial points such as pulse peaks (Orphanidou et al 2013)), and the composite of pulse peak and trough amplitudes (Ruangsuwana et al 2010, Karlen et al 2013). Filter-based extraction consists of filtering the raw signal to attenuate non-respiratory frequency components, which is typically performed using a band-pass filter (Lindberg et al 1992), continuous wavelet transform (Addison and Watson 2004, Lin et al 2017) and a centred-correntropy function, which incorporates the time structure and statistical distribution of a signal (Garde et al 2014).
In the second stage, RR could be derived from the respiratory signal in the time or the frequency domains. The time-domain breath-detection techniques performed better than frequency-domain techniques, and were therefore applied in top-ranked algorithms to estimate RR (Charlton et al 2016a). Frequency-domain techniques are commonly used but require evenly sampled data. Consequently, respiratory signals are often re-sampled onto an even grid prior to frequency-domain analysis. Fourier analysis has been used to calculate the frequency spectra of respiratory signals, from which the RR could be typically identified as the frequency peak corresponding to the maximum spectral power (Garde et al 2014). When RR is non-stationary across the window of data analyzed, the short-time Fourier transform (STFT) has been proposed to improve the accuracy of RR estimation (Shelley et al 2006a). A study comparing various algorithms extracting RR from PPG derived by the built-in cameras of smartphones and tablets indicated that the accuracy of all the algorithms decreased when RR was higher than 26 bpm (Nam et al 2014). Autoregressive (AR) modelling has been used to identify the resonant frequencies contained within a respiratory signal, with the accuracy improved for high RR extraction (Lee and Chon 2010).
The final step is to fuse RR estimates derived from different signals or by different algorithms. Firstly, for a certain physiological signal, the estimates derived by different modulations could be fused. The magnitude of each respiratory modulation may differ between individuals and physiological conditions. For example, the FM and AM derived the best RR estimation from the PPG signal respectively under resting and motion states (Shen et al 2017). Therefore averaging all RR estimates with different accuracies could hardly improve the overall accuracy. The error in RR estimation reached 3 bpm using the averaged value of RRs derived by AM, FM, and BW of PPG signal (Karlen et al 2013). However, after selecting the respiratory-related morphological parameters from the SCG signal, the averaged value could achieve the bias of −0.42 bpm compared with the reference RR derived by the respiratory belt (Pandia et al 2012). Some fusion methods based on signal quality have been proposed such as discarding the averaged RR if the range of RRs derived from FM, AM, and BW is greater than 4 bpm (Charlton et al 2016b), selecting the RR derived from ECG or PPG with the least temporal fluctuations within 60 s (Orphanidou 2017), adopting the RR value which appeared in more than half of the thirteen PPG-derived respiratory signals, or adopting the averaged RR value after removing the outliers (Cernat et al 2015). More advanced fusion methods were based on the statistical and probabilistic characteristics of signals such as the fusion of RRs derived from PPG signal by AM, FM, and BW with Gaussian process regression (Pimentel et al 2015).
Furthermore, the fusion could be performed between RRs estimated from different signals or measured by different sensors. Machine learning methods, such as linear regression (LR), supporting vector regression (SVR) and principal component analysis (PCA) could be applied in fusing the respiratory quality indices (RQI) derived from ECG and PPG signals by AM, FM, and BW (Birrenkott et al 2018). The fusion of RRs derived from the FM, AM, and BW of PPG, and from the accelerometer and gyroscope, could be fulfilled under static and running states by naive Bayes inference and static Kalman filter (Shen et al 2017). Referring to the standard RR value measured by respiratory belt, the fusion of RRs of accelerometer and gyro-senso by Kalman filter improved the estimating accuracy by 4.6% to 9.5% compared with the accelerometer-derived RR (Yoon et al 2014). The fusion of RR derived from ECG, PPG, and accelerometers could be fulfilled by selecting the most accurate estimate under different physiological states according to the features of three methods, with RR errors within 4.4% compared with the gold standard of capnometry (Liu et al 2013).
2.2.2.2. Algorithms based on ECG
The RR extraction from ECG has been developed for decades, and has more algorithms with higher accuracy when compared with PPG-based methods (Charlton et al 2016a). Thirteen different algorithms for detection of the sleep apnea by RR extracted from ECG recordings were analyzed in Penzel et al (2002). The best algorithms made use of the frequency-domain features to estimate the changes in the heart rate and the effect of respiration on the ECG waveform. For the ECG signal, FM often derived more accurate RR compared with AM (Orphanidou 2017). Algorithms based on the FM of ECG could be fulfilled on smartphones for the portable and continuous RR monitoring (Crema et al 2017). However, as the physiological basis of FM, RSA is reduced in the elderly, but the ECG waveform variability exists regardless of age, possibly more applicable for RR extraction (Trobec et al 2012). Morphologically, the QRS wave of ECG is easy to extract to get the respiratory signal by AM. The high-frequency fluctuations of ECG reflect the respiratory effect on the muscle electric activity from which the respiratory signal could be derived by high-pass filtering (Helfenbein et al 2014). Other algorithms to derive respiratory signal from ECG include discrete Fourier transform (DFT) and the discrete cosine transform (DCT) based on morphological filtering, with better accuracy of RR estimation compared with the AM of R wave (Sharma et al 2015). The RR derived from FM and morphological parameters could reflect the effect of schizophrenia on the breathing pattern (Schmidt et al 2017). Based on the instantaneous values of the ECG-derived cardiac cycle length (R-R interval) and the dynamics of the cardiac cycle length series, the hidden Markov model and hidden semi-Markov model could be used for instant detection of apnea-bradycardia (Altuve et al 2012).
2.2.2.3. Algorithms based on PPG
PPG enabled the automated and continuous RR home-monitoring for the clinical screening of asthma, sleep apnea, and cardiovascular risks (Charlton et al 2016b). Many signal processing and machine learning techniques have been proposed for the estimation of RR from the PPG, including digital filter, short-time Fourier transform (STFT), continuous wavelet transform (CWT), empirical mode decomposition (EMD) and neural network (NN), independent component analysis (ICA), modified multi-scale principal component analysis (MMSPCA), variable-frequency complex demodulation (VFCDM), the autoregressive (AR) model, particle filter combining both time-invariant (TIV) and time-varying autoregressive (TVAR) models, pulse width variability, probabilistic approach, correntropy spectral density (CSD), and sparse signal reconstruction (SSR) in the spectral domain with RR tracking (RRT) then selects the most appropriate frequency component based on the previous RR (Ambekar and Prabhu 2015, Zhang and Ding 2016). Signal quality index (SQI), which reflects the presence of artefact in the signal, and respiratory quality indices (RQIs), which reflects exclusively the respiratory effect, were introduced into the pre-processing of PPG signal to enhance its quality for RR estimation (Birrenkott et al 2016). With decreased sampling frequency (Nam et al 2014), PPG signal could be derived on smartphones by contact detection on the finger, and by non-contact detection with imaging analysis (Papon et al 2015). Based on wavelet analysis, the automatic threshold selection of modified multiscale principal component analysis (MMSPCA) could extract a respiratory signal from short-length PPG signals (Motin et al 2017). The AM-based wavelet algorithms could derive RR from PPG and can be embedded in the micro-controller (MCU) of a pulse oximeter, creating the instantaneous RR monitoring (Lin et al 2017), which is applicable for clinical low-acuity care (Bergese et al 2017). Besides RR, the tidal volume could further be estimated from PPG using a recurrent neural network (Prinable et al 2017). However, considering the decreased intensity of PPG-derived respiratory signal with increasing RR, high RR is difficult to accurately detect from PPG signal by both FM and AM (Nam et al 2016a). The fusion of FM, AM, and pulse wave parameters enhanced the accuracy of PPG-based RR estimation on different smartphone devices (iPhone 4S, iPod 5, and HTC One M8). But the performance still degraded at higher rates (up to 30 bpm when using HTC One M8, and up to 36 bpm when using the iPhone 4S or iPod 5 devices) (Lázaro et al 2015). On smartphones and tablets, RRs derived from PPG signal by the autoregressive (AR) model, variable-frequency complex demodulation (VFCDM), and continuous wavelet transform (CWT) all indicated good accordance with the reference RR measured by a chest strap, but deviated from the reference value in high RR range (Nam et al 2014). Another unsolved issue was the differences between body sites in PPG-derived respiratory signal. It was observed that finger PPG derived better respiratory signals than ear PPG, and the respiratory signal from the arm was better than that from the forehead (Charlton et al 2017). This was due to the different ratios between cardiac and respiratory components of PPG signal on different body sites (Nilsson et al 2007). The frequency spectral analysis of PPG signal showed that respiratory signal from the forehead was at least ten times greater in intensity than that from the finger site (Shelley et al 2006b). However, Mayer waves are close to 0.1 Hz and strongly affect the PPG-derived respiratory signal from the forehead since it generates noise of ~0.1–0.2 Hz thereby at risk of disabling the reliability of RR extraction, while the finger was largely unaffected (Hernando et al 2017). Finally, PPG is afflicted by motion artifacts whose frequency band (usually below 0.2 Hz) overlaps respiratory frequencies (0.2–0.4 Hz). The modified multi-scale principal component analysis (MMSPCA) was proposed to extract respiratory signal from the PPG signal even with strong motion artifacts (Madhav et al 2013).
2.2.2.4. Algorithms based on BCG and SCG
Both BCG and SCG are three-dimensional (3D) in essence, but are often measured along the head-to-toe and dorsal-ventral directions respectively (Inan et al 2015). The location and direction of the sensor are therefore important for accurate BCG and SCG recording, but were often neglected (Inan et al 2015). BCG is influenced by the position and respiration (especially the residue volume during apnea), and is sensitive to the gravity (Martín-Yebra et al 2017) and motion artifacts (Hermann et al 2018). Despite the difference in waveform, BCG signals of different body sites were available for RR extraction (Vehkaoja et al 2015). Especially, the BCG estimation could be fulfilled on the sites such as behind the ear for portable RR monitoring (Da He et al 2010).
Currently, investigations on BCG and SCG mainly focused on the cardiac instead of respiratory effects. By combining different respiratory modulations on morphology and the frequency of SCG, the bias of derived RR in comparison with the reference value measured by the respiratory strap was −0.42 bpm, indicating that SCG is potential for RR monitoring (Pandia et al 2012). Two accelerometer-derived respiration (ADR) signals could be calculated by AM from the upper and lower envelopes of the SCG. By morphological analysis, a metric so-called the piecewise total harmonic distortion (THD) could identify which one of the lower and upper envelopes was the best ADR for detecting respiratory phases of the subject. The accuracy of piecewise THD in the selection of the correct envelope of SCG signal as an estimation of ADR was 84.6% (Alamdari et al 2016). The extraction of respiratory phase from SCG based on a support vector machine (SVM) algorithm showed that the time-domain features of SCG waveform (indicating the open and close of aortic valve, the cardiac cycle length) indicated higher total accuracies compared to other features (Zakeri et al 2016).
The wearable measurement of BCG and SCG could be fulfilled by an accelerometer, enabling the continuous RR monitoring (Inan et al 2015). When referring to the respiratory acoustic signal, the RR derived by filtering the SCG/BCG signal can achieve better accuracy than for PPG-derived RR (Haescher et al 2015). From the BCG measured by an accelerometer device under a bed mattress, RR and its temporal variability could be derived, with the results in accordance with polysomnography (PSG) (Nurmi et al 2016). BCG could be simultaneously extracted with other signals by fiber Bragg grating (FBG), with the maximum error in resultant RR of 1.7 bpm referred to the RR value derived by the respiratory strap (Chen et al 2014). RR and HR could be estimated from BCG recorded by the piezoelectric sensor, which is chargeable with GPS and Bluetooth for positioning and data transmission for clinical application (Hermann et al 2018). Similar with BCG and SCG, the geophone signals could monitor RR during sleep with the ability of simultaneously monitoring multiple subjects on a bed (Jia et al 2017).
2.2.2.5. Algorithms based on OscP and KorS
AM was applied in OscP and KorS for the extraction of respiratory signal (Zheng et al 2014), from which RR could be estimated as the peak of power spectral distribution (Di Marco et al 2012). Compared with the RR measured by the magnometer on the chest, the RR estimation was even more accurate under deep breathing (mean ± SD of error: −0.005 ± 0.053 bpm for OscP-derived RR, −0.010 ± 0.058 bpm for KorS-derived RR) than under normal breathing (0.006 ± 0.066 bpm for OscP-derived RR, 0.044 ± 0.083 bpm for KorS-derived RR). Considering the limited bias, the results suggest that RR estimated from OscP or KorS is a potential for clinical applications. However, under deep breathing, the blood pressure could decrease by 4.8 mmHg, approaching the threshold of 5 mmHg that could lead to incorrect treatment based on OcsP and KorS (Chen et al 2016a). Moreover, the amplitude of OscP was influenced by the RR value and the measurement cuff pressure (Zheng et al 2014), demanding more in-depth investigations.
The algorithm based on FM features of OscP and KorS performed better than AM-based algorithms (mean ± SD of error: 0.002 ± 0.047 bpm for OscP-derived RR, and −0.007 ± 0.056 bpm for KorS-derived RR, referred to the RR derived by a magnometer on the chest) (Chen et al 2016b). However, OcsP is sensitive to noise, and methods based on FM (RSA) would not be applicable in subjects with implanted permanent pacemakers, or present recurrent atrial fibrillation, bundle branch blocks, or flat heart rate variability (Damy et al 2010).
2.3. Methods based on volume changes and body movement
During inhalation and exhalation, there are periodic volume changes in the thoracic and abdomen areas with movements on the surface. These changes could be detected by accelerometers, gyrometers, radars and WiFi devices, imaging, and various sensors based on electromagnetic, piezoresistive, piezoelectric, and optical mechanisms. These constitute the majority of the methods that directly measure RR.
2.3.1. Accelerometers and gyroscopes
Accelerometers and gyroscopes can be used to capture signals modulated by respiration when appropriately positioned over the diaphragm. The position and orientation of the accelerometer or gyroscope are changed by chest wall expansion and contraction during respiration. A tri-axial accelerometer or gyroscope provides three measurements of the linear or angular accelerations in three orthogonal directions. The component required for analysis is the direction of the acceleration due to gravity in the accelerometer's coordinate system, which is modulated by respiration (figure 4). To obtain a respiratory signal, firstly a single, time varying, acceleration (linear or angular) vector is derived from the three measurements. Secondly, the rotation angle of the acceleration vector about the time-averaged predominant axis of rotation is calculated. Lastly, the respiratory signal is given by the angular velocity—the rate of change of the rotation angle with respect to time. The predominant axis of rotation could be calculated over an extended time period to reduce the effect of noise, which is of particular importance in mobile monitoring (Bates et al 2010). Finally, RR could be extracted from the respiratory signal by the methods such as PCA, as in the ECG- or PPG-based methods. It has been proved that a three-axial accelerometric system can successfully reconstruct the respiration-induced movement, which is necessary to determine the respiratory rate accurately (Jin et al 2009).
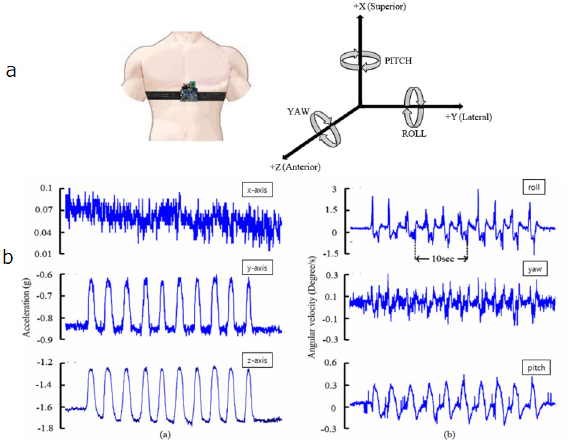
Figure 4. Derivation of RR from three-axial acceleration monitoring. (a) Left: The apparatus for accelerometric and gyroscopic recordings of chest wall displacement. Right: The linear and angular accelerations in three directions. (b) The recorded 3D linear and angular accelerations. Data were recorded under resting condition. The gyrosensor was attached at the epigastrium. Reproduced with permission from Yoon et al (2014).
Download figure:
Standard image High-resolution imageAccelerometer-derived RR conformed to the results of polysomnography (PSG) (Nurmi et al 2016) and manual observation (Jarchi et al 2018), which are the clinically standard methods. By using two juxtaposed accelerometers, the motion artefact could be eliminated from the simultaneous accelerometric signals, with resultant RR in accordance with the results derived by visual counting and spirometry on normal subjects and scoliotic and obese patients under resting and exercising situations (Lapi et al 2014). Therefore, the accelerometer has been applied to provide a reference RR value (Liu et al 2016, Shirkovskiy et al 2017) or reference signal for eliminating motion artefacts in some pilot studies of RR estimation (Sun and Thakor 2016). The accelerometer-derived respiratory signal or RR value could be combined with those derived by other methods such as ECG (Liu et al 2013), PPG (Shen et al 2017), camera (Hernandez et al 2014) and pyro-electric infrared (PIR) sensor (Erden et al 2015). Finally, the small size of state-of-art accelerometers enables its versatile application in the smartphones (Camcı et al 2017), smartwatch (Trimpop et al 2017), mattress-based sleep monitoring (Nurmi et al 2016), and head-mounted wearable device (Hernandez et al 2014).
A gyroscope could derive more accurate RR estimation (mean ± SD of the error referred to the value derived by the chest strap: 1.39 ± 2.29 bpm) than the accelerometer (2.26 ± 3.38 bpm) (Hernandez et al 2014). However, a gyroscope consumes more energy than an accelerometer (Trimpop et al 2017). The combination of an accelerometer and a gyroscope could enhance the accuracy of RR estimation (Shen et al 2017). By fusing gyroscopic results by Kalman filtering, the error rate in RR estimation declined from 11.7% of accelerometeric results to 7.3% (Yoon et al 2014). With a new physiological signal acquisition patch in which the acclerometer and gyroscope were integrated, RR was derived from data fusion with the mean absolute error of 0.11 ± 0.7 bpm (mean ± SD) and maximum error within 1.6 bpm, in comparison with manually counted RR value (Wang et al 2018).
2.3.2. Piezoresistive and piezoelectric pressure sensors
The fluctuations in pressure due to the respiratory effects could change the resistance in piezoresistive sensors and develop electrical potential (charge) in piezoelectric sensors. The piezoresistive and piezoelectric sensors are potential for wearable and continuous RR monitoring since they could be fabricated into chest straps or clothes (Mahbub et al 2017b), and have been applied as the reference for RR monitoring in related studies (Bahmed et al 2016, Sifuentes et al 2016). Wearable piezoresistive fabric sensors could monitor RR under various moving environments from rapid running to slow walking (Jeong et al 2009). Furthermore, as shown in figure 5, the piezoresistive sensor could be applied in the cardiorespiratory sensor system embodied by an automobile safety belt, which enables the real-time monitoring of RR for drivers (Hamdani and Fernando 2015). Clinically, RR monitored by the piezoelectric device achieved relative accordance with both ECG-derived RR (mean ± SD of the difference: −0.41 ± 1.79 bpm) and RR manually observed by nursing staff (−0.58 ± 2.5 bpm) in 48 post-surgical patients (Lee 2016). As shown in the right column of figure 5, an integrated sensor system of a piezoelectric belt and ECG was used to monitor the respiratory cycle variability for detecting apnea/hypopnea periods (Adnane et al 2009).
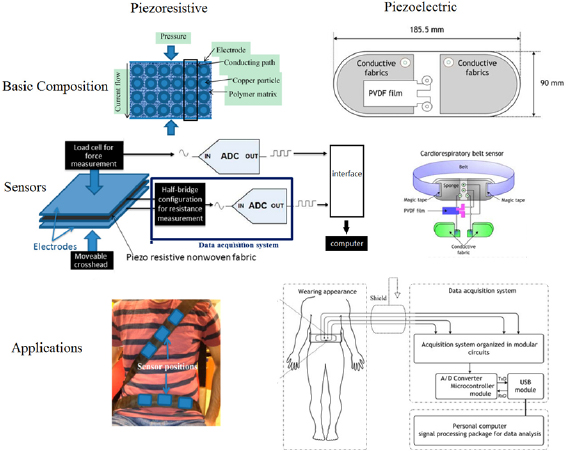
Figure 5. Structure and application of piezoresistive (left, adapted from Hamdani and Fernando (2015)) and piezoelectric (right, adapted from Adnane et al (2009)) fabric sensors. Licensee MDPI, Basel, Switzerland. CC BY 4.0.
Download figure:
Standard image High-resolution imageRecent developments in piezoresistive and piezoelectric sensors enables the mobile and continuous RR monitoring in different situations. With the piezoelectric sensor encapsulated within the sensor patch, the motion artefact, which affects the accuracy of RR monitoring in many chest straps (Atalay et al 2015), could be eliminated, enabling the respiratory monitoring in a dynamic walking condition with high fidelity (Lei et al 2015). By adding grapheme to the PVDF piezoelectric membrane, the sensibility of the chest strap at body temperature (37 °C) could be improved (Hernández-Rivera and Suaste-Gómez 2017). Based on distributed capacitance similar to the piezoelectric sensors, a new elastic displacement transducer could fulfill the wearable respiratory plethysmography besides RR monitoring (Mokhlespour Esfahani et al 2013). With a sheet of e-Textile fabric coated with piezoelectric polymer, the underbody pressure distribution was delineated on the high-resolution pressure images. With a robust body parts localization algorithm, respiratory signals extracted from the localized torso area were insensitive to arbitrary extremities movements (Liu et al 2015b). A respiratory signal could be derived from the chest movement by the piezoelectric transducer based on PVDF film. After digitalization, the signal was then transmitted by the impulse radio ultra-wideband (IR-UWB) transmitter, fulfilling the mobile RR monitoring at a low energy (Mahbub et al 2016). For RR estimation, BCG signal could be measured from the quasi-piezoelectric sensor made of an electroactive polymer material (EMFIT), in which the combination with GPS, Bluetooth and a rechargeable battery made the constant RR monitoring more convenient (Hermann et al 2018).
2.3.3. Radio frequency (RF) methods: radar and WiFi
Some RR monitoring systems are based on radio frequency (RF) techniques, which leverage RF signals to capture breathing and heart movements. RF techniques could fulfill the continuous indoor RR monitoring without sensors attached on the human body. The existing techniques can be classified into radar-based and WiFi-based approaches (Huang 2018).
Radar-based RR monitoring has been proposed since the 1970s (Sun and Matsui 2015). Some commonly used radars in RR monitoring include continuous wave (CW) Doppler radar (Chung et al 2016), ultra-wideband (UWB) radar (Kocur et al 2017), frequency modulated continuous wave (FMCW) radar (Adib et al 2015, Van Loon et al 2016), and stepped-frequency continuous wave (SFCW) radar (Dang et al 2015). Compared with other non-contact RR monitoring methods, such as thermal imaging and video camera imaging, RF methods could provide larger detection areas, with the distance of detection longer than 3 m (Al-Naji et al 2017). Physiologically, respiration provides an important radar-based body-detection method since it was the only observable body movement in sleep and coma (Kocur et al 2017). Respiration also influences the radar detection of organs and tumor (Li et al 2017).
The application background of radar-derived RR has been extended in recent studies. The simultaneous monitoring of multiple subjects could be fulfilled by UWB and SFCW radars (Dang et al 2015, Kocur et al 2017). By transforming the smartphone into an active sonar device using 18–20 kHz sound waves, the Doppler radar could simultaneously monitor RR on multiple subjects. The apnea detection was then performed on 57 normal subjects and 87 patients, with 0.0023% and 0.0336% positive and negative false rates in detecting sleep apnea events compared with PSG results (Nandakumar et al 2015). In a pilot study including eight patients in the postoperative anesthesia care unit (PACU), the FMCW radar derived RR during mechanical and spontaneous ventilations with the errors of −0.12 ± 0.83 bpm and −0.59 ± 2.67 bpm (mean ± SD, in comparison with the value measured by pneumotachograph during mechanical ventilation and capnometry during spontaneous breathing) (Van Loon et al 2016). The radar-based RR monitoring could be integrated with thermal and HR sensors for the portable and real-time screening of infectious patients in public places such as airports (Sun et al 2018). A 2.4 GHz DC coupled multi-radar system, which eliminated signal distortions, was applied in detecting different respiration patterns (natural breathing, chest breathing and diaphragmatic breathing), providing a non-contact method for monitoring the physiological and emotional changes (Gu and Li 2015).
The accuracy of radar-based RR monitoring depends on the body position, with a strong influence of body movements (Shamsir et al 2018). Within the distance of 8m and in different directions, the wireless RR sensing by the FMCW radar could achieve the accuracy over 97%, compared with the reference RR value measured by a chest strap. But the measurement is limited to the quasi-static users (e.g. typing, watching TV). This is because signal variations due to full body motion would otherwise overwhelm the small variations due to vital signs (Adib et al 2015). The radar-based RR detection is based on sensing the tiny chest wall movements (approximately 1.0–5.0 mm) which are much smaller than the random body movements. With the autocorrelation model, which is good at extracting the periodicity signals submerged in noise, the error in RR estimation by a Doppler radar could be limited to 0.7 ± 1.4 bpm (mean ± SD, in comparison with the value measured by contact-type respiratory effort belt) in 15 s measurement (Sun and Matsui 2015).
Compared with a radar system, WiFi-based RR sensors are lower in cost and easier to approach (Madsen et al 2016). Off-the-shelf WiFi devices could be used to continuously collect the fine-grained wireless received signal strength (RSS) or channel state information (CSI) around a person (figure 6(b)). From the CSI, the rhythmic patterns associated with respiration and could be separated from abrupt changes due to the body movement (Liu et al 2016). RR monitoring based on RSS could estimate different RRs with the error less than 1 bpm in paced breathing (Abdelnasser et al 2015). CSI could provide better RR estimation compared with the RSS which would be affected by abnormal breathing. In WiFi-based RR monitoring, the user location and body orientation influence the quality of CSI signals and hence affect the accuracy of RR estimation (Wang et al 2016). The WiFi-derived RR showed 88.8% measurement accuracy compared with ventilator capnography (Madsen et al 2016). In a WiFi-based respiratory monitoring lasting 200 min at a distance of 2.5 m, the error in respiratory phase difference was 0.337 s and the average accuracy in RR is 89.9%, compared with the banded respiratory monitoring device, with the accuracy of 93.2% in detecting sleep apnea (Bao et al 2017). Similar with radar-based methods, WiFi-based RR monitoring could simultaneously measure multiple subjects (Abdelnasser et al 2015), and is a promising method for sleep monitoring (Liu et al 2015a), especially for patients and the elderly (Bao et al 2017).

Figure 6. (a) 2.4 GHz DC coupled multi-radar system (upper) and the derived respiratory signals from chest and abdomen (lower), adapted from Gu and Li (2015). (b) WiFi-based RR monitoring system and the transmission of signal via line-of-sight (LOS) and non-line-of-sight (NLOS) paths (middle). Lower: The respiratory signals derived by channel frequency response (CFR) and accelerometers during sleep. © 2016 IEEE, adapted with permission, from Liu et al (2016).
Download figure:
Standard image High-resolution image2.3.4. Electromagnetic sensors: EIP, RIP, EIT and others
In clinical research, conventional non-invasive monitoring of respiration rate is performed by electrical impedance pneumography (EIP) or impedance pneumography (IP). Respiratory inductive plethysmography (RIP) and electrical impedance tomography (EIT) are two monitoring techniques that have been used to assess lung volume noninvasively. RR could also be derived by other electromagnetic sensors that measure the respiratory motion of the chest.
EIP (or IP) measures the impedance change caused by the respiration cycle between two electrodes placed on the chest, with the injection of a low-amplitude high-frequency current into the thorax. EIP is widely used in log-term monitoring of respiration during sleep in adults and young children (Seppä et al 2016), and has been applied as the reference of RR in studies on ECG- and PPG-based RR measurement (Orphanidou 2017). However, EIP is susceptible to motion and posture changes of the subject and therefore prone to erroneous estimation (Jarchi et al 2018). Eight algorithms for deriving RR from EIP signals were compared on 15 subjects (10 males + 5 females) in three conditions: standing, walking in 3 km h−1, and walking in 6 km h−1. The algorithms were three autoregressive (AR) modeling approaches, fast Fourier transform (FFT), autocorrelation, peak detection and two counting algorithms. It was found that the advanced counting method was the most promising approach for EIP-based RR estimation, with the concordance correlation coefficients of 0.96, 0.90 and 0.97 for standing, walking in 3 km h−1, and walking in 6 km h−1, compared with the reference flow thermography (FTG) results (Jeyhani et al 2017). Besides algorithmic improvements, the data fusion with accelerometers and gyroscopes could also improve the accuracy of EIP-based RR estimation, with the error of 0.7 ± 1.0 bpm and 3.0 ± 2.6 bpm (mean ± SD, compared with the capnography RR results) under static and running states (Shen et al 2017).
Recently, there are ECG front-end modules embedding an impedance channel for respiration measurement (Jekova et al 2014, Abtahi et al 2015). Such modules could simultaneous record ECG and respiration signal without the need for extracrion of the respiration signal from the ECG signal. The calculation of RR in these modules are based on thoracic impedance instead of respiratory modulations.
RIP employs two copper wires: the transductor is placed around the rib cage around the abdomen with the other on the chest (figure 7(b)). During the respiration cycle, volumetric differences occur and this causes self-induction of the two wires. On the screen of the oscillator, the change in frequency is shown as a digital respiration waveform. Clinically, with post hoc analysis based on age-matched reference values, RIP could estimate many indices besides RR such as phase angle, laboured breathing index, and percent of rib cage contribution to breathing (Balasubramaniam et al 2018). RIP could estimate tidal volume within ±10% error compared with the reference flowmeter in 93.9% of the total of 11 437 breaths, with the device power less than 23.1 mW (Zhang et al 2012). Due to its ability to measure the volumetric changes, RIP could be used to detect obstructive sleep apnea by analyzing RR and the phase changes during respiration (Kogan et al 2016). For respiratory monitoring in pediatric patients treated with patient-controlled analgesia, RIP is more appropriate than capnography due to its long-term tolerability (Miller et al 2015).

Figure 7. (a) Impedance pneumography applied to quantify nocturnal lung function variability for estimating the risk of asthma in young children. Reproduced from Seppä et al (2016) with permission of the © ERS 2019 (European Respiratory Journal 47 1687–96. (b) Respiratory inductive plethysmography could detect obstructive sleep apnea by differentiating normal breathing, phase shifting, and paradoxical breathing. © 2016 Daedalus Enterprises INC, adapted with permission, from Kogan et al (2016). (c) An electrical impedance tomography system. © 2018 IEEE, adapted with permission, from Wu et al (2018). (d) Physical principles and equivalent circuit models of inductive and capacitive sensing methods in RR estimation. © 2013 IEEE, adapted with permission, from Teichmann et al (2013).
Download figure:
Standard image High-resolution imageEIT is a radiation-free functional imaging modality invented over 30 years ago. During an EIT examination, very small alternating electrical currents are applied through pairs of electrodes while the resulting voltages are measured on the remaining electrodes. A general EIT measurement process includes: (1) execution of EIT measurements, (2) generation of raw EIT images, (3) EIT waveforms and regions-of-interest (ROI), (4) functional EIT images, and (5) EIT measures (figure 7(c)) (Frerichs et al 2016). As RIP, EIT could also provide tidal volume besides RR (Wolf and Arnold 2005). A wearable EIT system could fulfill the simultaneous measurement of HR, RR, incubator temperature and humidity for monitoring preterm infants, with the belt orientation and patient torso detection aiding EIT model selection for enhanced image reconstruction (Wu et al 2018).
Besides EIP, RIP and EIT, other electromagnetic sensors are emerging for RR monitoring, based on magnetic flux density (Oh et al 2018), magnetic induction (Teichmann et al 2015), magnetic eddy current induction and displacement current induction (Teichmann et al 2013). By measuring thoracic impedance during respiration, RR was measured in 30 patients of drug or alcoholic poisoning with the error of 0.3 ± 5.5 bpm (mean ± SD, compared with gold standard capnometry results) (Guechi et al 2015). Noticeably, a capacitive electrical field sensor array placed under a bed mattress derived the unobtrusive and contactless RR measurement with the accuracy of 0.0 ± 0.41 bpm (mean ± SD, compared with flowmeter results) (Wartzek et al 2011). Although mostly at the experimental stage, these innovative devices are promising in consideration of their accuracy.
2.3.5. Optical sensors
The very small dimensions of optical fibers allow them to be encapsulated inside very thin catheters and injection needles, thereby enabling localized monitoring of thoracic movement to derive RR (Fajkus et al 2017). Macrobend (Koyama et al 2018, Purnamaningsih et al 2018, Witt et al 2012) and microbend (Chen et al 2013, 2014, Yang et al 2015b) optic fibers are adopted to transform the movements to the fluctuations in the intensity of optic signals. The fiber Bragg grating (FBG) is widely used in RR monitoring. Besides RR, FBG could provide multiple physiologic parameters such as tidal volume (Massaroni et al 2018), heart rate (Fajkus et al 2017), and heart sound (Ogawa et al 2018).
FBG RR sensors showed considerable accuracy. Consisting of 12 FBG sensors on thoracic and abdomen areas and corresponding areas on the back, a wearable FBG array achieved RR values comparable with those measured by a six-camera motion capture system (mean ± SD of error: −0.02 ± 1.04 bpm)(figure 8). The inspiratory and expiratory phases, breathing duration and tidal volume also indicated accordance with the reference values (Massaroni et al 2018).
Referring to the six-camera motion capture system, the application of a male-fit wearable FBG array on women derived correct RR values (mean ± SD of error: 0.014 ± 1.218 bpm), with significant errors in tidal volume (Presti et al 2018).

Figure 8. (a) The FBG sensor array. (b) The global respiratory signal (the length of wavelength) derived from the 12 FBG sensors. (c) The accordance of respiratory signals derived by FBG and a motion capture system. Massaroni et al 2018 John Wiley & Sons. © 2018 Wiley-VCH Verlag GmbH & Co. KGaA, Weinheim.
Download figure:
Standard image High-resolution imageOptical fiber sensors have many advantages such as electromagnetic immunity, chemically inert nature, intrinsically safe modes of operation and light weight (Yang et al 2015b). Especially, optic sensors could be applied in MRI examinations for which metallic sensors are inapplicable (Chen et al 2014). In biomedical applications, plastic optical fibers (POFs) could avoid fiber break, which is a limitation of glass optical fiber, therefore are more biocompatible (Chen et al 2013). The macrobend optic fibers could measure RR under different physiological conditions including standing, walking, running, and sleeping (Purnamaningsih et al 2018). Additionally, fiber-optic sensors such as FBG could be fabricated into chest straps (Fajkus et al 2016) and T-shirts (Massaroni et al 2018, Presti et al 2018). The results could be transmitted to computers by Bluetooth for signal analysis (Yang et al 2015b). Therefore, optical fiber sensors are promising for wearable and portable RR monitoring. However, the optical sensors are still at the experimental stage with further applications limited by the high cost (Witt et al 2012). More low-cost optical fibers and validations are needed in further studies.
2.3.6. Imaging and iPPG
RR could be derived without body contact by detecting and analyzing the body movement with camera-based monitoring systems. Combining the imaging and PPG techniques, the imaging PPG (iPPG), also known as video PPG (vPPG) or PPG imaging (PPGI) is another promising method that extracts RR from the periodic fluctuations of blood volume.
In figure 9(a), an image covering the subject's head area was firstly captured with depth data and then the upper body area was automatically selected. After Gaussian filtering to smooth the original signal, the respiratory motion in the salient area to the head enclosed by a green bounding box was modeled by the vertical variation of optical flow derived by a Jacobi solver. This method was primarily validated on 41 video clips recorded from nine subjects in a sitting position, with the error of −0.32 ± 0.82 bpm in comparison with the RR values derived by the chest strap (Lin et al 2016). Based on a low-cost 'off-the-shelf' game console 3D time-of-flight camera, RR was detected accurately, with the errors in vital capacity within ±1% in comparison with spirometry (Sharp et al 2017).

Figure 9. (a) RR derivation based on detecting the perturbation in certain areas by imaging. © 2016 IEEE, adapted with permission, from Lin et al (2016). (b) RR derivation by observing the periodic color changes in the forehead window by iPPG. © 2018 IEEE, adapted with permission, from Sanyal and Nundy (2018).
Download figure:
Standard image High-resolution imageImaging-based RR estimation could be performed on adults and young children (Rehouma et al 2017) in different positions (Reyes et al 2017, Braun et al 2018) with different cameras. A major superiority of the imaging-based method is that RR could be estimated in a wide range, especially in the high frequency range, from both the chest and abdomen (Nam et al 2016a). The respiratory motion could be extracted from other locations such as the skeletal joints (Marques et al 2018). Using a colour or near-infrared (NIR) camera under illuminated and dark conditions respectively, RR was measured on 16 healthy adults. The overall error was 0.2 ± 1.17 bpm (mean ± SD, compared with the thoracic strain gauge belt) with limited difference between color and NIR cameras (color: 0.25 ± 0.97 bpm, NIR: 0.24 ± 1.03 bpm). This approach had low computational complexity, therefore facilitating a real-time implementation (Braun et al 2018). Using the camera on an Android smartphone, RR was measured with the errors of −0.024 ± 0.421 bpm (mean ± SD, compared with a spirometer reference), indicating the feasibility of developing an inexpensive and portable breathing monitor based on smartphones (Reyes et al 2017).
The state-of-art smartphones are able to measure PPG signals by contact and non-contact methods from the finger and forehead respectively (Papon et al 2015). In iPPG methods, RGB videos of the forehead were analyzed to derive the periodic signals of blood flow, from which RR could be derived as in PPG-based methods using similar algorithms such as FM (Mirmohamadsadeghi et al 2016). The iPPG signal is often derived from variations in the intensity of the green channel, while other imaging properties such as the variations in color of reflected light were also applied in RR estimation (Sanyal and Nundy 2018). In different distances and positions, the SFCW radar and iPPG indicated a comparable ability in detecting the RR of human subjects (Ren et al 2017). The iPPG signal is substantially noisier than the equivalent PPG signal from pulse oximeters (Pimentel et al 2017). Compared with PPG-based RR monitoring, the contact-free nature of iPPG allows the monitoring of sensitive skin areas like premature infant's skin, ulcers, or burn wounds (Bruser et al 2015).
2.4. Methods based on airflow changes
The respiratory airflow causes various effects around the nasal area: the periodic fluctuations in temperature, humidity, the density of carbon dioxide, and the sounds. RR could be derived by the sensors based on these effects.
2.4.1. Thermal imaging, thermistors, and pyroelectric transducers
Generally, RR extraction from thermal imaging depends on the fluctuation of signal intensity (figure 10(a), left). With the highly portable FLIR ONE thermal camera device, which provides thermal and visual images by turns, the region-of-interest (ROI) was firstly located within the face and nose region. The histogram equalization and Kanade–Lucas–Tomasi (KLT) methods were then employed to enhance the image and tack the subject to prevent the ROI location error. With Hilbert–Huang transform, the accuracy of RR extraction was improved (−0.71 ± 1.98 bpm, Mean ± SD of error, referred to the LabQuset2 gas pressure sensor results) compared with FFT (−2.25 ± 3.05 bpm) (Chen and Lai 2017). With the breathing sorption indicator (BSI) mask on which the nasal airflow blows, due to the high (approximately 2.3 kJ g−1) specific heat of water evaporation, the thermal changes could be amplified on the mask (10 °C, over 100 times compared with that derived directly from nasal airflow), providing the possibility of remote thermal imaging for RR estimation (Vainer 2018).
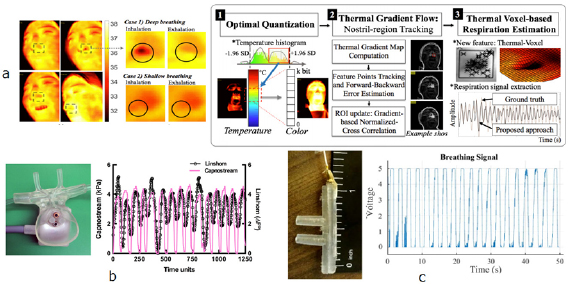
Figure 10. (a) Left: The thermal difference between inhalation and exhalation in the nasal area in deep and shallow breathing. Right: The extraction of RR using thermal gradient flow. © 2017 Optical Society of America, adapted with permission, from Cho et al (2017b). (b) The thermistor-based sensor mounted to adult nasal prongs (left) and the derived respiratory signal compared with that derived by capnometry (right). © 2016 Canadian Anesthesiologists' Society, adapted with permission, from Lerman et al (2016). (c) The pyroelectric transducer attached to the cannula (left) and the respiratory signal received in the remote computer. A comparator was used to eliminate the signal amplitude. © 2018 IEEE, adapted with permission, from Shamsir et al (2018).
Download figure:
Standard image High-resolution imageClinically, the RR extracted from the infrared thermograph conformed to the results derived from body surface ECG (1.75 ± 2.29 bpm, mean ± SD of error) (Hochhausen et al 2018). Compared with the ECG-based method, the thermal imaging is less influenced by the motion artifact, but it highly depends on the thermal scene of the subject. Large head movements could also deteriorate the accuracy of RR estimation based on thermal imaging (Alkali et al 2017). Based on the thermal imaging derived by the mobile thermal camera (FLIR One for Android), which detects electromagnetic waves in the spectral range of 8–14 µm, a thermal gradient map-based visual tracking technique was proposed to enhance the RR extraction in scenes with high thermal dynamic ranges and body movements. On the dataset derived from eight healthy subjects with unconstrained respiration in fully mobile context and varying thermal dynamic range scenes, the gradient-based RR showed better accuracy (−0.14 ± 2.45 bpm, mean ± SD of error, referred to chest-belt respiration sensor) than the traditional method (−0.19 ± 2.59 bpm)(figure 10(a)) (Cho et al 2017b).
The accuracy of RR estimation depends on the quality of thermal imaging (Hu et al 2018). The major limitations of thermal imaging methods include long processing time (Daw et al 2016) and high cost (Bruser et al 2015). However, it is a non-contact method, and could be applied for sleep monitoring where other imaging methods with illumination are unavailable (Daw et al 2016).
During inhale and exhale activity, the changes of airflow temperature near the nose and mouth could be detected from fluctuations in the resistance of a thermistor, providing the estimation of RR. Compared with other RR measurement systems, the thermistor is a low-cost one with high precision for the detection of apnea (Das et al 2017), and is therefore widely adopted as the clinical standard for apnea detection (Gray and Barnes 2017). In the traditional circuit, the analog-to-digital convert could cause self-heating, which might deteriorate the RR estimation. With the time-modulated respiratory signal directly digitized with the microcontroller, it was not necessary to supply any voltage or current to the thermistor, the self-heating was therefore avoided. In 27 subjects, the results were in good accordance with the results derived by a piezoelectric sensor on the chest belt (mean ± SD of error: 0.017 ± 0.155 bpm) (Sifuentes et al 2016). To eliminate the effects of environmental thermal fluctuations, in a temperature-based noninvasive instrument of RR monitoring, two rapid responding medical-grade thermistors were respectively in close proximity to the mouth/nose and remote to the airway as a reference. The measured RR conformed well to the capnometry results (mean ± SD of error: −0.17 ± 1.01 bpm) in the pilot study on three subjects, but needs further validation (Lerman et al 2016). Due to its low cost, the thermistor is applicable for the portable monitoring of RR especially in low-resource settings (Turnbull et al 2018).
Besides the thermistors, pyroelectric transducers, which transduce temperature variations into an electrical signal, have also been applied in RR monitoring. The acquired signal could be processed through an electronic circuit fabricated using a standard CMOS process, thus obtaining an electronic device with low power consumption (Pullano et al 2017). Based on pyroelectric transducers, RR monitoring systems could be low-power (Mahbub et al 2015) or self-powered (Mahbub et al 2017a). Polyvinylidene-fluoride (PVDF), which has both piezoelectric and pyroelectric properties, is widely adopted in pyroelectric RR monitoring systems (Pullano et al 2016). Besides the nasal apparatus, the pyroelectric nanogenerator could fulfill wearable and portable RR monitoring (Xue et al 2017). As a promising method, currently the pyroelectric sensors for RR monitoring are generally on the experimental stage, in need of the large-scale validation on subjects.
2.4.2. Acoustic sensors
Respiratory airflow could be acoustically measured from tracheal and nasal areas or ear canal by contact and noncontact methods (Al-Khalidi et al 2011). Acoustic sensors could be capsulated in different apparatus and applied for RR monitoring in different situations. Acoustic methods could achieve high accuracy in RR estimation. During intravenous sedation in dental procedures, there was no significant difference (p > 0.05) between the RR values derived by electrical stethoscopes and capnography (Morimoto et al 2018). For a total of 137 199 paired RR values measured by acoustic and capnography methods, the bias, standard deviation, and limits of agreement of respiration rate from acoustic monitoring versus capnography were 0.2 ± 2.3 bpm and −4.2 to 4.7 bpm, indicating good overall agreement of the two methods (Tanaka et al 2014). Based on a phonocardiogram (PCG) and a capacitor microphone near the mouth, a wireless acoustic sensor derived RR estimation comparable to the results of the chest strap (mean ± SD of error: 0.1 ± 0.63 bpm) (Abbasi-Kesbi et al 2018). For the RR monitoring after extubation in ICU patients, referred to as capnometry, the acoustic sensor (mean ± SD of error: 0.3 ± 2.12 bpm) achieved comparable accuracy with thoracic impedance (0 ± 3.24 bpm) (Autet et al 2014). In obese patients recovering from general anaesthesia, the accuracy of RR estimation by acoustic method (mean ± SD of error: −0.3 ± 1.81 bpm, referred to capnometry) was also comparable to and even better than the results derived by the impedance method (−0.6 ± 2.70 bpm) (Frasca et al 2015). In some studies, the RR value measured by the acoustic method was used as the reference value (Haescher et al 2015, Turnbull et al 2018).
A clinical study indicated that adding continuous acoustic RR monitoring to a pulse oximetry-based surveillance system may not significantly improve patient deterioration detection (McGrath et al 2017). In clinical applications such as dental scaling, the accuracy of acoustic RR estimation is significantly influenced by the noise (p < 0.001) (Kim et al 2018), especially when RR value is low (Yabuki et al 2018). Despite these limitations, acoustic methods could measure RR values as high as 90 bpm (Nam et al 2016b), which is difficult for many other methods, and is available in various apparatus from the hearing protection devices (figure 11(a)) to smartphones (figure 11(b)) (Reyes et al 2016, Martin and Voix 2017). Therefore, the acoustic method is promising in fulfilling accurate and portable RR monitoring.

Figure 11. (a) Non-invasive RR monitoring apparatus positioned into a workers' hearing protection device (HPDs) in the ear canal (left), with derived respiratory signal and the frequency distribution of different breathing patterns shown (right). © 2017 IEEE, adapted with permission, from Martin and Voix (2017). (b) The tracheal and nasal respiratory signals derived from acoustic measurement by an Apple iPhone 4S using the built-in microphone of a smartphone or headset. © 2016 IEEE, adapted with permission, from Nam et al (2016b).
Download figure:
Standard image High-resolution image2.4.3. Humidity sensors and capnometry
The material composition of airflow differs between inhalation and exhalation. The exhaled air is more humid with a higher ratio of carbon dioxide. Various humidity sensors and capnometry apparatus therefore have been developed to measure RR.
Various humidity sensors have been developed based on humidity-sensitive materials such as graphene oxide (Caccami et al 2017), silica nanoparticles (SiO2 NPs) (Kano et al 2018), quartz crystal microbalance (QCM) (Selyanchyn et al 2015), coronene tetracarboxylate (CS)-dodecyl methyl viologen derivative (DMV) nanofibres (Mogera et al 2014), and synthetic redox conducting supramolecular ionic material (SIM) (Yan et al 2016). Other methods in humidity-based RR monitoring include digitally printing graphite ink (Güder et al 2016), a CMOS-MEMS device (Lai et al 2014), and Trichel pulses (TPs) measured by a field ionization sensor consisting of a needle electrode and a plate electrode (Deng et al 2014).
The humidity-based sensors are promising. Firstly, they could fulfill real-time RR monitoring, especially for rapid respiration (RR > 60 bpm) (Mogera et al 2014, Kano et al 2018). The response time to respiratory humidity changes could be less than 40 ms (Lai et al 2014, Mogera et al 2014, Yan et al 2016). Secondly, the humidity sensors could be fabricated into films and attached to masks (Güder et al 2016, Caccami et al 2017), with the results shown on smartphones, enabling the wearable and portable RR sensing (figure 12(a)). The humidity changes decrease with the distance from the airflow outlets. Therefore, distance is a major limitation of current humidity-based RR sensors, which contact the skin or are at a near distance, such as 10 cm, from the nostril or mouth (Kano et al 2018). Additionally, most of the humidity-based RR sensors were at the experimental stage. The validations were performed on limited human subjects (Mogera et al 2014) or rats (Yan et al 2016). Further large-scale validations on human subjects and the comparison with other existing sensors are needed.

Figure 12. (a) The humidity sensor on the mask and its structure (left), the derived respiratory signal on the Android smartphone (middle), when 1. breathing normally, 2. taking a deep breath, 3. paused and, and 4. random breathing (right). © 2016 John Wiley & Sons, adapted with permission, from Güder et al (2016). (b) The capnometry devices, which measure the main-steam and side-stream of the respiratory airflow based on the optical measurement of CO2 absorption bands in the mid-infrared (MIR), and the derived respiratory signals. © 2018 IEEE, adapted with permission, from Degner et al (2018).
Download figure:
Standard image High-resolution image
Capnometry has been established as one of the clinical standards for respiratory monitoring. As mentioned, the RR results derived by capnometry were applied as the gold standard in many studies (Autet et al 2014, Frasca et al 2015, Bergese et al 2017). Compared with PPG and acoustic results, the capnogram demonstrated better ability to distinguish between different respiratory rates when the RR value is low (Ermer et al 2017). Despite its accuracy, a major limitation of traditional capnometry is its inconvenience for which many patients in the general care floor removed the nasal cannula due to physical annoyance (Addison et al 2015). Capnometry via a nasal cannula is difficult to perform on extubated patients after surgery with high nasal airway resistance (Zhang et al 2017). Recently, a pyroelectric (Yang et al 2015a) and infrared absorption sensor, which measure both main and side streams of respiratory airflow (Degner et al 2018), have been applied in capnometry (figure 12(b)). Clinically, the capnometry-derived RR indicated limited ability to provide warning signs for a hypoxaemic event during the sedation procedure (Touw et al 2017). In some cases, new acoustic sensors showed better accuracy than capnometry in monitoring RR during anesthesia care (Tanaka et al 2014, Morimoto et al 2018). Therefore, more convenient capnometry devices, and higher accuracy in capnometry-derived RR during anesthesia, are still needed in further investigations.
3. Discussion and conclusion
In life-threatening conditions, RR can significantly change in just a few minutes. To provide immediate rescue, continuous monitoring of respiratory activity should therefore be mandatory in high-risk clinical situations such as acute myocardial infarction, short MI, and perennial unexplainable breathing stop, where simple and inexpensive RR monitoring is in need. The monitoring of RR is significant not only in hospital routines, but also in everyday tasks of common people to get an overview of their health. Convenient and accurate RR monitoring is therefore an important issue.
The major methods in RR monitoring have been reviewed according to their technical basis. In this part, their advantages and limitations will be discussed to disclose some future direction, as summarized in table 2.
Table 2. The summarization of the new methods for RR measurement.
| Methods | Wearable | Non-contact | No additional devices | Low cost | Multiple subjects | |
|---|---|---|---|---|---|---|
| Respiratory modulation | ECG | √ | √ | |||
| PPG | √ | √ | ||||
| BCG and SCG | √ | √ | ||||
| OscP and KorS | √ | |||||
| Accelerometer and gyroscope | √ | |||||
| Piezoresistive and piezoelectric sensors | √ | |||||
| Radar | √ | √ | ||||
| WiFi | √ | √ | √ | |||
| Electromagnetic sensors | √ | |||||
| Optical sensors | √ | |||||
| Imaging and iPPG | √ | √ | ||||
| Thermal imaging | √ | |||||
| Thermistor | √ | √ | ||||
| Pyroelectric transducer | √ | |||||
| Acoustic sensors | √ | |||||
| Humidity sensors | √ | |||||
| Capnometry | √ | |||||
3.1. Summary of current methods
In each kind of method, we could find some highly accurate RR monitoring results. However, the accuracy depends on different conditions. The methods based on other physiological signals could fulfill the simultaneous monitoring of multiple vital signs, and decrease the cost of RR monitoring. However, the accuracy of estimated RR depends on the quality of the original signal and the algorithm. The fusion of FM, AM and BW does not always obviously enhance the accuracy (Birrenkott et al 2018). The methods based on respiratory movements are suitable for wearable (optical, piezoelectric, and electromagnetic sensors) and wireless (radar, WiFi, and imaging methods) monitoring of RR. The body motion, environmental noises, and distance would significantly influence the accuracy. Generally, the methods based on direct measurement of airflow could achieve high accuracy in different motion status. Some of the airflow-based sensors are attached to the skin (FBG sensor, tracheal acoustic sensors) or the nasal areas (thermistors, pyroelectric sensor, capnometry). Some others could fulfill the non-contact RR monitoring (thermal imaging, distant acoustic sensors) but the accuracy depends highly on the environment.
All these methods could derive continuous respiratory waveforms with RR. Breath-to-breath RR variations were only investigated in some clinical studies (Adnane et al 2009, Nurmi et al 2016, Seppä et al 2016). In many methods, such as the methods based on respiratory modulation, the acoustic sensors, only RR value could be directly derived. The respiratory waveform are derived from breath-to-breath results by curve-fitting. For methods based on thermal imaging, capnometry, and humidity sensors, the amplitude of the respiratory curve is non-linearly related to respiratory airflow, with possible delay in phase.
This review focused on the state-of-art techniques in RR monitoring. Therefore, the majority of the reviewed methods were at the experimental stage and in need of further validation. Traditional methods, such as the EIP, capnometry, and piezoelectric respiratory straps have been well validated and applied as clinical references. Many methods included some primary validation in which the estimated RR was compared with that derived from other methods. However, the number of human subjects was limited (less than 30 in most of the studies). For some new sensors such as optical fibers, pyroelectric transducer, and WiFi, more validations are necessary.
The methods differ in their costs. The derivation of RR from other signals needs only the computational sources without any additional costs on hardware. The thermistor (Turnbull et al 2018), off-the-shelf WiFi devices (Liu et al 2016), paper-based humidity sensors (Güder et al 2016), and smartphone-based thermal imaging (Cho et al 2017a) are typical low-cost methods to monitor RR. The EIT, imaging and optical fiber sensors have much higher costs due to the necessity of expensive devices or components.
The methods have different applicable spatial distances. Except thermal imaging and acoustic sensors, airflow-based methods need contact with, or need to be around the mouth and nasal areas. The piezoresistive, piezoelectric and electromagnetic sensors are essentially body contact. The motional imaging and thermal imaging have the effective distance of about 3 m (Al-Naji et al 2017). Acoustic sensors could be body contact or non-contact. Radars and WiFi devices could detect thoracic movements at a larger distance, but under static breathing only.
There are some common limitations in the current methods. Firstly, the accurate monitoring of high and low RR values is difficult. High RR is difficult to extract from PPG signals with various algorithms (Nam et al 2014, Lázaro et al 2015). The nasal breath sound recordings by a smartphone derived the RR monitoring as high as 90 bpm (Nam et al 2016b). But for acoustic methods, the accuracy of low-frequency RR monitoring is influenced by environmental noise (Yabuki et al 2018). Considering the diagnostic significance of abnormal RR values, the accurate monitoring of high and low RR values could improve its clinical application. Secondly, the motion artifact affects the accuracy in nearly all the methods. The accurate estimation of RR during walking is difficult to derive by the FMCW radar, PPG-based method, and even the chest strap (Adib et al 2015). The motion artifact is also the major limitation for BCG-based (Hermann et al 2018), radar-based (Sun and Matsui 2015) and electromagnetic (Teichmann et al 2013) methods, and could decrease the accuracy of RR estimation in thermal imaging (Alkali et al 2017) and PPG-based (Madhav et al 2013) methods. Some methods have been proposed to eliminate the effects of motion artifacts, such as the model of PPG motion artefacts (Vizbara et al 2017), the algorithms to extract respiratory signal from PPG signals with strong motion artefacts (Madhav et al 2013), and the gradient in thermal imaging (Cho et al 2017b). Especially, the dual-accelerator could decrease the artifact by using the differential signal (Lapi et al 2014). Thirdly, the effect of environmental noises (or temperature) on RR results is significant in acoustic (Kim et al 2018, Yabuki et al 2018), thermal (Al-Naji et al 2017), and OscP-based (Chen et al 2016b) methods.
Clinically, the accuracy of respiration monitoring depends on the objective. The simplest devices provide estimation of respiratory rate only; more sophisticated devices will also provide quantitative information about tidal volume and gas exchange parameters. The appropriate choice of technology for respiratory monitoring will therefore take many factors into consideration: the accuracy, the cost and availability, and most importantly, the clinical condition. Towards patient-tailored treatment, the selection of appropriate devices should accord with the clinical needs.
3.2. Future directions in RR measurements
3.2.1. More accurate RR monitoring from multiple subjects
Towards the accurate RR monitoring especially for high and low RR values, besides the improvement of sensors, the data fusion could increase the estimation accuracy, as has been adopted in some studies (Yoon et al 2014, Shen et al 2017).
The simultaneous monitoring of RR on multiple human subjects could be fulfilled by using geophones (Jia et al 2017), WiFi devices (Wang et al 2016), and radar devices (Nandakumar et al 2015, Kocur et al 2017). The current methods of multiple-subject RR monitoring have some limitations. For example, the subjects must be static (Kocur et al 2017), or have different RR values (Wang et al 2016). Future research and investigation are needed towards the simultaneous real-time RR monitoring on multiple subjects based on less clinical resources, with the capability to be applied in the large-scale screening of potentially contagious patients in public places such as airports.
3.2.2. Simultaneous monitoring of physiological signals
The methods based on other signals could derive HR and RR simultaneously with the measured signals. Besides RR, the tidal volume could be derived by smartphone camera imaging (Reyes et al 2017) and PPG (Prinable et al 2017). Furthermore, the respiratory phases and time lengths could be estimated by EIT (Khodadad et al 2017) and FBG sensors (Massaroni et al 2018). The body temperature, skin humidity, and BCG could be integrated into the FBG-based or EIT-based RR monitoring straps (Fajkus et al 2017, Wu et al 2018). Minimized sensors could be fabricated in wearable T-shirts or straps to provide more comprehensive physiological information.
3.2.3. Wearable sensors
Chest straps, or belts, have become popular RR monitors as observed in piezoresistant, piezoelectric, electromagnetic, and optical sensors. The form of chest straps has extended from the traditional respiratory effort belt to those more applicable for daily use such as a short segment (Lei et al 2015) or safety belt (Hamdani and Fernando 2015). Besides straps, recent technical innovations have achieved RR measurement via sensors fabricated to jackets (Mahbub et al 2017b), T-shirts (Massaroni et al 2018), masks (Caccami et al 2017, Cao et al 2017), and pocket devices (Teichmann et al 2015). Good wearable sensors should be light, thin, and soft, with possibly less contact with skin. Some of the current wearable RR sensors are based on metallic or plastic materials, therefore inappropriate for long-term monitoring especially for infants or subjects with sensitive skin (Cao et al 2017). The more minimized and biocompatible wearable sensors are beneficial for long-term RR monitoring.
3.2.4. Portable sensors with wireless communication
The WiFi or radar systems are essentially appropriate for data transmission. Bluetooth (Yang et al 2015b, Hermann et al 2018), radiofrequency identification (Caccami et al 2017), and low power IR-UWB transmitters (Mahbub et al 2016, Pullano et al 2016) are commonly applied in wireless transmission. The smartphone could be used to perform the calculation and data transmission (Crema et al 2017). The portable or mobile sensors enable the RR monitoring for in-time diagnosis and first aid in acute cases. Via Bluetooth on a tablet or smartphone, the RR values can be transferred directly to available doctors who could react immediately. In the monitoring of patients at home, robust estimation of RR would assist with the management and monitoring of chronic diseases and postoperative rehabilitation.
3.3. Summary
The respiratory rate is a very important physiological parameter that is currently not well monitored in a range of healthcare settings. In the drive to attain accurate, continuous, automatic, and convenient RR monitoring, various sensor technologies have been proposed as based on various physical mechanisms.
This first review of the technologies and opportunities shows that there are many potential solutions for respiration rate measurement, based on quantifying respiratory modulation and devices measuring respiratory motions or airflow effects. However, they are mostly still at the stage of experiment or prototype. Motion artifacts and also environmental noise appear the main obstacles to clinical acceptance since they can limit the measurement accuracy. RR is worthy of the current heavy investment in resources to develop reliable sensors for long-distance measurement, remote monitoring, simultaneous measurements of multiple subjects, and capability for wearable and portable measurement, which could largely improve the reliability of the clinical daily monitoring of RR.
Acknowledgment
This work was supported by the Research Foundation of Department of Science and Technology of Guangdong Province (Grant No. 2018A050501001), and the National Natural Science Foundation of China (Grant No. 61828104).