
Abstract
The in vivo evolution of radiotherapy necessitates innovative platforms for preclinical investigation, bridging the gap between bench research and clinical applications. Understanding the nuances of radiation response, specifically tailored to proton and photon therapies, is critical for optimizing treatment outcomes. Within this context, preclinical in vivo experimental setups incorporating image guidance for both photon and proton therapies are pivotal, enabling the translation of findings from small animal models to clinical settings. The SAPPHIRE project represents a milestone in this pursuit, presenting the installation of the small animal radiation therapy integrated beamline (SmART+ IB, Precision X-Ray Inc., Madison, Connecticut, USA) designed for preclinical image-guided proton and photon therapy experiments at University Proton Therapy Dresden. Through Monte Carlo simulations, low-dose on-site cone beam computed tomography imaging and quality assurance alignment protocols, the project ensures the safe and precise application of radiation, crucial for replicating clinical scenarios in small animal models. The creation of Hounsfield lookup tables and comprehensive proton and photon beam characterizations within this system enable accurate dose calculations, allowing for targeted and controlled comparison experiments. By integrating these capabilities, SAPPHIRE bridges preclinical investigations and potential clinical applications, offering a platform for translational radiobiology research and cancer therapy advancements.
Export citation and abstract BibTeX RIS

Original content from this work may be used under the terms of the Creative Commons Attribution 4.0 licence. Any further distribution of this work must maintain attribution to the author(s) and the title of the work, journal citation and DOI.
1. Introduction
Proton therapy is a popular treatment modality in radiation oncology due to its high spatial dose conformity compared to conventional radiotherapy using photons, allowing to spare normal tissue (Mohan et al 2017). Although patient treatment is already established, there is still a need for preclinical in vivo experiments with protons, for example to gain further understanding in proton relative biological effectiveness (RBE) (Suckert et al 2021a), regional tissue radiosensitivity or new treatment modalities such as ultra-high dose rate radiotherapy (FLASH) (Favaudon et al 2014, Diffenderfer et al 2022). In preclinical settings, conducting in vivo small animal experiments is closest to mirror patient treatment. Therefore, it is imperative to emulate the clinical workflow, encompassing imaging, dose calculation, target positioning, and beam delivery (Stony 2023). Such experimental setups within the University Proton Therapy Dresden (UPTD) at the University Hospital Carl Gustav Carus and OncoRay have been already established (Helmbrecht et al 2016, Schneider et al 2022), focusing on studies on the mouse brain (Suckert et al 2020, 2021b) and subcutaneous head and neck tumors (Müller et al 2022). However, high-quality imaging, such as cone beam computed tomography (CBCT), was only feasible outside the experimental area with another small animal image-guided radiation therapy (SAIGRT) system build by Tillner et al (2016), potentially introducing uncertainties in mouse positioning due to the necessary transport (Müller et al 2020). The incorporation of onboard (x-ray) radiography and tomography minimizes experimental uncertainties and reduces movements between imaging and irradiation (Schneider et al 2022), ensuring reproducibility of experimental investigations (Poirier et al 2020) and high precision for fractionated irradiations. While proton imaging offers lower image resolution and most often only 2D spatial information due to required high imaging doses (Meyer et al 2020), x-ray CBCT stands out as the most commonly used, well-established, fast and high-resolution 3D option with the added benefit of a minimal imaging dose (Korreman et al 2010). Given the challenge of establishing a setup capable of conducting both proton and photon irradiation experiments within the same framework, CBCT imaging provides a versatile tool applicable to both treatment options. There is already one promising combined solution for photon and proton irradiation based on CBCT (Kim et al 2019), which utilizes a commercially available small animal irradiation device named SARRP (Xstrahl Inc., Suwanee, Georgia, USA). A commercial option for CT imaging already comes equipped with a well-established and thoroughly tested software for imaging, treatment planning, and irradiation, along with various setup components.
Here, we describe the establishment of SAPPHIRE, a special setup using the commercially available small animal radiation therapy integrated beamline (SmART+ IB) (SmART+ IB, Precision X-Ray Inc., Madison, Connecticut, USA) integrated to the experimental proton beamline at UPTD, allowing for preclinical image-guided proton and photon therapy experiments. Until now, the SmART+ IB has never been used as an image-guided planning and positioning system for precise small animal irradiation in combination with a proton beamline. Monte Carlo simulations are performed to optimize and build all necessary setup components. Besides selecting an optimized low dose CBCT imaging protocol with sufficient image quality, a comprehensive dosimetric characterization of the photon and proton beams was conducted, which is to be implemented in μRayStation software (RaySearch Laboratories, Stockholm, Sweden). For precise application of the proton beam, a quality assurance (QA) procedure using an in-house built phantom was developed. The creation of different Hounsfield lookup tables (HLUTs) set the basis for future dose calculations of proton irradiation.
2. Material and methods
2.1. Beamline setup
The SmART+ IB stands on rollers in the experimental area of the UPTD and can be placed square to a horizontal beamline providing a static proton pencil beam. The correct position of the SmART+ IB is ensured every time with millimeter precision by measuring the distance of the device to the proton beam exit as well as to the wall using a digital laser measure (type GLM 50 C, Robert Bosch Power Tools GmbH, Leinfelden-Echterdingen, Germany). The device (figure 1) is equipped with a specially designed window on the back at the height of the beam pipe, allowing for integration of a proton beam. The fully shielded device features a bifocal 225 kV x-ray tube (internal filtration: 0.8 mm Beryllium) with filter slide and collimator mount, a flat panel detector (0.2 mm resolution, total area 20 × 20 cm2), a 360° rotating gantry with 30.5 cm source-axis distance, and an X–Y–Z animal stage, allowing for CBCT imaging and photon irradiation using nine different fixed nozzle collimators (circular with diameters 1 mm, 3.5 mm, 5 mm, 10 mm, 15 mm, 25 mm and square 10 × 10 mm2, 20 × 20 mm2, 40 × 40 mm2). A supplied 2 mm thick aluminum filter is inserted for CBCT imaging, and a 0.5 mm thick copper filter is used for photon irradiation to prevent beam hardening. For proton irradiation, a 45.82 mm thick polymethylmethacrylat (PMMA) range shifter with a water equivalent thickness (WET) of 53.16 mm for 90 MeV was utilized to be consistent with previous small animal brain studies (Suckert et al 2020, 2021b). The range shifter was attached to an aluminum collimator with a 3 mm diameter aperture placed on two linear stages (LTM80P-75-HSM, LTM80P-150-HSM, OWIS GmbH, Staufen im Breisgau, Germany) on the animal stage for lateral displacement. Monte Carlo (MC) simulations (FLUKA2020 Version 2c.6, (Fasso et al 2005, Battistoni et al 2015)) were performed to determine the optimal position of the collimator and range shifter in the beam path to minimize dose contributions by scattered protons and secondary neutrons and thus protect the shielded device, the flat panel detector and electronics (figure 2). The PRECISIOn default settings were used and the dose and fluence distributions were obtained by applying the USRBIN scorer. Based on the simulations, the collimator and range shifter were positioned as close as possible to the animal box, resulting in proton and neutron fluence as well as absorbed doses at both the flat panel detector and the SmART+ IB wall being several orders of magnitude lower than those of the central beam. The shutter of the flat panel detector efficiently protects it from scattered protons, but is transparent to neutrons. However, the secondary neutrons are emitted in a forward cone, so that the neutron exposure in the direction of the detector is expected to be relatively low. For irradiation with high doses, additional neutron shielding, preferably consisting of hydrogen-rich materials like polyethylene plates, could be placed on top of the steel shutter to minimize long-term damage to the flat panel detector. Two adapters fitting the animal stage were 3D printed from acrylonitrile butadiene styrene (ABS) for stable repositioning of phantoms used for CBCT imaging (figures 3(A1)/(A2)).

Figure 1. Irradiation setup for mouse irradiation using protons and photons. The experimental setup with the SmART+ IB device is shown from different perspectives (side and front views) with all necessary components. The interior of the SmART+ IB can be seen in the upper two images. Below is a schematic sketch of the entire setup (left), with a zoomed-in area (right) highlighted.
Download figure:
Standard image High-resolution image
Figure 2. Results of Monte Carlo simulations using FLUKA for the (A) SAPPHIRE setup in the front view plane for (B) proton fluence, (C) neutron fluence and (D) absorbed dose.
Download figure:
Standard image High-resolution image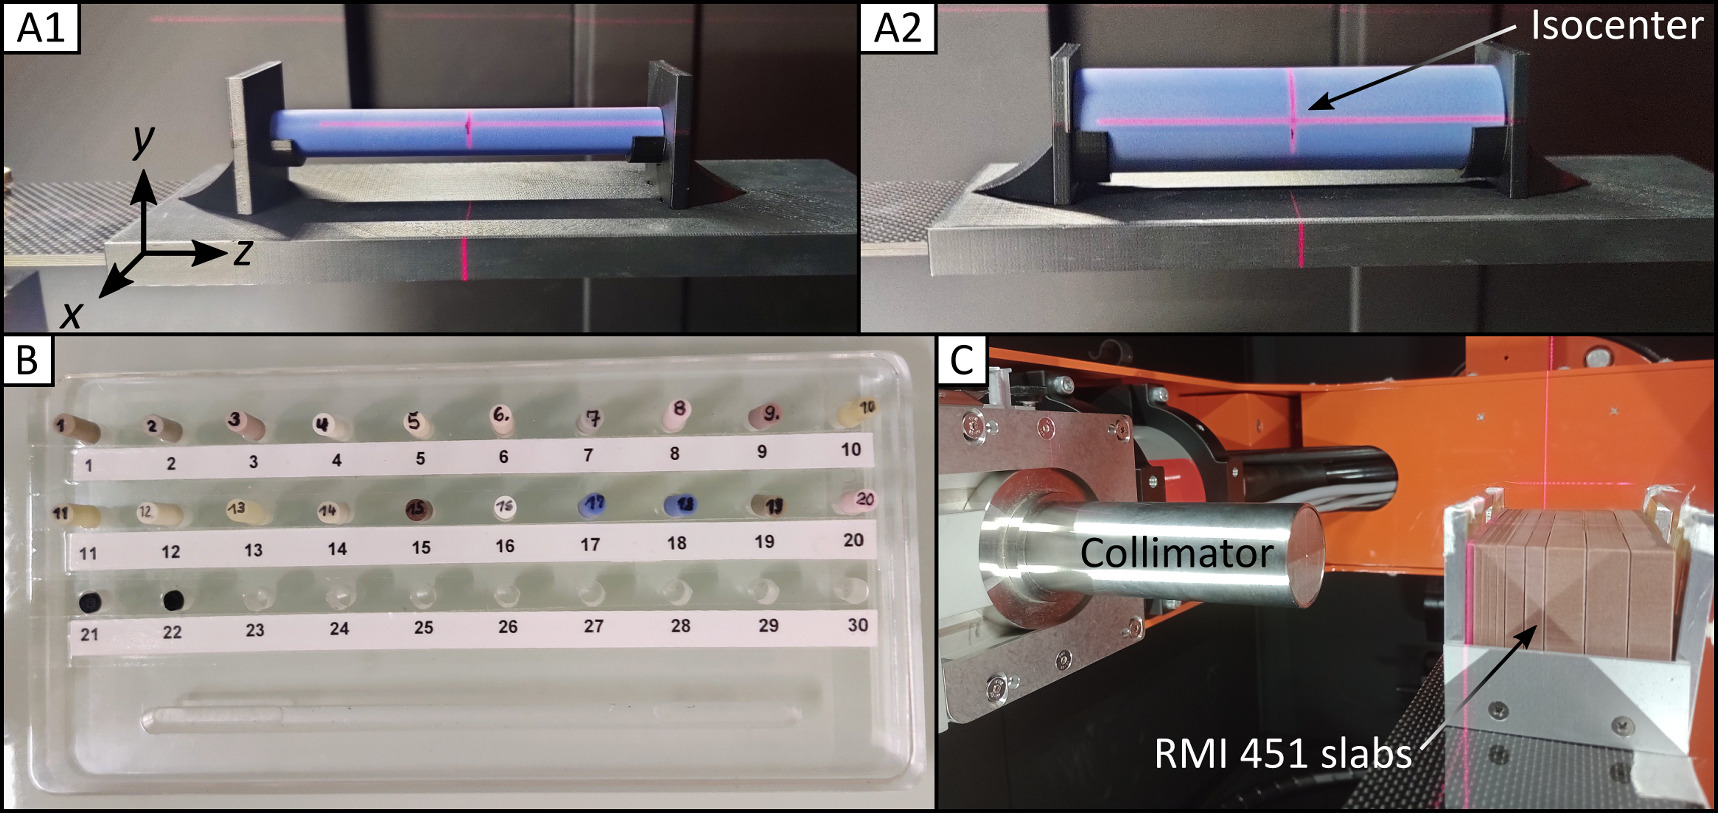
Figure 3. Phantoms for CBCT and photon beam characterization. Cylindrical head (A1) and body (A2) phantoms on the 3D printed adapter at the animal stage placed at SmART+ IB isocenter. (B) Used inserts numbered with 1–22 made from tissue-equivalent materials, which can be placed inside the phantoms. (C) Setup for measuring depth dose and lateral profiles of the photon beam with a  collimator in horizontal position (irradiation position in mice) using EBT3 films between RMI451 water slabs of thickness 2 mm, 5 mm and 10 mm.
Download figure:
Standard image High-resolution image2.2. CBCT imaging
Four predefined CBCT imaging protocols with different x-ray tube voltage and current settings (40 kV with 3 mA, 60 kV with 0.5 mA and 0.9 mA, 80 kV with 0.6 mA) and a slice thickness of 0.1 mm were assessed for their image quality. These parameters are recommended by the manufacturer and were chosen to closely match those of the SAIGRT system to perform comparable animal imaging. A Hounsfield unit (HU) calibration was used to convert the CBCT image's gray values into HU values based on a linear function determined by the gray and HU values of air and water. For this purpose, the average gray values of a syringe filled with water (Ø16.4 mm) and the surrounding air were determined across all slices of the CBCT. This was performed for all CBCT imaging protocols.
For image quality evaluation, two cylindrical phantoms (head: A1, body: A2 in figure 3) made of solid water (Solid Water HE, Gammex-RMI GmbH, Gieen, Germany) with diameters of 15 mm and 30 mm, respectively, and a length of 120 mm incorporating a central 5 mm diameter drilled hole were employed. The tissue-equivalent materials for the phantoms are shown in figure 3(B) (see section 2.6). The CBCT homogeneity within these phantoms, the contrast-to-noise ratio (CNR), and the visibility of notable skull structures of a deceased laboratory mouse were examined. For all image quality evaluations, one CBCT was acquired for each imaging protocol. The homogeneity was investigated in all three spatial directions x, y, and z, inside the phantoms, which were precisely positioned at the SmART+ IB isocenter using a system of room lasers inside SmART+ IB. The CNR was determined based on the CBCT values of the same solid water phantom  and the surrounding air
  and its standard deviation σair as follows:

To assess the stability over time in both cylindrical phantoms, CBCT scans were acquired every half hour over a period of 2.5 h and HU values were averaged over the entire phantom. To quantify the imaging dose per mouse for the imaging protocol with the best image quality according to the selected parameters, the soft x-ray chamber (model 23342, PTW Freiburg, Germany) was positioned on the animal stage at isocenter position. The soft x-ray chamber was irradiated with the settings from the best imaging protocol once with the x-ray tube in the upper position and once in the lower position through the animal stage, and the dose rate and ramp-up effect were measured to derive the imaging dose under rotation of the gantry. To examine the impact of the animal box on CT numbers, all tissue-equivalent materials were positioned within the head phantom, itself situated inside the animal box. Subsequently, a CBCT was conducted for each material using the best imaging protocol.
2.3. Photon beam characterization
To characterize the photon beam, depth dose profiles and lateral profiles were acquired for seven collimators at the SmART+ IB's isocenter operating at 200 kV, 20 mA, with the 0.5 mm copper filter (half-value layer (HVL): 1.03 mm Cu). Figure 3(C) shows the setup for the beam measurements, in which GafChromic EBT3 films (Ashland Inc., Wilmington, Delaware, USA) were placed inside a solid water slab phantom (type 451, Gammex-RMI GmbH, Gieen, Germany) at different depths for both 20 s and 80 s exposures.
The EBT3 films were calibrated in homogeneous radiation fields of 200 kV x-rays against a Farmer ionization chamber (type 30010, PTW Freiburg, Germany) and spread-out Bragg-peak protons at UPTD (Beyreuther et al 2019). Two days after irradiation, the films were scanned with a flatbed scanner (model Expression 11000XL, Seiko Epson Corporation, Düsseldorf, Germany) at 300 dpi and analyzed by a Python script (Python Software Foundation, www.anaconda.org, version 2.7) to calculate the absorbed dose to water Dw from the net optical density netOD:

with p1, p2, p3, q1 and q2 incorporating fit parameters.
2.4. Quality assurance for alignment
An essential component of the SAPPHIRE project for conducting preclinical in vivo experiments with small animals is a comprehensive QA. To ensure a reproducible and precise alignment of the proton beam, collimator, and target, a device-specific QA protocol was developed, which must be followed before starting the experiments including several QA phantoms.
2.5. Proton beam characterization
To characterize the evolution of the proton beam in air and its dose distribution in water, all SAPPHIRE components necessary for proton irradiation were assembled. Lateral and depth dose profiles were acquired at four different positions along the proton beam trajectory using an energy of 90 MeV. These positions encompassed the following locations: immediately behind the beam exit (at a distance of 5 cm), both preceding and following the range shifter, and directly behind the collimator. For the measurement of lateral and depth dose profiles in a water-equivalent target, a film stack consisting of 45 films (WET of 16.2 mm) was irradiated at each position. Film evaluation was performed in the same manner as described in equation (2).
Additional measurements of the lateral profiles were employed with a microDiamond detector (model 60019, PTW Freiburg, Germany) as described in Horst et al (2023), while for the laterally integrated depth dose profiles, the Giraffe multi-layer ionization chamber (IBA Dosimetry, Schwarzenbruck, Germany) was utilized with the same beam parameters.
2.6. Hounsfield lookup table
For a precise prediction of proton ranges on basis of CBCT images of SmART+ IB, a device and system-specific HLUT needs to be created defining the relationship between HU values and proton stopping power ratio (SPR) relative to water. To create this HLUT, 19 different cylindrical tissue-equivalent inserts (5 mm diameter, 30 mm length) were placed inside the head and body phantoms (see figures 3(A)/(B)). The assignment of the materials and their material properties can be found in the supplementary materials in table S1. For each phantom, a CBCT was taken with the best imaging protocol, and the SPRs were extracted from the work of Peters (2022). This empirical method for determining the HLUT was subsequently validated by the stoichiometric method of Schneider et al (1996) including 71 human tissues as well as the 19 materials. The influence of the animal box on the HLUT due to the shifted CT numbers was also assessed.
3. Results
3.1. CBCT imaging
The linear function parameters for the current HU calibration for all four imaging protocols are outlined in the supplementary materials in table S2, enabling the conversion of the CBCT's grey values into HU values. The cupping effect (Brooks et al 1976) in the x-direction of the SmART+ IB is shown in figure 4(A) for both head and body phantoms across four imaging protocols. Each plot includes a quadratic fit as a trendline overlay. Deviations in HU values between the edge and center of the phantoms are 15 HU for the head phantom and 40 HU for the body phantom, well below the CT number standard deviations of the inserts. This corresponds to a proton range uncertainty of <0.1 mm (<0.3 mm) for the head (body) phantom. These range uncertainties were calculated using the empirical HLUT of the 60 kV, 0.5 mA imaging protocol, in which deviations in HU values for solid water correspond to discrepancies in SPR values, hence resulting in range uncertainties. The body phantom profiles exhibit similar discrepancies to those observed in the head phantom. Many curves show a noticeable valley around the center, indicating a CBCT reconstruction artifact. The profiles in the y-direction have a similar pattern to the depicted x-profiles, while in the z-direction, there is no observed cupping effect (see supplementary materials figure S1/S2).

Figure 4. (A) Cupping effect in the x-direction for both head and body phantoms across the four imaging protocols including a quadratic fit as a trendline overlay. (B) Sagittal view of the midsection of a deceased laboratory mouse skull acquired with the 60 kV, 0.5 mA imaging protocol. (C) CT number differences (ΔCTnumber) for individual CT number measurements in water and air relative to their first measurements at time t = 0 min for both the head and body phantoms over a period of 2.5 h. (D) Differences in CT numbers (ΔCTnumber) with and without the animal box compared to the CT numbers with the animal box for the 60 kV, 0.5 mA imaging protocol for all tissue equivalent materials.
Download figure:
Standard image High-resolution imageTo minimize the imaging dose while upholding high image quality, the 60 kV, 0.5 mA (HVL: 1.85 mm Al) imaging protocol, with an imaging dose of less than 26 mGy, is set as the standard for future mouse experiments. A corresponding sagittal view of the midsection of a deceased laboratory mouse skull is displayed in figure 4(B). With acceptable low HU value deviations due to the cupping effect and a CNR of 25.48 ± 2.38 for the head phantom and 22.18 ± 2.20 for the body phantom, which allows for clear differentiation of all critical structures, the protocol proves to be suitable.
In figure 4(C), the CT number differences for individual CT number measurements in water and air are depicted relative to their first measurements at time t = 0 min for both the head and body phantoms over a period of 2.5 h. It can be observed that the CT number difference gradually increases over time due to the afterglow of the flat panel detector; however, this does not have any significant impact on the range prediction. The influence of the animal box on the CT numbers of the tissue equivalent materials was investigated for the 60 kV, 0.5 mA imaging protocol. The differences in CT numbers with and without the animal box can be observed in figure 4(D), indicating a linear relationship.
3.2. Photon beam characterization
In figure 5, both cross-plane (x-profile) and in-plane (y-profile) profiles are shown for seven different collimators in 10 mm (water) depth (figures 5(A)) and at various depths along the beam path for the Ø3.5 mm collimator (figure 5(B)). The dose values were consistently averaged (median) over five EBT3 films for each time and depth of the solid water slab phantom from figure 3(C). The corresponding full width at half maximum (FWHM) and penumbra values can be found in table 1. Gaussian fitting was applied for the Ø1 mm collimator (R2 = 0.992), while sigmoid edge fitting was used for the remaining collimators (R2 > 0.990). This involved utilizing 50% of the central beam dose for FWHM and 20%/80% of the central beam dose for the penumbra calculations. All collimators exhibit expected FWHMs and a slight increase in penumbra with larger collimators. For the Ø3.5 mm collimator, both the FWHM and penumbra increase linearly with depth for both profiles, as anticipated.
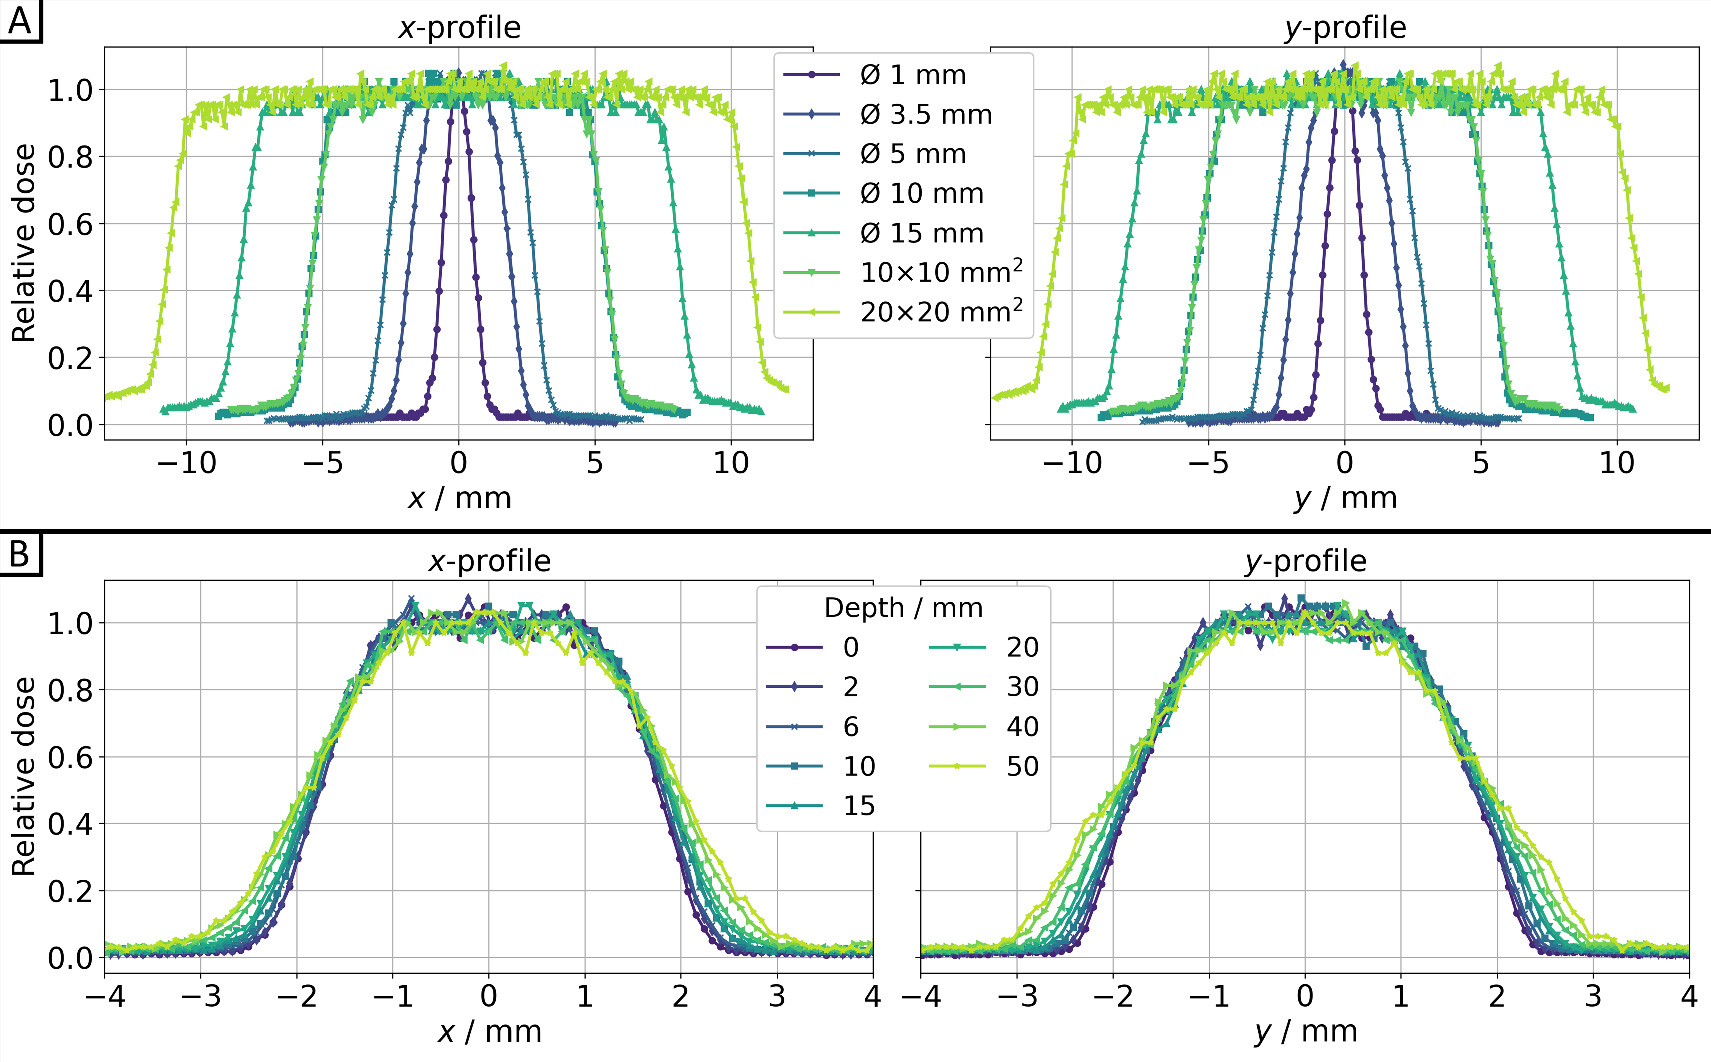
Figure 5. Dose profiles for the cross-plane direction (x-profile) and in-plane direction (y-profile) for 200 kV x-rays (0.5 mm Cu filter, HVL: 1.03 mm Cu) of SmART+ IB (A) for all collimators at depth z = 10 mm, as well as (B) for the Ø3.5 mm collimator for different depths, all measured using EBT3 films (relative measurement uncertainties <7%).
Download figure:
Standard image High-resolution imageTable 1. FWHM, lateral penumbra, and dose rates with standard deviation of photon beams obtained by film irradiation at 200 kV in the cross-plane direction (x-profile) and in-plane direction (y-profile) for all collimators at 10 mm depth (upper half of table) and for the Ø3.5 mm collimator as a function of WET (depth) (lower half of table). The two penumbra values represent the left and right penumbra of the respective x- and y-profiles.
| All | FWHM (mm) | Penumbra (mm) | Dose rate | |||
|---|---|---|---|---|---|---|
| collimators | Collimator | x-profile | y-profile | x-profile | y-profile | (Gy/min) |
| Ø1 mm | 1.17 | 1.35 | 0.58 | 0.63 | 0.78 ± 0.03 | |
| Ø3.5 mm | 3.65 | 3.65 | 0.77–0.74 | 0.81–0.83 | 2.15 ± 0.07 | |
| Ø5 mm | 5.35 | 5.36 | 0.81–0.75 | 0.84–0.87 | 2.29 ± 0.08 | |
| Ø10 mm | 10.71 | 10.68 | 0.85–0.81 | 0.89–0.91 | 2.46 ± 0.08 | |
| Ø15 mm | 16.04 | 15.93 | 0.98–0.86 | 1.05–0.99 | 2.65 ± 0.09 | |
| 10 × 10 mm2 | 10.74 | 10.70 | 0.86–0.85 | 0.95–0.98 | 2.51 ± 0.09 | |
| 20 × 20 mm2 | 21.34 | 21.29 | 1.06–0.92 | 1.08–1.08 | 2.75 ± 0.10 | |
| Ø3.5 mm | FWHM (mm) | Penumbra (mm) | Dose rate | |||
|---|---|---|---|---|---|---|
| collimator | Depth (mm) | x-profile | y-profile | x-profile | y-profile | (Gy/min) |
| 0 | 3.52 | 3.50 | 0.66–0.61 | 0.72–0.73 | 2.86 ± 0.10 | |
| 2 | 3.55 | 3.55 | 0.66–0.68 | 0.74–0.74 | 2.75 ± 0.11 | |
| 6 | 3.60 | 3.59 | 0.73–0.68 | 0.77–0.79 | 2.43 ± 0.07 | |
| 10 | 3.65 | 3.65 | 0.77–0.74 | 0.81–0.83 | 2.15 ± 0.07 | |
| 15 | 3.67 | 3.67 | 0.83–0.77 | 0.90–0.89 | 2.04 ± 0.06 | |
| 20 | 3.72 | 3.73 | 0.85–0.80 | 0.91–0.96 | 1.74 ± 0.06 | |
| 30 | 3.82 | 3.83 | 0.90–0.87 | 1.02–1.02 | 1.39 ± 0.05 | |
| 40 | 3.90 | 3.89 | 1.08–1.00 | 1.13–1.20 | 1.07 ± 0.04 | |
| 50 | 3.89 | 3.92 | 1.15–1.14 | 1.26–1.31 | 0.85 ± 0.03 | |
The dose rates for all investigated collimators can be found in table 1. The dose rate was calculated from the difference between the 80 s and 20 s exposed films, each including all dose values from a 9 × 9 px2 (0.76 × 0.76 mm2) field centered around the center of mass. It is evident that for larger collimators, the available dose rate is higher. Based on the dose rate values, relative depth dose profiles were determined and illustrated in figure 6, with normalization to a depth of 10 mm due to the greater fluctuation of surface dose values.
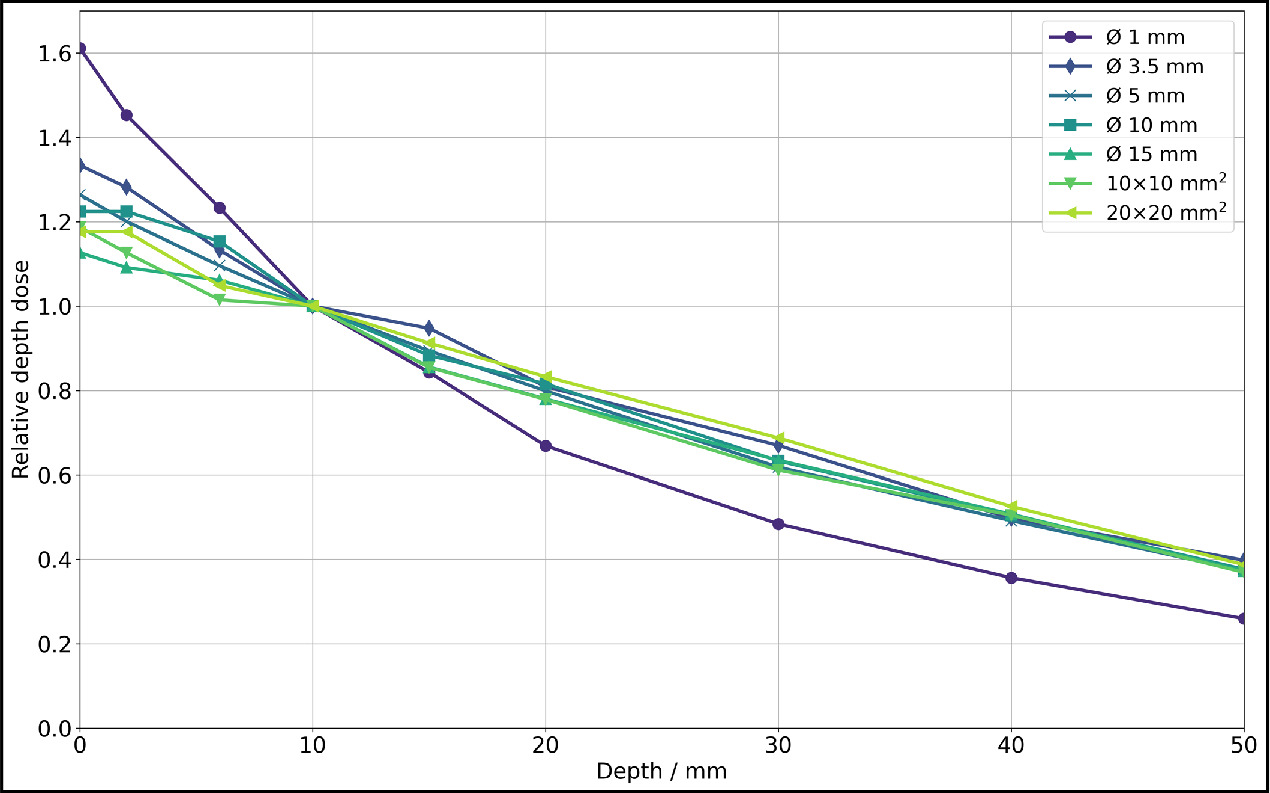
Figure 6. Relative depth dose for photon irradiation for all collimators at 200 kV x-rays (0.5 mm Cu filter, HVL: 1.03 mm Cu) of SmART+ IB, measured with EBT3 films (relative measurement uncertainties <7%). Normalization to a depth z = 10 mm was performed due to the greater fluctuation of surface dose values.
Download figure:
Standard image High-resolution image3.3. Quality assurance for alignment
A QA protocol (figure 7(A)) to be followed before each experiment is implemented for successful alignment of the collimated proton beam and the SmART+ IB isocenter using a custom-made QA phantom (50 mm × 50 mm × 87 mm) constructed from PMMA, as illustrated in figures 7(B)/(C).
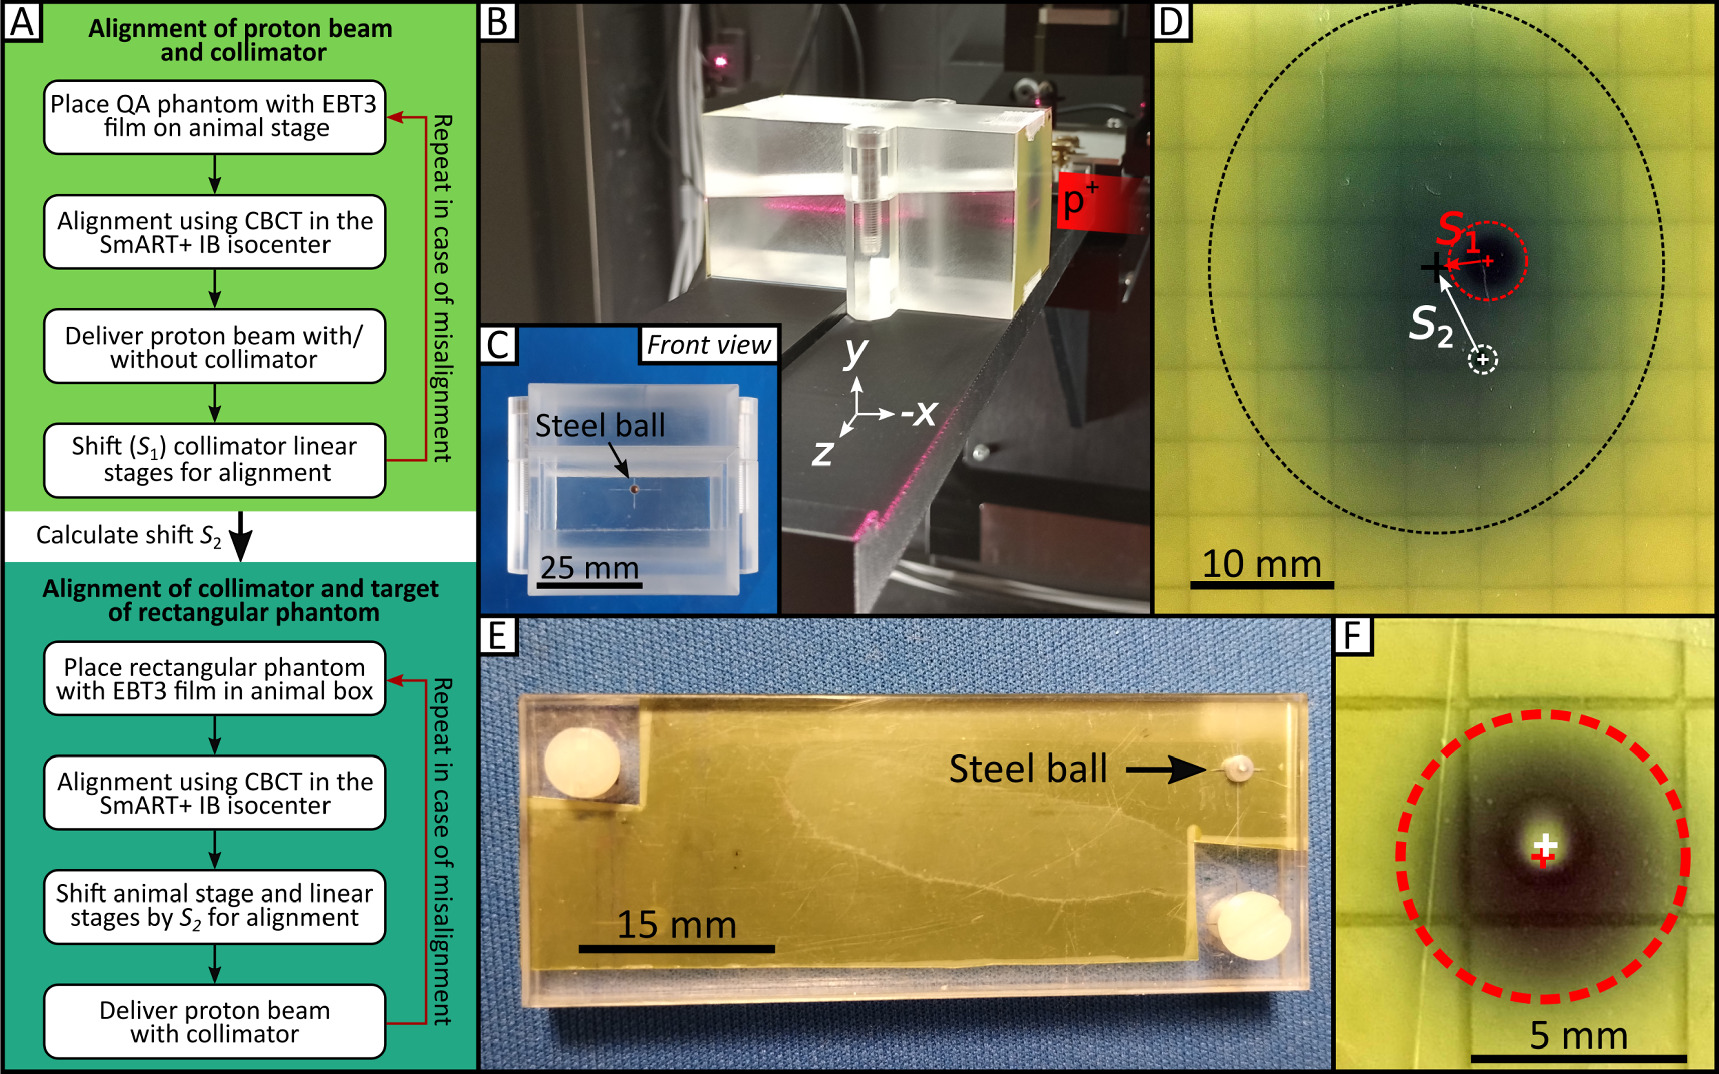
Figure 7. QA procedure and phantoms for SAPPHIRE. (A) QA procedure to align proton beam, collimator and mouse target. The QA protocol consists of two steps, the first being the alignment of the proton beam with the collimator, followed by the alignment of the collimated proton beam with the target of the rectangular phantom. (B) QA phantom with attached EBT3 film placed on the animal stage, with the proton beam coming from the right side. The 5° inclined cut can be seen throughout the phantom. (C) Front view of the PMMA QA phantom (50 mm × 50 mm × 87 mm) with the steel ball in the center, which is used as target in the CBCT. (D) Irradiated EBT3 film with the uncollimated beam spot (black dashed circle), the collimated beam spot (red dashed circle) and the marked target (white dashed circle) before alignment. (E) Rectangular phantom used for the daily QA routine. It houses an EBT3 radiochromic film and a steel ball. (F) After correct alignment involving the steel ball as the target, accurate irradiation results in a black patch (indicating dose absorption on the EBT3 film; represented by the dashed red circle) with a non-darkened area at the center (indicating the dose spared by the steel ball) with a deviation of <0.35 mm.
Download figure:
Standard image High-resolution imageFor the alignment of proton beam and collimator, the SmART+ IB is positioned in front of the proton beamline with the small proton beam window facing the beamline (figure 1). The QA phantom for collimator alignment is placed on to the animal stage as shown in figure 7(B). This phantom features a specially designed edge at the bottom for secure placement on the adapter. At the center of the phantom's surface facing the beam, a small steel ball with a 2 mm diameter is embedded to serve as the target for the QA procedure. EBT3 films can be placed on the same side of the phantom as the steel ball and within a 5° inclined cut trough the phantom for lateral beam profile and depth dose profile measurements, inspired from the work of Kim et al (2019). It must be ensured that the QA phantom is targeted by the proton beam when it is positioned at the SmART+ IB isocenter by using the integrated room laser system. A new EBT3 film is positioned on the front side of the phantom (note that the collimator holding the range shifter is not yet placed in the beam path). Afterwards, the proton beam window and the opposite door are closed, and a CBCT of the QA phantom is acquired using the 60 kV, 0.5 mA imaging protocol. The animal stage coordinates are  . The center of the steel ball (target) is identified in the CBCT, and the animal stage is then moved to position the steel ball in the isocenter resulting in new stage coordinates
  . Next, with the proton beam window and door opened again, a proton beam is delivered using 90 MeV, 0.1 nA for 17 s to produce an image of the beam spot (figure 7(D), black dashed circle). The collimator, along with the PMMA range shifter, is then introduced into the beam path, directly in front of the QA phantom with collimator axis coordinates
  . A second proton beam is delivered using 90 MeV, 0.1 nA for 80 s (figure 7(D), red dashed circle). The position of the steel ball is marked with a pen on the film (figure 7(D), white dashed circle), and the film is scanned using the flatbed scanner. The shift S1 between the center of the two dark patches from the proton beam is measured using Fiji ImageJ (version v1.53n, 64-bit Windows, Schindelin et al (2012)). Based on this, the collimator linear stages are adjusted, and the new coordinates
  are recorded, ensuring that the collimator is now aligned with the proton beam. To verify the alignment of the proton beam and collimator, the procedure is repeated. The shift S2 between the proton beam spot without the collimator and the marked (isocenter) position of the QA phantom's steel ball is also determined from the EBT3 film.
In order to align the collimated proton beam with the target for irradiation (steel ball), the rectangular phantom is used, as shown in figure 7(E). The steel ball of the rectangular phantom is located between two plastic plates, with an EBT3 film placed directly behind it. With the rectangular phantom in the animal box, a CBCT is acquired using the same imaging parameters as before. The center of the steel ball within the CBCT is used as target position and moved to the isocenter, resulting in new stage coordinates  . Then, the animal stage is shifted by S2, and the collimator stages are shifted by −S2 and the difference between P2 and P3. With accurate execution, the proton beam, collimator, and steel ball are now properly aligned. The result in figure 7(F) is obtained after delivering another proton beam using 90 MeV, 0.1 nA for 50 s, yielding a black patch (indicating dose on the EBT3 film) with an unexposed spot in the center (representing the dose spared by the ball). The deviation of the target from the actually irradiated spot is in this case <0.35 mm.
For multi-day mouse experiments, the SAPPHIRE alignment procedure of proton beam and collimator takes approximately 45 min and needs to be performed once per beam time, whereas the verification with the rectangular phantom should be conducted every morning prior to the initial animal irradiation. The targeting steps for the irradiation of mice will be identical to those of the rectangular phantom, targeting an anatomical structure instead of the steel ball.
3.4. Proton beam characterization
Figure 8 presents the relative lateral dose profiles in both the horizontal x- and vertical y-direction of the proton beam behind the Ø3 mm collimator at various depths in water. These profiles were measured using both EBT3 films (relative measurement uncertainties <6%) and the microDiamond detector (relative measurement uncertainties <1.5%) and show good agreement. Corresponding FWHM and penumbra values for the film measurements can be found in table 2. As expected, both FWHM and penumbra increase with depth. Sigmoid edge fitting was applied (R2 > 0.989), utilizing 50% of the central beam dose for FWHM and 20%/80% of the central beam dose for the penumbra calculations. Both horizontal directions (x-profile) and vertical directions (y-profile) exhibit similar FWHM trends, with the vertical direction showing a slightly sharper penumbra.

Figure 8. Lateral proton beam profiles for the horizontal direction (x-profile) and vertical direction (y-profile) in three different depths for the Ø3 mm collimator for a beam energy of 90 MeV, measured with EBT3 film stacks and the PTW microDiamond detector. Profiles from EBT3 films are normalized using the median dose value within a 9 × 9 px2 field centered around the center of mass of the proton beam, while the microDiamond measurements are normalized to their maximum. For the microDiamond measurements, horizontal 1D profiles (x-profiles) were captured at five different heights of the beam spot, requiring cubic interpolation (dotted line) between these points in the y-profile.
Download figure:
Standard image High-resolution imageTable 2. FWHM and lateral penumbra of proton beams obtained by film irradiation with a requested beam energy of 90 MeV in the horizontal direction (x-profile) and vertical direction (y-profile) for the Ø3 mm collimator as a function of WET (depth). The two penumbra values represent the left and right penumbra of the respective x- and y-profiles.
| FWHM (mm) | Penumbra (mm) | |||
|---|---|---|---|---|
| Depth (mm) | x-profile | y-profile | x-profile | y-profile |
| 5.82 | 2.94 | 2.95 | 0.85–0.86 | 0.79–0.89 |
| 9.90 | 3.00 | 3.00 | 1.04–1.01 | 0.99–1.02 |
| 13.54 | 3.07 | 3.16 | 1.08–1.14 | 1.07–1.03 |
The laterally integrated depth dose profiles obtained from the Giraffe (relative measurement uncertainties <0.1%), EBT3 films, and FLUKA simulations are illustrated in figure 9. FLUKA parameters (range shifter thickness and energy spread) were fine-tuned, and simulations were executed iteratively to match the Giraffe measurements, as described in Parodi et al (2012) for clinical proton beams. The energy spread obtained from this iterative optimization (flat energy distribution with a width of 1.28% centered at 90 MeV) fits well to the characteristics of the energy selection system in our proton therapy system. With the fine-tuned FLUKA model, a depth profile of the dose-averaged linear energy transfer (LETd) in water was calculated. Utilizing the LETd profile, corrections were applied to the EBT3 film measurements (see supplementary materials figure S3) due to the under-response U of EBT3 films near the Bragg peak (Anderson et al 2019) as follows:

It is worth noting that the function for under-response is based only on LETd values up to 9.27 keV μm−1, while values up to 17 keV μm−1 occurred in the measurements in this work. For these higher LETd regions, equation (3) was simply linearly extrapolated. The dose values from the Giraffe measurement are underrepresented in the Bragg peak compared to the EBT3 film measurements, corroborating the findings of Bäumer et al (2015). The dose rate at the Bragg peak (beam current 0.06 nA), calculated as the mean of all LETd-corrected EBT3 film dose values within a 9 × 9 px2 field centered around the center of mass, is 17.72 ± 0.35 Gy min-1. The distal 80% depth is 12.72 mm, and the 80%–20% fall-off distance is 1.13 mm, both obtained through the Bortfeld fit (Bortfeld et al 1996) of the Giraffe measurement (R2 = 0.993). While there is a range shift between the uncorrected depth dose profile of the EBT3 films and the Giraffe profile, it almost disappears when the LETd correction is taken into account.
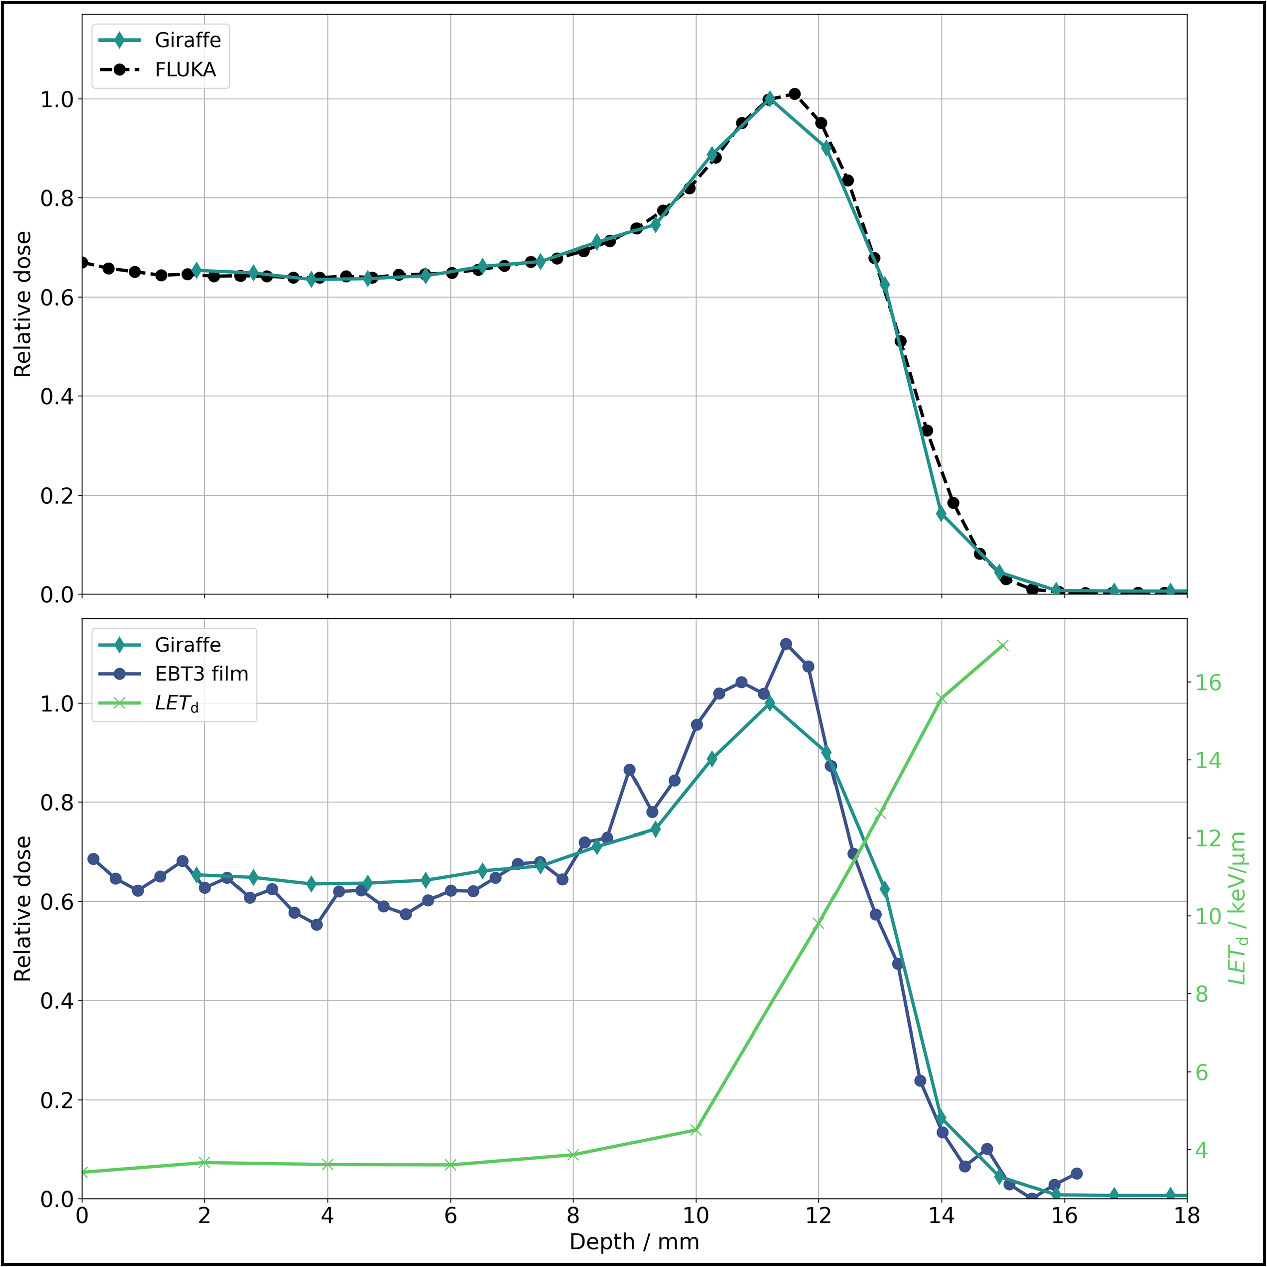
Figure 9. Integrated depth dose curves for proton irradiation for the Ø3 mm collimator for a beam energy of 90 MeV. The FLUKA simulations are tailored to match the Giraffe measurement (upper figure). In the lower figure, Giraffe measurements are compared with LETd-corrected EBT3 film measurements (according to Anderson et al 2019). These measurements have been normalized to their respective area under the curve. The LETd required for the correction showcasing its influence, particularly around the Bragg peak and the distal edge. The fluctuations in the EBT3 film measurements before the Bragg peak can be attributed to the uncertainties associated with the Flatbed scanner.
Download figure:
Standard image High-resolution image3.5. Hounsfield lookup table
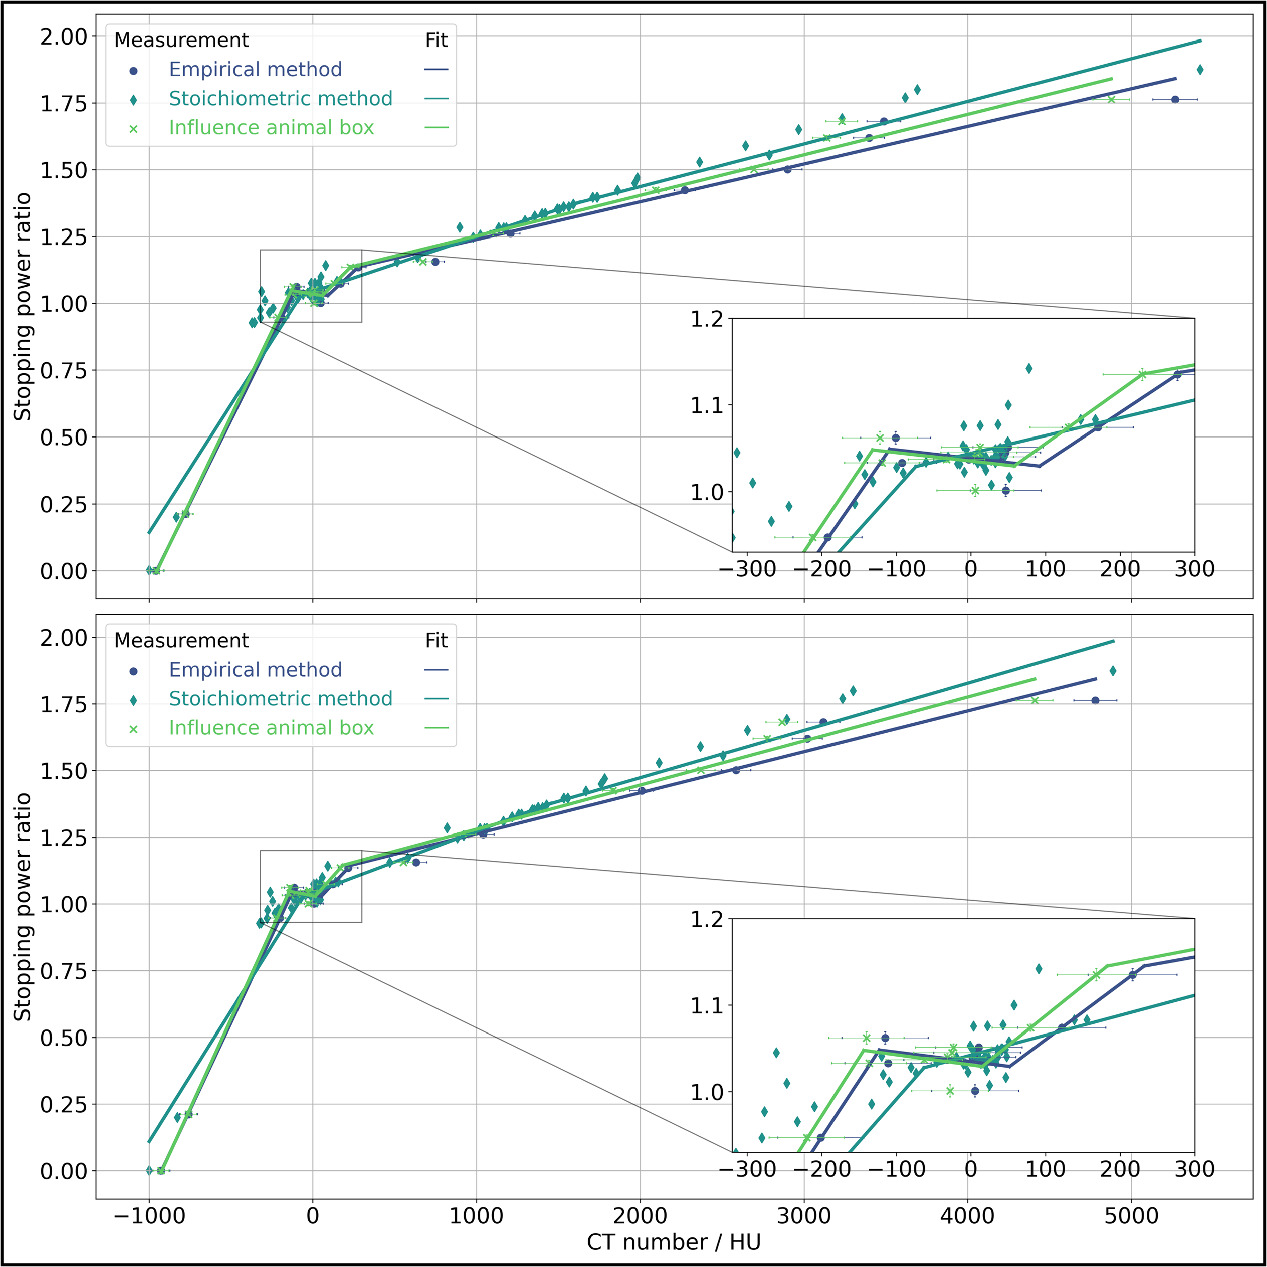
The HLUT for the 60 kV, 0.5 mA imaging protocol for the head and body phantom is shown in figure 10, created using both the empirical and stoichiometric method. A similar trend is observed for the soft tissues throughout both methods and phantoms, but for the low and high CT number tissues, the methods diverge. Also noticeable is the nearly identical trend of the individual calibration curves between the phantoms. The effect of the animal box on the HLUT for both phantoms is similary evident, as it rises concerning the increasing CT numbers in relation to the empirical method. Ultimately, the HLUT for the treatment planning and proton dose calcualtion of mouse experiments is not yet determined and will be specified for each experiment with the help of μRayStation. As an example, the empirical method has been validated for the 60 kV, 0.5 mA imaging protocol in the head phantom with three unknown materials, achieving an uncertainty of the distal 80% depth of Δr80 < 0.51 mm (4% of the residual range of the proton beam behind the range shifter and collimator).
Figure 10. HLUT for the 60 kV, 0.5 mA imaging protocol obtained by the empirical and stoichiometric method in the head (upper graph) and body (lower graph) phantom. Both methods utilized the 19 inserts, with the stoichiometric method further incorporating data from the 71 human tissues. Each method was divided into four sections, and a linear fit was created for each. The influence of the animal box on the empirical method is also shown.
Download figure:
Standard image High-resolution image
4. Discussion
The pivotal component of the SAPPHIRE system, the SmART+ IB device, was effectively implemented. Various in-house-built equipment and simulations were conducted to ensure that future mouse irradiations are reliable and safe. Whenever the proton beam is active, the door should be opened to prevent activation of the lead-lined wall of the fully shielded device. It is also crucial to double-check that the proton beam window is indeed open, and the flat panel detector is lowered to the bottom position. For additional safety, plastic plates can be placed on top of the detector to stop scattered protons. For radiation protection reasons, animals and humans should minimize their time near the collimator after proton irradiation. Additionally, at the end of each irradiation, the device's activation should be measured and documented using the locally available Scintillator Probe (model 6150AD-b/E, Automess, Ladenburg, Germany). During photon irradiation, the full protection features of the SmART+ IB become evident, eliminating the need for a separate x-ray room with access restrictions. This allows other experimenters to operate in the experimental area concurrently.
In order to safeguard the small animals during imaging, a low-dose imaging protocol with satisfactory image quality was identified. The cupping effect observed in the x- and y-direction is an expected artifact in cone beam imaging and was quantified for both head and body phantoms. These deviations in CT numbers are within an acceptable range, with only minor impact on the range prediction for proton therapy (<0.1 mm). The x-ray imaging using the SmART+ IB is fast and with high-resolution. Doses reported for CBCT imaging in mice range from 10 to 500 mGy (Verhaegen et al 2023, Wong et al 2008, Xstrahl Inc., Suwanee, Georgia, USA), whereby the dose of 26 mGy from the 60 kV, 0.5 mA imaging protocol of the SAPPHIRE system falls significantly at the lower end of the previously mentioned range. This value is also very similar to the previously used imaging device SAIGRT at the UPTD with an imaging dose of 31 mGy (Tillner 2019), so that experiments are highly transferable. These low doses enable multiple x-ray imaging sessions, crucial for fractionated treatment without affecting the dose distribution within the tumor or introducing any additional radiobiological effect on normal tissue.
A comprehensive characterization of lateral and depth dose profiles for both photon and proton beams was performed to facilitate secure dose calculations. The beam spot size and the sharp penumbra of smaller nozzle collimators are comparable to the values obtained by Gerlach et al (2020) and provide a good basis for irradiating subregions in mouse brains or other organs with photons while sparing the surrounding tissue. The penumbra values of the photon profiles in the SAPPHIRE system are slightly elevated compared to the values of the SAIGRT (Tillner 2019), owing to its shorter source-axis distance. However, these minor differences ensure that future experiments with SAPPHIRE can still be closely compared to those conducted with the SAIGRT. QA for the photon collimators and their precise alignment is already integrated into the SmART+ IB software. The SmART+ IB device allows for photon irradiation using a range of collimators, offering flexibility in treatment options. For proton irradiation experiments, multiple collimators can be swiftly constructed in various sizes and installed at the collimator stage, providing a broader range of irradiation options. Despite the slight disparity in collimator geometrical sizes between proton (Ø3 mm) and photon (Ø3.5 mm) irradiation, the anticipated beam spot in a comparative small animal experiment, such as targeting the dosimetric size of the mouse brain, is nearly identical due to the lateral scattering of the proton beam occurring behind the collimator exit. In the future, a wide range of other kind of experiments can be conducted on small animals, such as fractionated irradiations, RBE studies, or investigations into normal tissue damage.
Additionally, a QA protocol was developed to ensure robust, precise, and consistent alignment of all components for proton irradiation. The custom-made QA phantoms with an embedded steel ball serve as a reliable target for alignment verification. The system demonstrates a targeting accuracy of <0.35 mm, placing it on par with other small animal irradiators (Tillner et al 2014, 2016, Kim et al 2019, Schneider et al 2022). This level of precision proves adequate for a multitude of small animal experiments, considering the inherent difficulty in achieving precise animal positioning. The QA alignment procedure needs to be tested more often to monitor and improve its accuracy, as it had only been performed once. An automated method of alignment could involve the use of a Lynx detector (IBA Dosimetry, Schwarzenbruck, Germany) instead of EBT3 films with online evaluation of beam spot positions.
Fluctuations in the mean CBCT value directly result in variations in the predicted proton range (SPR). While the local variations may appear considerably larger compared to a clinical CT scanner, where standard deviations for water range from 2 to 5 HU, it is worth noting that in clinical practice dual-energy CT systems can be utilized (Forghani et al 2017). However, these systems would be undesirable due to the resulting increase in imaging dose. The range prediction of <0.51 mm can still be improved by correcting for cupping effects, e.g. by using the methods described by Kachelrie (2006) or Hunter et al (2012).
Future tasks encompass the integration and validation of proton and photon beam models in the treatment planning software μRayStation (RaySearch Laboratories, Stockholm, Sweden). This objective underscores the rationale behind conducting measurements at four positions along the proton beam path to run dose calculations for optimal treatment. The EBT3 film measurements will be fed into both the photon and proton beam models, while the Giraffe measurement will specifically contribute to the proton model. Additionally, efforts must be made to establish dosimetry protocols for both proton and photon irradiations prior each beam time including e.g. film measurements inside the 5° inclined cut from the QA phantom and the use of ionization chambers or a microDiamond detector for absolute dose measurements. In terms of actual mouse experiments and animal handling, there are plans to implement anaesthesia and heating solutions within the SmART+ IB system. The experimental area provides an ideal environment for this, as the room's monitored ventilation and air conditioning technology ensures a very constant temperature of 23.0 ± 0.2°C.
Overall, the combined efforts in system setup, imaging optimization, and beam characterization result in a robust and versatile platform for preclinical irradiation studies. The integration of both proton and photon irradiation capabilities, along with comprehensive QA protocols, positions this system as a valuable tool for advancing translational research in radiobiology and cancer therapy. The possibility of irradiating small animals with protons and photons enables comparative experiments within the same setup, environmental conditions, and procedures, allowing various experiments to be conducted reliably, even with larger cohorts.
5. Conclusion
The SAPPHIRE project is being established, a framework utilizing the SmART+ IB as a small animal imaging and irradiation device, designed for preclinical image-guided proton and photon therapy experiments at the UPTD. Aided by Monte Carlo simulations, we optimized and constructed all necessary setup components, laying the foundation for future dose calculations with different HLUTs. Additionally, we achieved a comprehensive 3D characterization of both proton and photon beams and developed an optimized CBCT imaging protocol with high image quality at low doses. To ensure precise proton beam application, a novel in-house phantom-based QA procedure was introduced. This integrated setup serves as a crucial bridge between preclinical investigations and potential clinical applications, enabling comparative animal experiments in the near future.
Data availability statement
The data that support the findings of this study are openly available at the following URL/DOI:https://doi.org/10.14278/rodare.2645.
Conflict of interest statement
The authors declare that the research was conducted in the absence of any commercial or financial relationships that could be construed as a potential conflict of interest.
Supplementary data (2.2 MB PDF)