
Abstract
Objective. Dose distribution estimation during the treatment course is essential for carbon ion radiotherapy because beam ranges are highly sensitive to density changes along beam paths, triggering the adaptive re-planning at an appropriate time. This study aims to investigate the feasibility of evaluating daily dose distributions using the divided-volume matching (DVM) technique without additional daily computed tomography (CT) scans for adaptive carbon ion radiotherapy for liver tumors. Approach. Phantom and patient data were included in this study. The developed in-house DVM software generated DVM CTs based on the existing resources, the planning CT, and orthogonal two-dimensional (2D) setup images. Bone matching (BM) and tumor matching (TM) are the two common ways of patient positioning correction to determine the isocenter for the irradiation of the day. We compared the dose distributions between DVM and in-room CTs with different isocenters based on BM or TM to verify whether the DVM CTs sufficiently represent the in-room CTs for daily dose distribution evaluations. Main results. For the phantom study, the clinical target volume coverage (V95%) differences between the in-room and the DVM CTs were <2%, and their dose distribution patterns were similar. For clinical data, the 3%/3 mm gamma passing rates were over 96%, and the planning target volume coverage (V95%) differences were <3% between the in-room and DVM CTs in nine out of ten patients. With different isocenters, the dose coverage of the DVM CT changed consistently with those of the in-room CT. Significance. The DVM technique enabled the evaluation of daily dose distributions without additional CT scans and was shown to be feasible in carbon ion radiotherapy for liver tumors.
Export citation and abstract BibTeX RIS

Original content from this work may be used under the terms of the Creative Commons Attribution 4.0 licence. Any further distribution of this work must maintain attribution to the author(s) and the title of the work, journal citation and DOI.
1. Introduction
Unlike photon treatment plans, considering range uncertainty is crucial for particle radiotherapy (Park et al 2012, McGowan et al 2013, Moyers et al 2020). Beam ranges are highly sensitive to density changes along beam paths, including setup errors, patients' anatomical changes, and motions associated with the respiratory cycle; such changes may occur on a daily basis, even in the same gating window settings (Paganetti 2012, Kraan et al 2013, Fukumitsu et al 2014). Bragg peak position shifts caused by range uncertainties can lead to either tumor underdose or excessive dose to surrounding normal tissues. Therefore, the timing of an adaptive plan intervention in particle therapy is critical because small water-equivalent thickness (WET) changes may induce significant dose variations compared to the original plan (Simone et al 2011, Mannina et al 2014, Hoffmann et al 2017).
Dose recalculations based on cone-beam computerized tomography (CBCT), periodically offline CT, and in-room CT are the three main approaches for evaluating daily dose distributions during the treatment course in particle therapy (Maeda et al 2018, Sun et al 2018, Green et al 2019, Giacometti et al 2020). However, CBCT may encounter inferior image quality and Hounsfield unit (HU) inaccuracy issues, which precludes its availability for direct dose recalculation (Fotina et al 2012, De Marzi et al 2013, Li et al 2022). Moreover, not all particle therapy centers are routinely equipped with CBCTs. The periodically offline CT approach utilizes a CT simulator for dose evaluation. However, the patient positioning between two separate setups is not completely reproducible to realistically reflect the daily dose on the treatment position. In-room CT offers diagnostic-level image qualities and is currently optimal for dose recalculations to determine plan adaptation (Wang et al 2011, Irie et al 2016, Oliver et al 2018); however, additional exposure doses to the patients are inevitable. The longer treatment room occupation time decreases the efficiency and flexibility of the treatment workflow.
Tashiro et al (2019) reported a 2D–3D matching technique, the divided-volume matching (DVM) technique, to visualize and estimate the 3D displacements of internal and bony structures to enable more accurate patient positioning for radiation therapy. The accuracy of the DVM technique for patient positioning was shown to be comparable to the conventional 2D–3D matching techniques. A CT volume was divided into two volumes, which were the volume of interest (VOI) and the base volume (BV). The VOI could be delineated arbitrarily and was supposed to cover the internal structure, such as the entire internal structure or just one organ with the target in it; the rest of the CT volume was the BV. The 3D positions and rotations of each volume can be adjusted independently and simultaneously. The 2D–3D matching was achieved by matching the orthogonal digital radiography (DRs) routinely taken at the patient positioning with the iteratively generated digitally reconstructed radiographs (DRRs) of the CT volume by changing the 3D positions and angles of VOI and BV. In other words, the final iterative DRRs reflected the patient's anatomy at the DRs captured moment and were potentially applicable for dose distribution evaluation.
The goal of this study is to investigate the feasibility of evaluating daily dose distributions of carbon ion radiotherapy for liver tumors using DVM without additional CT scans. A virtual CT (DVM CT) based on the final 2D–3D DVM matching results was generated and expected to reflect the anatomy at patient positioning, which was tested on phantoms and patient data.
2. Materials and methods
2.1. DVM technique
Figure 1 illustrates the concept of this study to verify whether DVM CTs are sufficiently representative of in-room CTs for dose distribution evaluations. The planning CT (PlanCT) was divided into two volumes: VOI (the yellow region of PlanCT in figure 1) and BV (the grey region of PlanCT in figure 1). The orthogonal 2D setup images were the DR images captured from the daily patient positioning before treatment. For DVM optimization, DRRs of the PlanCT were iteratively generated by adjusting the 3D positions and rotation angles of the VOI and BV of the PlanCT until the DRRs best match the 2D setup images. Upon matching, a virtual CT (DVM CT) reflecting the final DRRs is obtained, and this DVM CT is expected to reflect patients' anatomical structures at the positioning. The treatment room at Gunma University Heavy Ion Medical Center (GHMC) was equipped with an in-room CT (Aquilion™ LB, Canon Medical Systems, Japan) to evaluate the daily dose distribution; the in-room CT was the comparison target of the proposed DVM CT. To decrease inaccuracies resulting from anatomical changes during the acquisition time gap between the in-room CT and the DRs, the 2D setup images for DVM optimization were replaced by DRRs of the in-room CT.

Figure 1. Overview of the workflow in this study. The yellow region of PlanCT is the volume of interest (VOI), and the remainder is the base volume (BV). PlanCT, planning computed tomography; DRR, digitally reconstructed radiograph; LAT, lateral; DVM, divided-volume matching; BM, bone matching; TM, tumor matching.
Download figure:
Standard image High-resolution imageThe VOI and BV displacements along three directions and three rotational axes were obtained from the DVM optimization, as well as the final coordinates of the VOI and BV, respectively. By applying those to the isocenter of the PlanCT, the VOI and BV shifts could be calculated as follows (Tashiro et al 2019):


where  and
and  are the isocenter positions obtained after applying the BV and VOI shifts, respectively, in the DVM CT;
  and
and  are the
  matrix transformations representing the 3D displacements in both the translations and rotations of the BV and VOI, respectively; and
  is the original isocenter position.
2.2. Phantom simulation
Phantom simulations were implemented to test the workflow under a basic condition: steady BV with only shifted VOI and no unknown or complex motions. Two scenarios were simulated, both using chest phantoms: (1) phantom N-1 (Kyoto Kagaku Co., Ltd, Kyoto, Japan) inserted with a customized cuboid phantom as the clinical target volume (CTV) (figure 2(a)), and (2) a cylindrical four-dimensional CT (4DCT) imaging insert of the QUASARTM (Modus Medical Devices Inc. London, Canada) with the relatively high-density region as the CTV (figure 2(b)). Two CT scans of the chest phantom were performed in each scenario; the first scan was considered the PlanCT, and the second was considered the in-room CT containing manually shifted insertions with approximately 20 mm in the superior direction. The cuboid or cylindrical insertions were set as the VOI, and the remaining CT volume was considered the BV (figure 2).
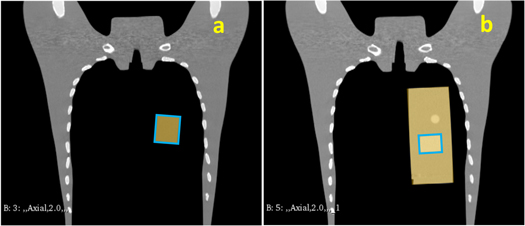
Figure 2. Illustration of Scenario 1 (a) and 2 (b), the yellow regions represent the volume of interest (VOI), and the blue rectangular areas represent the clinical target volume (CTV).
Download figure:
Standard image High-resolution imageBone matching (BM; figure 3(a)) and tumor matching (TM; figure 3(b)) are the two common methods of patient positioning correction adopted in clinical practice to determine the isocenter for irradiation of the day (Abe et al 2017). The dose distribution of the original treatment plan generated from the XiO-N® treatment planning system (Elekta Sweden; Mitsubishi Electric, Japan) was recalculated on the in-room and DVM CTs with different isocenters based on BM or TM to obtain the dose distributions for comparison. In addition, the dose distribution of the original plan was recalculated on the DVM CT with the isocenters calculated by the VOI and BV shifts to obtain the dose distribution of the DVM CT with the isocenter based on TM, which was DVM-TM, and that based on BM was DVM-BM. The dose distribution of the in-room CT with the isocenter based on TM was named InRoom-TM, and that on BM was InRoom-BM.
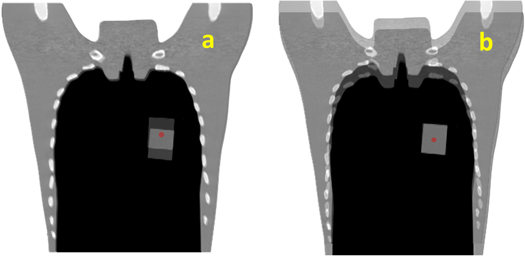
Figure 3. Illustration of bone matching (a) and tumor matching (b) for Scenario 1. The red dots represent the isocenter.
Download figure:
Standard image High-resolution image2.3. Patient data
DVM was initially applied to liver tumors for dose distribution evaluations because liver tumors can be relatively easily located in DR images by the contrast agent Lipiodol and/or fiducial markers. The diaphragm is another landmark for image registration besides bones (Yue et al 2012, Chan et al 2016). Data on ten hepatocellular carcinoma (HCC) patients treated with carbon ion radiotherapy at GHMC were collected in this retrospective study, which was approved by the institutional review board (approval number HS2022-044) of Gunma University Hospital; all patients were treated with two orthogonal beam directions. Of the patient treatment positions, four were prone, and six were supine; the tumor locations were S4 for two, S5 for one, S6 for two, S6 and S7 for one, S7 for three, and S8 for one.
Both the PlanCTs and daily in-room CTs were acquired at the gated end-exhalation phase; they were matched based on bony structures and markers to obtain the BM and TM shifts, respectively, from the isocenter on the in-room CT for dose recalculation. TM was typically achieved either by fiducial markers, such as metal markers implanted at the peripheral liver tissue near the target, or by residual Lipiodol deposition after transcatheter arterial chemoembolization (Abe et al 2017). The liver or the liver and surrounding tissues were delineated as the VOIs. The dose distributions of the original plans were recalculated on the in-room CTs and DVM CTs based on BM and TM for dose distribution comparison. As in the phantom study, we compared DVM-BM with InRoom-BM and DVM-TM with InRoom-TM.
The planning target volume (PTV) coverage (V95%, the percentage of the PTV receiving ≥95% of the prescribed dose) was used for dose comparison because the CTV coverage (V95%) differences between the PlanCT, InRoom-BM, DVM-BM, InRoom-TM, and DVM-TM were not significant. Sufficient geometrical PTV margins were provided to compensate for the uncertainties from the setup, beam range, and organ motion, ensuring CTV dose coverage (Langen and Zhu 2018). The geometric margin of the PTV in this study was generated from the calculation of the internal (IM) and setup margins (SM) based on Tashiro et al 2013. IM was derived from the tumor motions in six directions within the gating window on the 4DCT images. SM considered the system accuracy and potential patient positioning errors, including various machine characteristics, range uncertainties, and image-intrinsic errors. PTV was commonly defined geometrically for all directions, independent of the beam directions. Gamma index analysis was another supportive tool using a gamma criterion of 3%/3 mm, (Low et al 1998) provided a quantitative comparison to evaluate the point-by-point difference between the evaluated (DVM CT) and referenced (in-room CT) dose distributions in terms of dose difference and distance-to-agreement.
2.4. Examination of large inter-fractional motions
To test the performance of the DVM technique with large inter-fractional motions in patient data, patients' 4DCT images were used following the same workflow as the above section. Five patients among the 10 HCC patients with relatively more significant liver shifts (6.8–23.5 mm) on their 4DCTs between the end-of-exhalation and end-of-inhalation were selected. The end-exhalation phase of each 4DCT was considered the PlanCT, and the end-inhalation phase of the same 4DCT was considered the in-room CT to simulate large liver shifts. DVM CTs were generated from the DVM optimization based on the PlanCT and the 2D setup images, which were the two orthogonal DRRs of the in-room CT. The dose distribution comparison and the analysis between the DVM CTs and the in-room CTs were the same as reported in the above section.
3. Results
3.1. Phantom simulation results
The CTV coverage (V95%) and dose distributions in both scenarios are illustrated in figures 4 and 5. The CTV coverage (V95%) differences between InRoom-BM and DVM-BM and between the InRoom-TM and the DVM-TM, were minor in both scenarios (0.46% and −0.28% for scenario 1, −1.95% and −0.38% for scenario 2, respectively; figure 4). The dose distributions of the DVM-BMs (figures 5(c) and (h)) were similar to those of the InRoom-BMs (figures 5(b) and (g)), as were the DVM-TMs (figures 5(e) and (j)) and the InRoom-TMs (figures 5(d) and (i)). With different isocenters, the dose coverage of the DVM CT changed consistently with those of the in-room CT, indicating that estimating daily dose distribution from two radiographs was feasible.
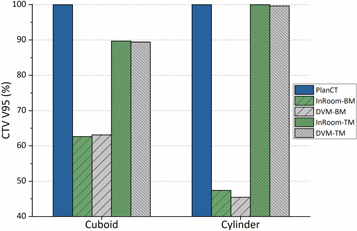
Figure 4. CTV coverage (V95%) comparisons for each scenario in phantom simulations.
Download figure:
Standard image High-resolution image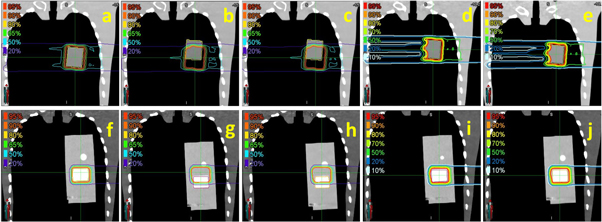
Figure 5. Isodose lines for each scenario ((a)–(e) for cuboid, (f)–(j) for cylindrical insertions) in phantom simulations. (a) and (f) are isodose lines of PlanCT, (b) and (g) are InRoom-BM, (c) and (h) are DVM-BM, (d) and (i) are InRoom-TM, and (e) and (j) are DVM-TM.
Download figure:
Standard image High-resolution image3.2. Clinical data results
A summary of the dose distribution comparison between the DVM CT and in-room CT for each HCC patient is shown in figure 6, tables 1 and 2. Moreover, the dose distribution of a representative patient is illustrated in figure 7. Between the in-room CT and DVM CT, the PTV coverage (V95%) differences were less than 3%, except for Patient 1 in the BM scenario and Patient 2 in the TM scenario, and the normal liver (total liver minus GTV) dose differences (V20Gy(RBE) and V10Gy(RBE)) were less than 2% (V20Gy(RBE) and V10Gy(RBE) were 0.28 ± 0.62% and 0.14% ± 0.68% for BM and 0.20 ± 0.26% and 0.08 ± 0.30% for TM, respectively). The gamma passing rates with a 3%/3 mm criterion were above 90% in all cases and above 96%, excluding Patient 1.
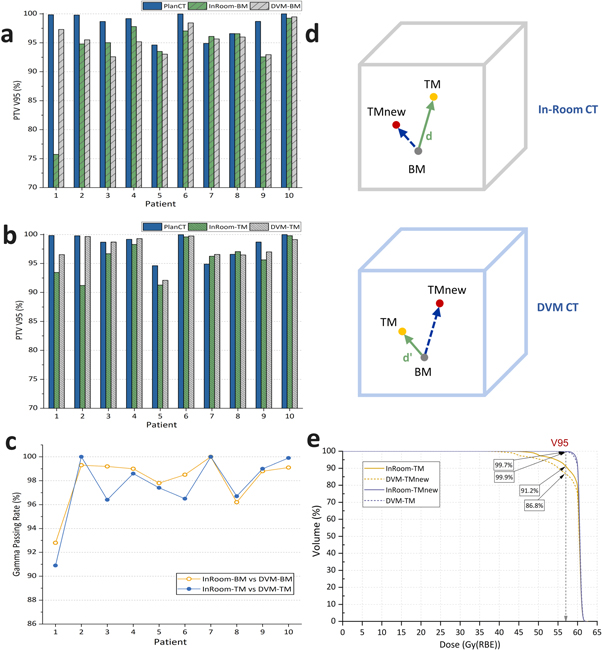
Figure 6. Planning target volume (PTV) coverage (V95%) comparisons in the bone (a) and tumor (b) matching scenarios for individual patients and their gamma passing rates with criterion 3%/3 mm (c). (d) illustrates the distances between the isocenters of BM and TM in the in-room CT and the DVM CT. (e) shows the dose-volume histogram (DVH) of InRoom-TM, DVM-TMnew, InRoom-TMnew, and DVM-TM for Patient 2. TMnew represent the new isocenters considering  in (d).
Download figure:
Standard image High-resolution imageTable 1. PTV coverage (V95%) differences and gamma passing rates of each patient.
| V95% dose coverage (%) | Gamma passing rate (%) | ||||||||
|---|---|---|---|---|---|---|---|---|---|
| Patient | Liver Motion (mm) | InRoom-BM | DVM-BM | Diff. (%) | InRoom-TM | DVM-TM | Diff. (%) | InRoom-BM and DVM-BM | InRoom-TM and DVM-TM |
| Clinical data results | |||||||||
| 1 | 11.4 | 75.73 | 97.30 | −21.57 | 93.44 | 96.53 | −3.09 | 92.8 | 90.9 |
| 2 | 8.3 | 94.80 | 95.50 | −0.70 | 91.22 | 99.67 | −8.45 | 99.3 | 100.0 |
| 2 a | — | — | — | — | 99.92 | — | 0.25 | — | 98.9 |
| 2 b | — | — | — | — | — | 86.76 | 4.46 | — | 99.4 |
| 3 | 4.6 | 95.02 | 92.59 | 2.43 | 96.70 | 98.70 | −2.00 | 99.2 | 96.4 |
| 4 | 1.1 | 97.81 | 95.18 | 2.63 | 98.31 | 99.30 | −0.99 | 99.0 | 98.6 |
| 5 | 5.0 | 93.50 | 93.04 | 0.46 | 91.28 | 92.10 | −0.82 | 97.8 | 97.4 |
| 6 | 2.6 | 97.05 | 98.45 | −1.40 | 99.60 | 99.75 | −0.15 | 98.5 | 96.5 |
| 7 | 0.4 | 96.10 | 95.66 | 0.44 | 96.26 | 96.58 | −0.32 | 100.0 | 100.0 |
| 8 | 0.5 | 96.58 | 96.00 | 0.58 | 97.07 | 96.48 | 0.59 | 96.2 | 96.7 |
| 9 | 2.0 | 92.57 | 92.96 | −0.39 | 95.63 | 97.01 | −1.38 | 98.8 | 99.0 |
| 10 | 3.2 | 99.25 | 99.48 | −0.23 | 99.81 | 99.14 | 0.67 | 99.1 | 99.9 |
| Large inter-fractional motion results | |||||||||
| 3 | 23.5 | 59.83 | 58.74 | 1.09 | 94.25 | 97.31 | −3.06 | 96.3 | 98.4 |
| 5 | 12.7 | 75.06 | 71.42 | 3.64 | 95.08 | 93.66 | 1.42 | 98.3 | 98.4 |
| 6 | 6.8 | 94.90 | 96.25 | −1.35 | 98.18 | 99.05 | −0.87 | 98.2 | 99.1 |
| 9 | 11.5 | 77.64 | 79.31 | −1.67 | 98.44 | 98.87 | −0.43 | 99.3 | 99.9 |
| 10 | 14.3 | 76.07 | 69.85 | 6.22 | 98.84 | 99.42 | −0.58 | 98.7 | 99.2 |
Abbreviations: BM = bone matching; Diff. = difference; DVM = divided-volume matching; PTV = planning target volume; TM = tumor matching. a Results of InRoom-TMnew. b Results of DVM-TMnew.
Table 2. Normal liver (total liver minus GTV) dose differences of each patient.
| Patient | 1 | 2 | 3 | 4 | 5 | 6 | 7 | 8 | 9 | 10 |
|---|---|---|---|---|---|---|---|---|---|---|
| V20Gy(RBE) (%) | ||||||||||
| InRoom-BM | 10.42 | 14.33 | 22.08 | 12.34 | 18.94 | 17.96 | 9.74 | 30.70 | 22.17 | 10.37 |
| DVM-BM | 10.02 | 14.35 | 20.11 | 12.42 | 18.66 | 17.87 | 9.96 | 30.48 | 22.02 | 10.41 |
| Diff. | 0.40 | −0.02 | 1.97 | −0.08 | 0.28 | 0.09 | −0.22 | 0.22 | 0.15 | −0.04 |
| InRoom-TM | 10.62 | 13.26 | 23.94 | 12.70 | 17.71 | 17.45 | 9.78 | 30.48 | 21.71 | 10.91 |
| DVM-TM | 10.05 | 13.16 | 23.57 | 12.67 | 17.71 | 17.32 | 10.04 | 30.33 | 21.40 | 10.32 |
| Diff. | 0.57 | 0.10 | 0.37 | 0.03 | 0.00 | 0.13 | −0.26 | 0.15 | 0.31 | 0.59 |
| V10Gy(RBE) (%) | ||||||||||
| InRoom-BM | 14.70 | 18.50 | 24.39 | 14.05 | 21.27 | 22.18 | 14.03 | 34.10 | 27.23 | 15.54 |
| DVM-BM | 14.90 | 18.43 | 22.46 | 14.42 | 20.95 | 22.09 | 14.21 | 33.99 | 27.10 | 16.03 |
| Diff. | −0.20 | 0.07 | 1.93 | −0.37 | 0.32 | 0.09 | −0.18 | 0.11 | 0.13 | −0.49 |
| InRoom-TM | 14.61 | 17.28 | 26.36 | 14.39 | 19.98 | 21.55 | 14.10 | 33.82 | 26.49 | 15.88 |
| DVM-TM | 14.94 | 17.14 | 26.03 | 14.77 | 19.91 | 21.22 | 14.23 | 33.92 | 26.06 | 15.45 |
| Diff. | −0.33 | 0.14 | 0.33 | −0.38 | 0.07 | 0.33 | −0.13 | −0.10 | 0.43 | 0.43 |
Abbreviations: BM = bone matching; Diff. = difference; DVM = divided-volume matching; TM = tumor matching.
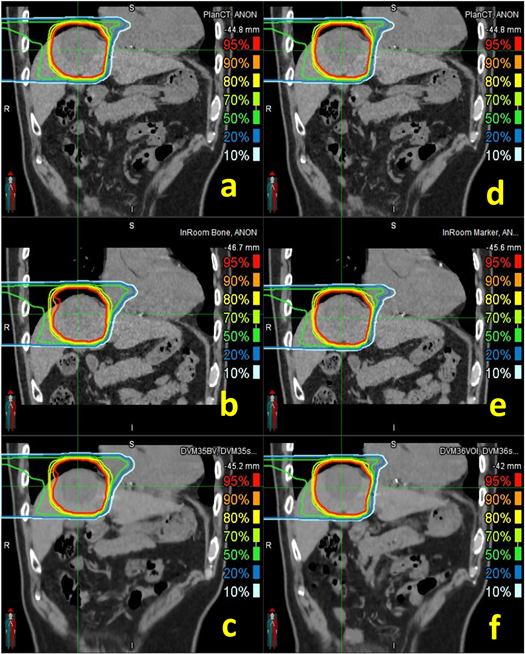
Figure 7. Isodose lines of bone (left column) and tumor (right column) matching scenarios in PlanCT ((a) and (d)), InRoom-BM (b), DVM-BM (c), InRoom-TM (e), and DVM-TM (f) for Patient 3.
Download figure:
Standard image High-resolution imageFor Patient 2 in the TM scenario, the PTV coverage of the InRoom-TM was significantly lower than that of the InRoom-BM, unlike the other nine cases, which were approximately equal. This may be because the marker shifts inside the liver did not always represent the motions of the entire liver and/or tumor; the distance between the isocenters of BM and TM in the in-room CT and the DVM CT was different by 4.2 mm ( in figure 6(d)) for Patient 2, i.e. the isocenter position of TM in the in-room CT was considerably different from that determined by DVM CT. Applying the difference to determine the new isocenter for InRoom-TM, the new dose distribution for InRoom-TM (InRoom-TMnew, called Patient 2a) could be obtained by recalculating the dose based on the new isocenter. By comparing InRoom-TMnew to DVM-TM, the PTV coverage difference decreased to 0.25%, which was considerably lower than the PTV coverage difference between InRoom-TM and DVM-TM (−8.45%). Conversely, obtaining the new dose distribution the same way as the above for DVM-TM (DVM-TMnew, called Patient 2b), the PTV coverage difference between InRoom-TM and DVM-TMnew decreased to 4.46%. The PTV coverage comparisons between PlanCT, InRoom-TM, DVM-TMnew, InRoom-TMnew, and DVM-TM for Patient 2 are presented in figure 6(e).
The dose coverage differences between InRoom-BM and DVM-BM were 0.42 ± 1.35%, excluding Patient 1; they were −0.46 ± 0.91% between InRoom-TM and DVM-TM, excluding Patient 1 and replacing Patient 2 with Patient 2a. The same trend can be seen in the clinical data as in the phantom data that the dose coverage of the DVM CT changed consistently with those of the in-room CT with different isocenters. The results showed that the DVM CT was similar to the in-room CT for liver cases; therefore, DVM CT is sufficiently representative of in-room CT for evaluating dose distributions for liver cases.
3.3. Results of large inter-fractional motions
The CTV and PTV coverage comparisons of five patients simulating large inter-fractional motions are shown in figure 8 and table 1. CTV coverage differences between InRoom-BM and DVM-BM and between InRoom-TM and DVM-TM were 2.18 ± 2.82% and −0.24 ± 0.42%, respectively. PTV coverage differences between InRoom-BM and DVM-BM and between InRoom-TM and DVM-TM were 1.59 ± 3.36% and −0.7 ± 1.6%, respectively. The dose coverage differences between in-room CTs and DVM CTs were small in both BM and TM scenarios. The magnitude of the change in dose coverage of the DVM CT followed that of the in-room CT at different isocenters in all selected patients. This indicated that in-room CTs and DVM CTs had high similarities in dose distribution, and the DVM technique could be applied to patient data with relatively large inter-fractional motions. The dose coverage differences between InRoom-TM and DVM-TM were slightly smaller than those between the InRoom-BM and DVM-BM. A possible reason for this is that the proportion of the CTV/PTV located on the steep dose gradient region was higher for BM than TM, making the dose coverage sensitive to small displacement differences.
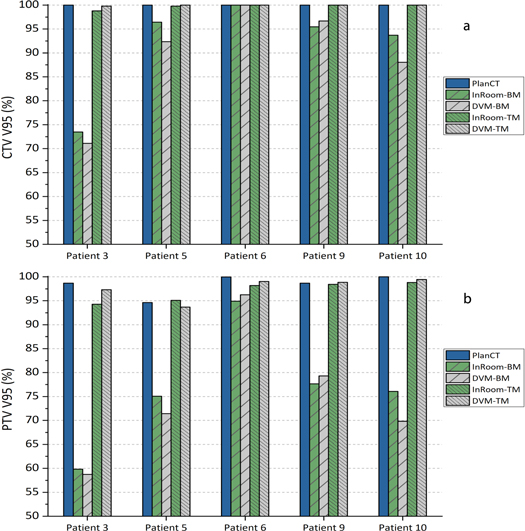
Figure 8. Clinical target volume (CTV; (a)) and planning target volume (PTV; (b)) coverage (V95%) of PlanCT, InRoom-BM, DVM-BM, InRoom-TM, and DVM-TM in five patients with large inter-fractional motions.
Download figure:
Standard image High-resolution image4. Discussion
This study examined the feasibility of evaluating daily dose distributions using DVM CT through phantom studies and patient data. The CTV/PTV coverage differences were <2% in the phantom study and <3% in the clinical data for nine out of ten patients (excluding Patient 1). The dose coverage of DVM CT changed with the dose coverage of in-room CT at different isocenters. This showed that the daily dose distributions between DVM CT and in-room CT had high similarities and supported the concept that DVM CTs sufficiently represent in-room CTs to evaluate daily dose distributions. Although 2D setup images were substituted by DRRs of in-room CTs in this study, Tashiro et al (2019) have verified the accuracy and established the procedure of using DR images as 2D setup images for patient positioning by DVM in clinical practice.
Unlike the conventional 2D–3D matching techniques used in most particle facilities for patient positioning (Wein et al 2005, Wu et al 2009, Li et al 2015), the matching regions of interest can be the bony structures or fiducial markers, leading to different isocenters for treatment, and thus, different dose distributions. The proposed DVM method allows choosing different isocenters (setups). The DVM technique simultaneously considers the internal (VOI) and bony structures (BV) while providing their corresponding isocenters, which helps efficiently determine the optimum isocenter for patient positioning. A relatively higher coverage difference between InRoom-TM and DVM-TM (−8.45%) was noted in Patient 2 due to the inconsistency of the isocenter positions. After correcting the isocenter of InRoom-TM, the PTV coverage difference between DVM-TM and InRoom-TM decreased to 0.25%, and the PTV coverage of InRoom-TM increased from 91.22% to 99.92%. These results have two implications: (1) The DVM technique potentially provided better isocenter determination than the conventional TM method and enabled the determination of the optimal isocenter for treatment by comparing the isodose distribution calculated based on BM/TM before treatment, furthermore, it not limited to BM/TM, further new isocenter with better isodose distribution could possibly be found as well. (2) The in-room CTs were not completely replaceable, and the proposed method would be clinically safer if combined with weekly CT scans to avoid unpredictable situations similar to those observed in Patient 1 and 2.
When performing DVM on liver cases, a contradiction may exist between the diaphragm and the lower part of the liver. However, the DVM CT does not need to be perfectly matched with the entire in-room CT because only tissues along the beam paths affect the recalculated dose distributions. Livers are solid organs, and the alignment patterns between the target and the liver do not change significantly during treatment. Additionally, incident beam angles in liver cases mostly avoid the gastrointestinal tract for particle therapy (Chuong et al 2020). Therefore, liver cases with anatomical changes outside the beam paths or behind the targets (e.g. gastric or bowel filling) are applicable to the proposed method. Although the CT values of the DVM and In-room CT are not identical for each voxel, this difference is shown to be negligible from our dosimetric comparison results.
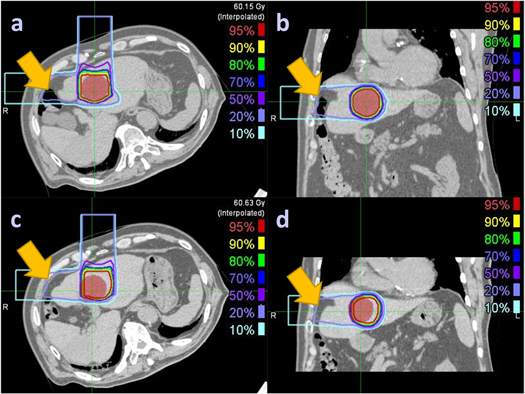
It is important to know the unsuitable conditions for the clinical use of the DVM method. The DVM CT is obtained by adjusting the VOI and BV of the PlanCT to match the DRRs of the adjusted PlanCT with the 2D setup images. Therefore, gastrointestinal tract motility in the beam paths during the treatment course cannot be estimated by the current DVM technique, as was the case with Patient 1 (figure 9). An unusual space was noticed between the abdominal wall and the liver. The large intestines could move into the space on the day of the CT simulation but be absent on the treatment day. The PTV coverage difference between InRoom-BM and DVM-BM for Patient 1 was high (−21.57%) but low (−3.09%) between InRoom-TM and DVM-TM. This substantial difference was mainly due to the PTV coverage difference between InRoom-BM (75.73%) and InRoom-TM (93.44%), resulting from liver deformation caused by the extrusion of the large intestines rather than DVM optimization errors, as the PTV coverage of the DVM-BM (97.3%) and DVM-TM (96.53%) were similar.
Figure 9. Liver deformation between PlanCT ((a) and (b)) and InRoom-BM ((c) and (d)) for Patient 1. The red-color wash regions denote the PTV, and the yellow arrows point out the unusual space that the large intestines could move into on the day of the CT simulation but be absent on the treatment day, making the liver deformed.
Download figure:
Standard image High-resolution image
Although the DVM technique is currently limited in the types of deformation it can handle, the technique is efficient and reliable in finding changes in particle beam range and target coverage in clinical practice. This technology provides a promising solution to CT-less evaluation of daily dose distribution and requires further development. Future development to broaden the application of this technology has two possible directions: (1) Increase the number of volumes for DVM optimization. The DVM technique can currently optimize only two volumes (VOI and BV), limiting the extension of the proposed method to those cases of tumors surrounded by organs at risk (OAR). In liver cases, the normal liver was included in the VOI and able to be assessed as a surrounding OAR, as shown in table 2. Comparable results were obtained between the DVM CT and in-room CT; however, further OAR assessment requires future development in the DVM optimization containing multiple VOIs. (2) Create the DVM CT in combination with deep learning. It is difficult for the current DVM technique to match invisible structures in x-ray images; however, deep learning has recently been applied to track tumor motions with low visibility in x-ray fluoroscopy without fiducial markers (Terunuma et al 2018). Integrating such techniques may improve the capability of DVM optimization, shorten processing time, and extend this technique to other tumor sites. Our study focused on the target dose coverage; peripheral OAR evaluation was out of scope; nevertheless, the above improvements with appropriate deformable image registration (DIR)-like techniques requiring no additional daily CT scans are expected to make peripheral OAR evaluation possible.
5. Conclusions
This study offered an innovative direction for evaluating daily dose distributions without daily additional CT scans. The DVM CT was generated from the PlanCT and orthogonal 2D setup images. The proposed method can potentially prevent HU inaccuracy problems of CBCT, lower cost, improve treatment room usage efficiency, smooth workflows, trigger the adaptive re-plan procedure at an appropriate time without increasing the patient dose by repeat imaging, and integrate with the future development of online adaptive radiotherapy—from patient positioning to daily dose distribution evaluation to online adaptation.
Acknowledgments
The authors thank all the clinical staff who participated in collecting the clinical data and Penguin System Co., Ltd. for the software and hardware support.
Data availability statement
The data cannot be made publicly available upon publication because they contain sensitive personal information. The data that support the findings of this study are available upon reasonable request from the authors.
Funding statement
This work was partly supported by research grants from the JST SPRING, Grant number JPMJSP2146, JSPS KAKENHI, Grant No. JP18K07744, and a graduate research stipend from Gunma University Leading Program for Cultivating Global Leaders in Heavy Ion Therapeutics and Engineering.
Conflict of interest
Tatsuya Ohno reports financial support from Hitachi Ltd. outside the submitted work. Jing-Ni Chen and Mutsumi Tashiro report no conflict of interest.
Ethical statement
This retrospective study was approved by the Institutional Review Board of Gunma University Hospital (approval number HS2022-044).