
Abstract
Objective. In positron emission tomography (PET) rigid motion correction, erroneous tracking information translates into reduced quality in motion corrected reconstructions. We aim to improve the accuracy of the motion tracking data, to improve the quality of motion corrected reconstructions. Approach. We developed a method for correction of marker/skin displacement over the skull, for tracking methods which require multiple markers attached on the subject head. Additionally, we correct for small magnitude (∼1–2 mm) residual translation tracking errors that can still be present after other corrections. We performed [18F]FDG scans in awake mice (n = 8) and rats (n = 8), and dynamic [18F]SynVesT-1 scans in awake mice (n = 8). Head tracking was performed with the point source tracking method, attaching 3–4 radioactive fiducial markers on the animals' heads. List-mode even-by-event motion correction reconstruction was performed using tracking data obtained from the point source tracking method (MC), tracking data corrected for marker displacement (MC-DC), and tracking data with additional correction for residual translation tracking errors (MC-DCT). Image contrast, and the image enhancement metric (IEM, with MC as reference) were calculated in these 3 reconstructions. Main results. In mice [18F]FDG scans, the contrast increased on average 3% from MC to MC-DC (IEM: 1.01), and 5% from MC to MC-DCT (IEM: 1.02). For mice [18F]SynVesT-1 scans the contrast increased 6% from MC to MC-DC (IEM: 1.03), and 7% from MC to MC-DCT (IEM: 1.05). In rat [18F]FDG scans contrast increased 5% (IEM: 1.04), and 9% (IEM: 1.05), respectively. Significance. The methods presented here serve to correct motion tracking errors in PET brain scans, which translates into improved image quality in motion corrected reconstructions.
Export citation and abstract BibTeX RIS

Original content from this work may be used under the terms of the Creative Commons Attribution 4.0 licence. Any further distribution of this work must maintain attribution to the author(s) and the title of the work, journal citation and DOI.
Introduction
Motion correction in positron emission tomography (PET) is an important processing step to obtain images with accurate quantification. In the clinical setting, voluntary (e.g. patient movement) and involuntary (e.g. respiratory and cardiac) motion can deteriorate the image to the point of making the image unusable. For long PET scans, that can have a duration longer than one hour, avoiding patient motion is difficult. For this reason extensive research is performed in PET motion correction for the clinical setting (Kyme and Fulton 2021). In preclinical research, motion correction additionally allows performing scans of awake rodents to circumvent the use of anesthesia (Miranda et al 2021). Particularly for brain motion correction, rigid motion tracking is performed since it is assumed that the brain does not present non-rigid motion. In the clinical setting, recently data-driven methods have gained popularity (Jiao et al 2015, Spangler-Bickell et al 2021, Sundar et al 2021, Sun et al 2022). Some tracking methods used for human motion tracking can also be used for rodent head motion tracking, but usually they have to be adapted to handle the smaller size of the animal head and the larger range of motion (Miranda et al 2021). Methods used for rodent head motion tracking include tracking of rigid checkerboard markers attached on the animal head (Kyme et al 2008, Spangler-Bickell et al 2016), markerless motion tracking using detection of head features (Kyme et al 2014), markerless motion tracking using structured light (Miranda et al 2017a), and detection of radioactive fiducial markers attached on the animal head (Miranda et al 2017b).
The motion tracking information can then be used in event-by-event motion correction reconstruction (Rahmim et al 2008) to obtain PET images unaffected by motion. The image quality of the motion corrected reconstruction depends, among other factor, on the accuracy of the motion tracking data (Spangler-Bickell et al 2016). For rodent head motion tracking a sub millimetric tracking accuracy is desirable due to the spatial resolution of preclinical PET scanners, of around 1.5 mm or smaller. In addition, due to the (possible) high speed motion of the rodent a high tracking frequency (>30 Hz) is desirable (Spangler-Bickell et al 2016, Miranda et al 2021).
For marker based head motion tracking it is assumed that the marker attached on the head follows the movement of the brain. However, if the marker slips, for example due to displacement of the skin on which the marker is attached, the relative position of the marker to the brain changes, producing inaccurate motion information. Moreover, residual motion tracking errors can be present due to inaccuracies in the spatial calibration of the tracking system, the inherent tracking accuracy of the system, and the finite tracking frequency.
Here we propose a method to detect errors in marker-based rigid motion tracking information due to displacement of the marker relative to the brain. The proposed procedure is suited for methods that use several markers attached on the head. In addition, we developed a method to correct for small residual translation errors present in the motion tracking data. The later correction method can be used for any motion tracking method. The correction methods were evaluated in awake brain PET scans of freely moving mice, using the tracers [18F]FDG and [18F]SynVest-1, and in awake rat brain [18F]FDG scans. Single frame scans after an uptake period were performed using [18F]FDG, while dynamic acquisition was performed using [18F]SynVest-1 to evaluate the methods when the tracer activity changes over time.
Methods
Motion tracking scans
Mouse experiments followed the European Ethics Committee recommendations (Decree 2010/63/CEE) and were approved by the Animal Experimental Ethical Committee of the University of Antwerp, Antwerp, Belgium (ECD 2020-71). Animals were tracked with the point source tracking method (Miranda et al
2017b, 2019). A plastic holder (figure 1(a)) was used to keep the animals insider the scanner field of view. For each animal, F-18 point sources were prepared with an activity between 250 and 500 kBq. For mouse [18F]FDG scans (n = 4, 25.4  1.88 g, 2 scans per mouse), 2 point sources were attached below the ears, one on the nasal bridge, and a fourth one on top of the head on a spacer (figure 1(a)). Initially, mice were anesthetized with isoflurane (5% for induction, 2% for maintenance, with medical oxygen flow) during 10 min for pasting of the point sources. [18F]FDG was injected (15.1
  0.83 MBq) through the tail vein 10 min after stopping isoflurane anesthesia. An awake tracer uptake period of 30 min was considered, followed by a 20 min awake PET scan. For mouse dynamic [18F]SynVesT-1 scans (n = 8, 18.5
  0.95 g) point sources were prepared and attached in the same way as in [18F]FDG scans. After point source placement, mice recovered for 60 min from anesthesia. [18F]SynVesT-1 (9.18
  2.22 MBq) was administered through the tail vein. Injection was performed outside the scanner, rapidly placing the mouse in the scanner, effectively losing the first 30–50 s of the 1 h scan. Figure 2 shows an example of tracked mouse head motion during a [18F]SynVesT-1 scan.
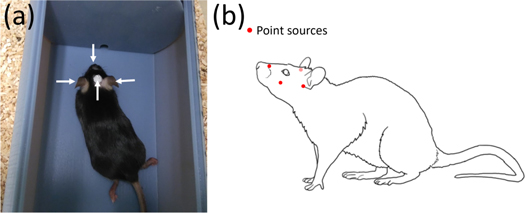
Figure 1. (a) Mouse inside the holder used to maintain it in the scanner field of view. White arrows indicate the position of the point sources. (b) Position of the point sources on the rat head.
Download figure:
Standard image High-resolution image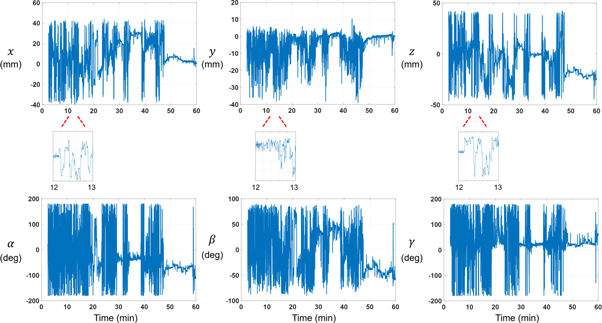
Figure 2. Example of head translation and rotation (Euler angles) for a mouse scanned with [18F]SynVesT-1. A time zoom (with same y axis scale) from 12 to 13 min is shown below every respective translation plot.
Download figure:
Standard image High-resolution imageRat experiments were performed in accordance with the German Animal Protection Act and approved by the governmental authorities (reference number 81-02.04.2020.A274). In rat [18F]FDG scans (n = 8, 510  72 g), the tracer was administered intraperitonially (25.4
  1.4 MBq) considering an uptake period of 1 h, followed by the awake PET scan. Point sources were attached in the awake state (no anesthesia used in any part of the procedure) 8 min before the start of the scan. Two point sources were fixed below the ears, one on the nasal bridge, and one below one eye (figure 1(b)). Rats were placed in the plastic holder and scanned for 30 min. All scans were performed on a microPET/CT Inveon scanner (Siemens Medical Solutions, Inc., Knoxville, USA).
Marker displacement correction
Displacement of the tracking markers on the subject skin is detected by measuring the relative distance between markers (figure 3(a)). Therefore, this method requires the use of 2 or more markers. In the point source tracking method, 3 or more markers (point sources) are used. Considering  markers, and their positions measured throughout the entire scan, the distances
  (
( ) between every marker are calculated at every tracking frame (
 ), with
  the number of 2 combinations with
  elements. If no markers displacement occurs, distances
  should remain constant (within the measurement noise) throughout the scan. Displacement of a marker(s) is assumed if any
  deviates from a stable value (figure 3(b)). We perform clustering on
  (one point per frame
  ) to detect the discrete set of markers configurations that can occur due to their displacement on the skin. We use
  -means clustering on the
  -dimensional vector
  to determine the
  different clusters, i.e. assigning every frame
  to one of the
  configurations the markers can have due to displacement (figure 3(c)). The elbow method (Syakur et al
2018) can be used, for example, to calculate the optimal number of clusters.
configurations the markers can have due to displacement (figure 3(c)). The elbow method (Syakur et al
2018) can be used, for example, to calculate the optimal number of clusters.
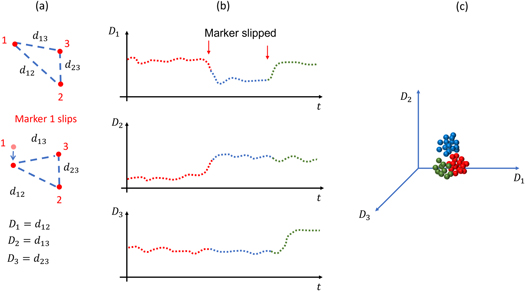
Figure 3. (a) A configuration of 3 markers is shown, indicating all the possible distances between markers. After displacement of marker 1,  and
and  change. (b) Time progression of the 3 distances between markers. The first marker displacement, indicated with the red arrow, corresponds to panel (a), in which
  and
and  change. A second marker displacement occurs later, in which marker 2 slips, changing
  and
and  (c) Points
  i.e. vector of distance between markers for every frame, are plotted showing 3 different clusters corresponding to the 3 different markers configurations created due to marker displacement. Points in panel (c) correspond in color to points in panel (b).
Download figure:
Standard image High-resolution imageOnce every tracking frame has been assigned to a specific  cluster, we perform a motion corrected reconstruction considering only the data corresponding to the frame poses within the
  cluster, creating
  different brain motion corrected reconstructions. This reconstruction is performed with less iterations than a regular reconstruction (2 iterations instead of 16, with 16 subsets per iteration), to obtain a smoothed image and to accelerate processing time. Finally, an arbitrary
  reconstruction is defined as the reference, and the rest of the reconstructions are rigidly aligned to the reference, obtaining transformation
  to correct all tracking poses within cluster
  The reference can be selected as the image from the cluster with the largest percentage of data to have a reference image with lower noise. The rigid alignment is performed using only the brain image (cropped in a predefined, fixed, box size), and therefore the markers information do not interfere with the transformation. For the point source tracking, point sources are masked from the image before alignment. For the rigid alignment we use image correlation as the similarity metric and downhill simplex optimization with reflection, expansion, contraction, and shrinkage constants of 1.0, 2.0, 0.5 and 0.5, respectively, and maximum difference in translation and rotation parameters of 0.05 mm and 0.05°, respectively, at the optimum simplex.
If a cluster has a small percentage of frames from the entire data, the motion corrected reconstruction will be noisy and therefore the rigid reconstruction can be compromised. To avoid this situation, a limit on the minimum amount of data a cluster must have can be defined. Clusters with data below this limit can then be added to the closest cluster from the  -means calculation. From our data, clusters with data corresponding to a duration of 10 s presented large amount of noise, but their rigid registration still performed accurately. Therefore a limit of clusters with at least 10 s of data can be stablished, for example.
Correction for residual translation tracking errors
In addition to tracking errors related to the tracking hardware, such as marker displacement errors, tracking errors can occur due to noise on the tracking data or inaccurate motion calculation. To correct for displacement tracking errors we use the projection data and the image reconstructed with the erroneous tracking information. Therefore this method can be used to correct tracking information from any tracking method. Initially we crop the head from the motion corrected reconstruction and we define a sphere enclosing the brain. For mouse and rat scans we consider a sphere with 7 and 11 mm radius, respectively. For every tracking frame  we filter out all lines of response (LORs) falling outside the head sphere. With the remaining LORs, we calculate the forward projection of these LORs through the masked motion corrected reconstruction of the brain and sum these values. This LORs forward projection sum (LORS FP) is maximized with respect to the 3 orthogonal translation directions by performing a line search optimization, i.e. translating the LORs in small steps and calculating the LORs FP until a maximum is found. The LORs FP is a metric that serves as an indication of how well the LORs overlap the brain image. If the LORs displacement error is large, the LORs FP will be small. Finally, a correction transformation for translation
  for every frame is obtained. We filter
  using a Gaussian filter with σ = 100 ms. For the point source tracking method, we additionally mask the point sources LORs before calculating the LORs FP. This step is not necessary for other tracking methods.
To show the behavior of the LORs FP metric with respect to translation errors in short time frames, we performed a simulation using motion-free data. The brain of a mouse scan performed under anesthesia (motion-free) using [18F]SynVesT-1 was cropped and the LORs in a frame of 32 ms from the beginning of the scan were extracted. After considering LORs intersecting the head 7 mm radius sphere, 660 LORs remained. These LORs were translated in steps of 0.03 mm, from −3 to 3 mm, and the LORs FP metric was calculated at each position in the 3 orthogonal axes. Figure 4 shows the plot of the metric in the 
 and
and  axes. All maxima was close to the ground-truth value zero, with a maximum error in the
  axis of −0.27 mm. This values is about 3 times smaller than the image voxel size (0.78 mm).
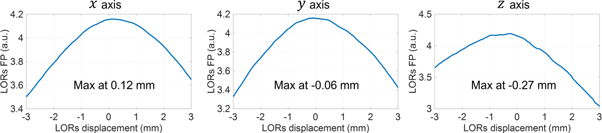
Figure 4. LORs forward projection metric calculated from a motion-free scan, plotted for LORs translated in the 3 orthogonal axes. Maxima of the metric is indicated. Ground-truth position is zero.
Download figure:
Standard image High-resolution imageRigid motion correction reconstruction
Awake scans are reconstructed with ordered subsets list-mode event-by-event motion correction reconstruction (Rahmim et al
2008) (16 subsets, 16 iterations), with motion dependent and spatially variant resolution modeling (Miranda et al
2020). Attenuation LORs precorrection is performed by calculating the body outline from the activity image (Angelis et al
2013), and assigning a constant linear attenuation coefficient of water to the whole body. Images had a size of 128  128
128  159 voxels (0.776
  0.776
0.776  0.796 mm) in the
 and
and  dimensions, respectively.
Three sets of images were reconstructed, with 3 different motion tracking data: (i) using the 'raw' uncorrected tracking data from the point source tracking, (ii) using tracking data corrected for marker displacement (transformed with  ), and (iii) using tracking data corrected for marker displacement and residual translation errors (transformed with
  and
and  ). These reconstructions are referred as MC (motion corrected reconstruction), MC-DC (with marker displacement correction), and MC-DCT (with marker displacement and residual translation errors correction), respectively. Therefore, having head motion tracking poses
  and a reference pose
  LORs in every frame
  are corrected for motion with transformations
 and
and  for MC, MC-DC, and MC-DCT, respectively.
Image processing and improvement in quantification
Initially, the brain was manually cropped from the reconstruction. The brain image was then non-rigidly aligned to the template of the corresponding tracer and species (figure 5). Using the brain regions delineated in these templates, regional uptake was quantified to calculate the contrast between a hot and cold region. For mice scanned with [18F]FDG, the ratio between thalamus (hot) and septum (cold) mean activity was calculated whereas for mice scanned with [18F]SynVesT-1, the ratio between superior colliculus (hot) and caudate putamen (cold) was determined. For rats scanned with [18F]FDG the ratio between visual cortex (hot) and septum (cold) was used.
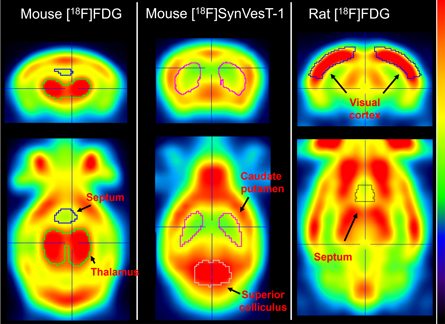
Figure 5. Brain templates of the tracers used. Regions used to calculate the image contrast are shown. Hot regions are denoted in red whereas green and yellow areas represent cold regions.
Download figure:
Standard image High-resolution imageIn addition, the image enhancement metric (Gopikakumari 2013) (IEM) was calculated. This metric represents the improvement in contrast and sharpness of an image relative to a reference. A value larger than one indicates image enhancement. We consider the MC image as reference, and the IEM was determined for MC-DC and MC-DCT.
Finally, for dynamic [18F]SynVesT-1 we extracted regional time activity curves (TACs) in cortex, caudate putamen, thalamus and hippocampus, to observe the improvement in noise on the curve after corrections have been applied.
Results
Tracking data
Using the elbow method, the optimal number of clusters was 11  0.81 for all animals. Figure 6(a) shows an example of the distances between 3 markers and the change due to displacement in the tracking data of a rat head. Clusters of frames calculated with k-means are shown in different colors. The maximum change in distance between markers was about 6 mm. Figures 6(c), (d) show the translation and rotation tracking data, without and after correction for marker displacement. In rat scans, the difference in the translation directions and rotation angles, between tracking data before and after correction for marker displacement, was 0.38
  0.62 mm and 1.7
  1.9° respectively. After applying correction for residual translation tracking errors on data corrected for marker displacement, the correction value was 0.21
  0.18 mm.
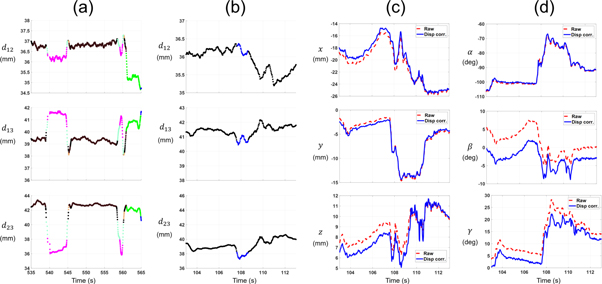
Figure 6. (a) Distances between 3 markers in a rat head tracking scan. Frames clustered together, i.e. with similar distances between markers, are shown in the same color. (b) Distances between 3 markers in the same time range as for plot (c) and (d) showing 2 different clusters. (c) Translation tracking data of a rat head, plotted without (raw) and with correction for marker displacement. (d) Head tracking Euler rotation angles without (raw) and with correction for marker displacement.
Download figure:
Standard image High-resolution imageIn mouse head tracking scans, the difference in the translation directions and rotation angles, between tracking data before and after correction for marker displacement, was 0.37  0.4 mm and 1.9
  1.1° respectively. After applying correction for residual translation tracking errors on data corrected for marker displacement, the maximum correction value was 0.52
  0.2 mm.
Computation time of the marker displacement correction was around 5 min for a 30 min [18F]FDG scan, while for translation tracking errors correction took around 15 min, on an Intel i9 3.3 GHz PC with 10 cores. This represents only about 5% of the entire pipeline processing time.
Image quality
Figure 7(a) shows the average of the MC, MC-DC, and MC-DCT reconstructions for mouse brains with tracers [18F]FDG and [18F]SynVesT-1, and for rats with [18F]FDG. In both mice and rats, for all tracers, there was a reduction in the activity in the cold regions, and increased activity in hot regions, from MC to MC-DC, and from MC-DC to MC-DCT (indicated with arrows in figure 7(a)). For example, septum activity (cold region), in both mice and rats scanned with [18F]FDG, was reduced in MC-DT in comparison to MC, while thalamus activity (hot region) was largest in MC-DCT and lowest in MC. Profiles through the indicated dotted lines in figure 7(a) are shown in figure 7(b). In all cases, profiles peaks at the center of the brain increased from MC to MC-DC, and from MC-DC to MC-DCT. In valleys close to the edge of the brain, activity was lower in MC-DCT compared with the other reconstructions.
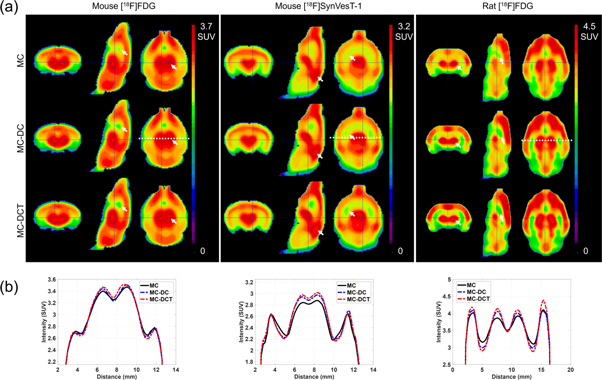
Figure 7. (a) Average brain reconstructions for MC (top row), MC-DC (middle row), and MC-DCT (bottom row), for all animals and tracers. Arrows indicate visible differences in activity change. (b) Profiles through the white dotted lines plotted in (a) (shown in middle row but plotted for upper and bottom row reconstructions as well). MC: motion corrected reconstruction, MC-DC: with marker displacement correction, MC-DCT: with marker displacement and residual translation errors correction.
Download figure:
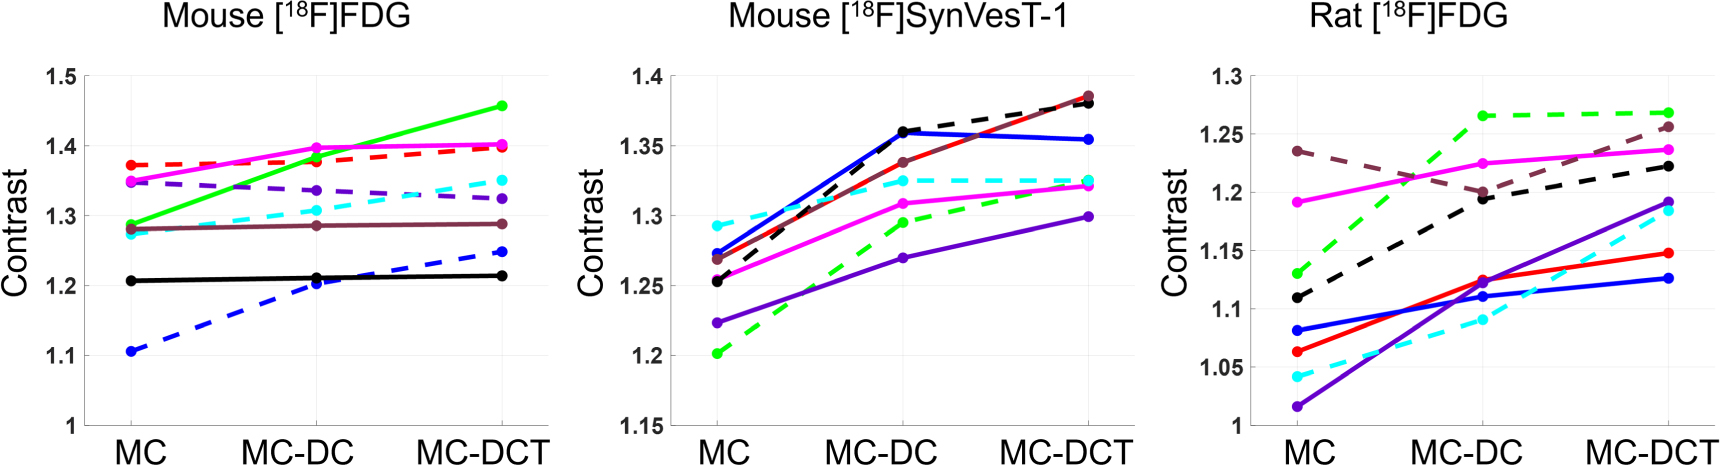
Standard image High-resolution imageFigure 8 shows the contrast values for the individual mice and rats, using both tracers, in MC, MC-DC, and MC-DCT reconstructions, while average values are shown in table 1. For mice scanned with [18F]FDG, for 3 mice there was a minimal increase in contrast in MC-DC and MC-DCT compared with MC (less than 1%), while for one mouse the contrast decreased (less than 1%) after corrections. For the rest of the mice the increase in contrast from MC to MC-DC was 2.84  3.6%, while from MC to MC-DCT was 4.68
  5.7%. In all mice scanned with [18F]SynVesT-1 there was an improvement in contrast after corrections. From MC to MC-DC, the increase was 5.6
  2.0%, and from MC to MC-DCT 7.43
  2.8%. For rats scanned with [18F]FDG, from MC to MC-DC the contrast was increased 5.40
  4.7%, while from MC to MC-DCT 8.87
  5.4%. Only in one rat the contrast was reduced from MC to MC-DC (3%).

Figure 8. Contrast in MC, MC-DC, and MC-DCT reconstructions for all animals in all tracers. Contrast is calculated using the ratio of activity between hot and cold regions indicated for each species and tracer in figure 5. MC: motion corrected reconstruction, MC-DC: with marker displacement correction, MC-DCT: with marker displacement and residual translation errors correction.
Download figure:
Standard image High-resolution imageTable 1. Average contrast values for motion corrected (MC), with additional markers displacement correction (MC-DC), and with additional marker displacement and translation errors correction (MC-DCT), for all animals in all tracers. Average image enhancement metric (IEM) considering MC as reference, for MC-DC and MC-DCT.
| Average contrast | Average IEM | ||||
|---|---|---|---|---|---|
| MC | MC-DC | MC-DCT | MC-DC | MC-DCT | |
| Mouse [18F]FDG | 1.28  0.088 0.088 | 1.31  0.076 0.076 | 1.34  0.083 0.083 | 1.01  0.020 0.020 | 1.02  0.027 0.027 |
| Mouse [18F]SynVesT-1 | 1.25  0.029 0.029 | 1.32  0.031 0.031 | 1.34  0.034 0.034 | 1.03  0.024 0.024 | 1.05  0.024 0.024 |
| Rat [18F]FDG | 1.11  0.074 0.074 | 1.17  0.063 0.063 | 1.20  0.051 0.051 | 1.03  0.032 0.032 | 1.05  0.046 0.046 |
The IEM (table 1) in mice brain reconstructions with [18F]FDG was lower than 1 only for one mouse in MC-DC, but larger than 1 in average. For MC-DCT the IEM increased compared with MC-DC. For mice with [18F]SynVesT-1 the IEM for MC-DC was 1.03  0.02, and increased 2% for MC-DCT. For rats with [18F]FDG the IEM was 1.03
  0.03 for MC-DC, and increased 2% for MC-DCT.
Time activity curves
Figure 9 shows the TACs of four brain regions in 2 mice, for MC, MC-DC, and MC-DCT. Compared with MC, noise is reduced in MC-DC TACs, showing a more stable profile in the decaying part of the curve (after 10 min). Overall activity in the cold region caudate putamen is reduced in MC-DC compared with MC, while in the hot region thalamus overall activity is increased. These effects are observed further in MC-DCT reconstructions compared with MC and MC-DC.

Figure 9. Time activity curves in 4 brain regions, for 2 mice scanned with [18F]SynVesT-1, in motion corrected images (MC), with additional markers displacement correction (MC-DC), and with additional marker displacement and translation errors correction (MC-DCT).
Download figure:
Standard image High-resolution image
Discussion
In PET brain motion correction, the displacement on the skin of the markers used to track the motion of the animal head produces inaccurate motion tracking data. The method developed here corrects the tracking data for this displacement. In addition, we correct for small magnitude translation tracking errors which can be present after marker displacement correction. Both corrections applied in the motion tracking data improved the image contrast and quality in brain motion corrected reconstructions of awake mice and rats. Noise in time activity curves was also improved.
Displacement of the markers on the animal skin is detected by measuring changes in the distance between markers throughout the scan. This information is then used to define time periods within which no marker displacement occurred. Although the same change in markers displacement can be produced by different combinations of movements between the markers, we assume the markers can only move within certain patterns, restricted by the limited flexibility of the skin and the limited orientations of head movement. Therefore, there exists only a limited number of markers configurations due to displacement. The case in which all markers displace in the same direction cannot be detected by the used method, but this is unlikely to happen if markers are placed with sufficient distance between them.
Depending on how the head pose is calculated from the markers, displacement of the markers can produce change in the translation and/or rotation of the pose. Particularly for the point source tracking, in which translation is calculated from change in the centroid of the point sources, displacement of one marker biases the translation in the direction of the displacement. In rat experiments we observed this bias in centroid displacement to have a maximum of about 4 mm, and 2.5 mm for mice experiments. In the pose rotation (Euler angles), displacement of the markers also biases the rotation in the direction of the marker displacement. This bias had a maximum of 7° and 9°, for rats and mice experiments respectively. The larger bias in mice compared with rat rotation tracking is caused by the closer proximity of the point sources in the mouse head, compared to the rat head. The same displacement of a marker in the perpendicular direction to the vector connecting the marker to the markers centroid, produce a larger arc (with respect to the centroid) if the marker is closer to the centroid compared to when it has a longer distance to the centroid. The larger arc corresponds to larger rotation bias.
Although we have no ground truth measurement of the marker's positions on the animals' heads, we evaluated the accuracy of the correction observing the image quality of motion corrected reconstructions using the corrected tracking data. Since using inaccurate motion tracking data translates in a blurred brain image, evaluation of the image quality improvement is a good indication of improvement in the tracking data accuracy as well (Spangler-Bickell et al 2016). It can also occur that the marker displacement is minimal (e.g. due to limited animal motion), and therefore little improvement is observed after the correction is performed.
In mice [18F]FDG scans, contrast and IEM is improved using tracking data corrected for marker displacement, in all but one mouse scan. Since the marker displacement correction relies on the image registration of the brain, the inaccurate correction can occur if the brain registration is also inaccurate. This can be caused, for example, if the brain cropping contains activity external to the brain, which can bias the registration, or if the activity pattern has a large change over time. Nevertheless, since we used a smoothed image for the image registration, and given the small size of rodent brains, changes in activity patterns should minimally affect the image registration. This can be observed in mice dynamic [18F]SynVesT-1 scans, in which the brain activity in the initial minutes after injection is uniform throughout the brain, and changes to the specific regions binding over time (Miranda et al 2023). Noise in the cluster frames used for registration can also cause an inaccurate correction. This can occur if a small number of frames are clustered together. In [18F]SynVesT-1 scans we observed an improvement in contrast and IEM after marker displacement correction for all mice. In rat [18F]FDG scans, we also observed improvement in image contrast and IEM in all but one rat scan. Overall, the method is robust enough to correct marker displacement errors in the tracking data.
Correction for residual translation tracking errors also showed to improve the motion tracking data accuracy by improving the image quality. In simulation experiments using mouse brain static PET data optimization of the LORs FP metric could serve to detect sub-millimetric displacement errors in frames of 32 ms, using around 700 LORs (i.e. LORs remaining after discarding those outside the head sphere) in the forward projection. In these simulations, detection of rotation tracking errors was also investigated, but with unsatisfactory results. Since there can be rotational symmetry on the brain image, and given the low statistics of every tracking frame, multiple maxima can be present in the LORs FP metric considering optimization of the rotation angles.
The correction for residual translation tracking errors was applied after correction for marker displacement. This correction can be performed directly without other corrections, but if large rotation errors are present in the tracking data, correction for translation error can be biased. For example, given that for this correction the overlap between LORs and the uncorrected image is optimized, if the LORs are rotated with respect to the uncorrected image, the overlap measurement will be inaccurate. However, large translation errors can still be corrected with this method, if rotational errors are not large.
Improvement in contrast and IEM was observed in mice [18F]FDG scans after residual translation tracking errors correction in all but one mouse. Inaccurate correction can be caused if the blurriness in the reference, uncorrected, image is too high, causing the LORs FP metric to also be smoothed. In addition, if the number of LORs in the frame is too low, the LORs FP can present high noise as well. This can be solved by increasing the frame time size, at the expense of losing resolution in time. [18F]SynVesT-1 dynamic scans served to test the method when the activity intensity and pattern change over the course of the scan. For these scans, improvement in contrast and IEM was observed in all but one mouse after correction for translation tracking errors. Therefore, the LORs FP metric is a robust metric for the overlap of LORs and the image even after change in tracer activity and uptake pattern.
In rat [18F]FDG scans, there was an increase in contrast and IEM for all scans, after correction for residual translation tracking errors. Compared to mice scans, the improvement after translation tracking errors correction is higher in rats scans. Due to the larger rat brain size, the overlap (LORs FP) metric can be more accurately calculated, producing better improvement. Variability in contrast was also reduced from MC to MC-DCT. Depending on the type of study, this could translate into a higher statistical power, reducing the number of animals needed to detect a statistical difference.
Noise in time activity curves from dynamic scans also improves after applying marker displacement correction, with further improvement after applying correction for residual translation errors. Particularly for small brain regions quantification, finer residual errors can deteriorate the quantification since the brain region can be mispositioned after motion correction. Therefore, for scanners with better spatial resolution than the one used in our experiments, accurate motion tracking calculation becomes more important. For kinetic modeling a time activity curve with lower noise translates into calculation of pharmacokinetic parameters with higher accuracy (Sun et al 2022).
The corrections developed here depend on the brain activity to be calculated, i.e. brain image registration or forward projection of the brain LORs in a brain image. Therefore, in frames with low brain activity the corrections might underperform. Nevertheless, in all scans performed in our study we did not observe inaccurate corrections calculation, including in dynamic [18F]SynVesT-1 scans, in which relatively low brain activity is observed at the beginning of the uptake period and at the end of the scan. However, a limit on the number of LORs, either to calculate the cluster image for marker displacement correction, or to calculate the LORs FP for residual translation errors correction, can be defined to omit the correction for that portion of the data.
After performing these corrections, errors in the tracking data can still remain. This can be observed when comparing motion-free reconstructions from anesthetized animals (data not shown) with motion corrected reconstructions after all corrections, which usually present, to some extent, lower image quality in comparison. Future work involves investigating the source of these differences, which apart from inaccuracies in the motion tracking data, can be caused by the difference in the reconstruction methods used (motion correction reconstruction (Rahmim et al 2008) versus motion-free reconstruction). Finally, extension of the marker displacement correction will be investigated for markerless tracking methods that can also be affected by deformation of the rodent head. For example in structured light motion tracking (Miranda et al 2017a) in which the 3D model of the rat head can change due to flexibility of head parts such as ears and nose. Different models can be defined, for instance, depending on the discrete positions of these head parts.
Conclusion
We developed a method to correct motion tracking errors caused by the displacement of markers on the subject skin. In addition, a method to correct residual translation tracking errors was developed. Both corrections improve the contrast and image quality of motion corrected reconstructions of awake mice and rats.
Acknowledgments
AM is supported by the ERA-NET NEURON project SleepLess supported by BMBF (01EW1808) and FWO under the frame of Neuron Cofund, and by a Research Project (G0A8517N) from the Research Foundation Flanders (FWO). We thank Phillippe Joye, Caroline Berghmans, Eleni Van der Hallen, and Annemie Van Eetveeldt for their assistance and technical support.
Data availability statement
All data that support the findings of this study are included within the article (and any supplementary information files). Derived data supporting the findings of this study are available from the corresponding author on request.