

Abstract
Objective. In this paper, we focus on the dielectric and mechanical characterization of tissue-mimicking breast phantoms. Approach. Starting from recipes previously proposed by our research group, based on easy-to-handle, cheap and safe components (i.e. sunflower oil, deionized water, dishwashing liquid and gelatin), we produced and tested, both dielectrically and mechanically, more than 100 samples. The dielectric properties were measured from 500 MHz to 14 GHz, the Cole–Cole parameters were derived to describe the dielectric behaviour in a broader frequency range, and the results were compared with dielectric properties of human breast ex vivo tissues up to 50 GHz. The macroscale mechanical properties were measured by means of unconfined compression tests, and the impact of the experimental conditions (i.e. preload and test speed) on the measured Young's moduli was analysed. In addition, the mechanical contrast between healthy- and malignant-tissue-like phantoms was evaluated. Main results. The results agree with the literature in the cases in which the experimental conditions are known, demonstrating the possibility to fabricate phantoms able to mimic both dielectric and mechanical properties of breast tissues. Significance. In this work, for the first time, a range of materials reproducing all the categories of breast tissues were experimentally characterized, both from a dielectric and mechanical point of view. A large range of frequency were considered for the dielectric measurements and several combinations of experimental conditions were investigated in the context of the mechanical characterization. The proposed results can be useful in the design and testing of complementary or supplementary techniques for breast cancer detection based on micro/millimetre-waves, possibly in connection with other imaging modalities.
Export citation and abstract BibTeX RIS
1. Introduction
Breast cancer is one of the leading causes of death among women worldwide. Currently, many imaging systems are available for the diagnosis of this disease (e.g. x-ray mammography, ultrasound, magnetic resonance imaging); however, their limitations are pushing the search for new imaging modalities. In recent years, microwaves and millimeter waves have been gaining increasing interest as a possible complementary or supplementary technique for the diagnosis of breast cancer and promising results have been published so far (Burfeindt et al 2009, Klemm et al 2009, Nikolova 2011, Grzegorczyk et al 2012, Fear et al 2013, Bahramiabarghouei et al 2015, Di Meo et al 2017, 2021). The physical basis of these imaging systems is the dielectric contrast between healthy and diseased tissues, as demonstrated by several experimental campaigns up to 50 GHz (Lazebnik et al 2007a, 2007b, Martellosio et al 2017, Di Meo et al 2018, Summers et al 2019). However, it was also experimentally shown that healthy and diseased tissues have different mechanical properties (Samani et al 2007). Exploiting this intrinsic feature of tissues, it is therefore possible to think about combined imaging systems, in which the dual dielectric and mechanical information is used to increase the reliability of diagnostic results in doubtful cases, which are likely in the presence of both diseased and healthy high-density tissues.
Indeed, the interest towards multimodal imaging is a hot topic in the scientific community, being usually the key to overcome the limitations of diagnostic techniques exploiting only one information. As a consequence, several solutions for multimodal phantoms are being proposed (Mojabi and Lo Vetri 2019, Ruvio et al 2020, Li et al 2021), usually focusing the attention, for what concerns microwaves, on the lower spectrum of the microwave frequencies (a few GHz), sometimes using toxic components. In Ruvio et al (2020), as an example, the authors proposed a multi-modal anthropomorphic breast phantom, involving five different tissue-mimicking materials, suitable for several imaging modalities like ultrasound, MRI, CT, x-ray mammography and microwave imaging. The dielectric characterization of these materials was carried out in the 0.5–4 GHz frequency range. Similar frequencies (1–4 GHz) were used in another work combining dielectric and mechanical characterization of simple oil-in-gelatin phantoms, with different percentages of grape seed oil. Mechanical characterization, in this case, was conducted using a press equipped with a 50 N load cell and the compression tests were carried out with a test speed of 1 mm min−1 up to 20% strain level (Henin et al 2015). In Li et al (2021), instead, dielectric and acoustic breast tissue-mimicking phantoms are presented. Also in this paper dielectric properties were measured in a small frequency range, between 0.2 and 6 GHz. On the other hand, the development of bi-modal breast phantoms, able to mimic both dielectric and mechanical properties of the human breast tissues, is poorly documented in literature.
A broad review of phantom mimicking dielectric properties of human breast tissues have been proposed in Di Meo et al (2019), and in addition to the abovementioned works, recently (Islam et al 2018) fabricated two kinds of phantoms, i.e. homogenous (composed by distilled water, polyethylene powder, agar and sodium chloride) and heterogeneous (based on the use of distilled water, safflower oil, propylene glycol, agar, formalin and detergent) with four layers of tissues and characterized them between 3.1 and 10.6 GHz. From a mechanical point of view, a broad range of different approaches that can be exploited to measure or derive the mechanical properties of biological tissues have been investigated. Some characterization works have been carried out on in vivo and ex vivo human breast tissues (Krouskop et al 1998, Wellman et al 1999, Matsumura et al 2009, Umemoto et al 2014), others on tissue-mimicking phantoms (Henin et al 2015, Kelly et al 2018).
Specifically, in Krouskop et al (1998), through an analysis conducted on 142 specimens from healthy (fat, fibrous and glandular) and tumor (ductal carcinoma in situ and infiltrating ductal carcinoma -IDC-) tissues, the authors demonstrated that healthy fat tissues exhibit a lower elastic modulus than healthy fibro-glandular tissues, and that these are less rigid than neoplastic ones. In addition, they showed that, as the strain level increases, the elastic modulus of healthy fat tissues is almost constant (18 ± 7 kPa with 5% pre-compression, 20 ± 8 kPa with 20% pre-compression), while a remarkable difference is observed for IDC (106 ± 32 kPa with 5% pre-compression, 558 ± 180 kPa with 20% pre-compression). In Wellman et al (1999), almost the same conclusions were derived. In particular, it was shown that IDC is up to 10 times and more than 2.5 times stiffer than normal fat and glandular tissues, respectively, at 1% strain, while it is more than 70 times and nearly 5 times stiffer at 15% strain. In Matsumura et al (2009), the authors measured 87 healthy and diseased breast samples derived from 47 individuals. Mechanical compression was conducted at a test rate of 1 mm min−1 up to 30% of strain was considered. The authors showed that for a stress range of 0.2–0.4 kPa, Young's moduli of healthy fat and glandular tissues assume the same values of 2.4 ± 0.6 kPa, whereas IDC tumor tissues have a Young's modulus of 13.6 ± 7.5 kPa, i.e. a higher mean value and a greater variability. In Umemoto et al (2014), samples derived from 30 patients with breast lesions were mechanically characterized at a test speed of 1 mm min−1 and their Young's modulus, for a stress range of 0.2–0.4 kPa, ranged from 2.60 kPa for fat tissue to 16.08 kPa for invasive carcinoma.
As far as phantoms are concerned, in Henin et al (2015), the authors presented the mechanical characterization of breast fat and tumor tissue phantoms based on gelatin, water, grape seed oil, propylene glycol and commercial dishwashing liquid. Mechanical properties were measured for test speeds of 1 mm min−1 up to a strain level of 20% at room temperature. The average Young's modulus for samples mimicking healthy tissues was 3.25 kPa, while for those mimicking tumor tissues it was 42.5 kPa. In Kelly et al (2018), a heterogeneous phantom, based on whole milk, gelatin and cellulose, was used to test a multi-modal imaging tool based on elastography, ultrasound, and photoacoustic tomography. A stiffer (elastic modulus = 32.3 ± 0.3 kPa) tumor-like inclusion was embedded in the phantom background (elastic modulus = 17.5 ± 0.1 kPa). The experimental measurement conditions in this case were not specified. In addition, in Ismai et al (2017), a strain up to 15% was considered and the mechanical properties of phantoms made by agar, silicone and gelatin were tested at a test speed of 0.5 mm min−1 and using three different preloads, i.e. 0.05 N, 0.1 N and 0.2 N. The mechanical properties of phantoms mimicking skin, adipose and malignant tissues were measured, and Young's moduli from 17 ± 3 kPa to 85 ± 19 kPa for adipose and tumor-like gelatin-based phantoms were achieved at 5% strain, respectively.
Although all these works clearly show that the mechanical properties of healthy and diseased tissues are significantly different, the reported values of the Young's moduli do not agree, even when referred to the same tissue. One of the main factors influencing this variability is the absence of clear indications about the adopted experimental conditions and their impact on the measured mechanical properties, making a fair comparison almost impossible, even when the same measurement technique is used.
In this work oil-in-gelatin phantoms were considered, as they only involve low-cost, easy-to-handle and safe materials (Di Meo et al 2019). Specifically, they are based on water, sunflower seed oil, dishwashing liquid, and gelatin. The dielectric data of the produced phantom in a larger frequency range, reaching greater values for further applications, possibly in the mm-wave range and not only in the microwave spectrum, is provided.
Moreover, to fill the literature gap on the impact of the experimental conditions on the mechanical tests, as well as to make them both reproducible and comparable, in this work, several combinations of experimental conditions (i.e. pre-load and test speed) are evaluated, together with their impact on the measured data. In particular, a systematic analysis of the impact of measurement conditions, such as preload and test speed, on the measured mechanical properties of specimens is provided. In our analysis, a 5% of strain is considered and all results are referred to the same strain percentage to allow a comparison with (Ismai et al 2017).
Starting from the phantom recipes recently proposed by our group (Di Meo et al 2019) to mimic the dielectric properties of breast tissues, in this work we have designed new mixtures in order to mimic also the mechanical properties of breast. In particular, we measured the stress–strain curves of 693 samples derived from 231 tissue-mimicking breast phantoms during mechanical tests under different experimental conditions; we focused on the range 0%–5% of strain. The dielectric permittivity of the samples was measured up to 14 GHz, fitted with the Cole–Cole model and compared with the dielectric properties of human breast ex vivo tissues up to 50 GHz (Di Meo et al 2018).
In addition, the elastic contrasts between the tumor-like tissue-mimicking materials and two different categories of healthy-like phantoms (i.e. fat- and fibroglandular-like tissue-mimicking materials), for seven experimental conditions are presented. This information (in particular the mechanical contrast between high-density healthy tissues and neoplastic ones), indeed, could be of fundamental importance in the resolution of diagnostic doubtful cases to reduce the percentage of false positives and false negatives, being in some cases even more important than knowing the absolute value of the Young's moduli of the individual phantoms or tissues.
The literature related to the calculation of mechanical contrasts between different breast tissues is vast (Sarvazyan et al 1995, Krouskop et al 1998, Wellman et al 1999, Manduca et al 2001, Srivastava et al 2011), although the results of the investigations are often provided without details on the measurement conditions, making a clear comparison difficult. In particular, in Krouskop et al (1998), it has been demonstrated that at a 5% of pre-compression strain, the contrast between neoplastic and adipose ex vivo tissues was 6, while the contrast between IDC and healthy fibroglandular tissues was 1.1 at the same strain level. In Wellman et al (1999), at 5% of strain, contrasts from 8 to 18 were achieved when the ratios between tumour (i.e. papilloma, lobular carcinoma, fibroadenoma and IDC) and adipose ex vivo tissues were considered, while values from 1.7 to 3.5 were achieved when the ratios between tumour and glandular ex-vivo tissues were considered. In Srivastava et al (2011), a mechanical contrast of 4 was shown between malignant and normal adipose ex vivo tissue, without specifying the strain level at which this ratio was computed.
Finally, for the first time, this work introduced a large variety of phantoms (11 several materials), able to mimic two physical properties of all the categories of human breast tissues, making possible the future test of combined imaging systems, as an example, relying on microwave and ultrasounds.
This paper is organized as follows. In section 2, the phantom recipes, the experimental setup and configurations for dielectric and mechanical characterization tests are presented. In section 3, the impact of gelatin on both dielectric and mechanical properties, as well as the mechanical contrasts between healthy- and malignant-tissue-like phantoms are shown. Then, some conclusions are drawn in section 4.
2. Materials and methods
2.1. Phantom recipes
All phantoms were produced following the procedure detailed in Di Meo et al (2019), which, for brevity, is not reported in this paper. All mixtures were based on low-cost, non-toxic and easy-to-handle components: deionized water, sunflower seed oil, dishwashing liquid, and gelatin. As shown in Ismai et al (2017), small percentages of gelatin do not have a significant impact on the variation of dielectric properties of the produced mixtures. However, a slight increase in the percentage of gelatin is not enough to reproduce the mechanical properties of breast tissues (Cannatà et al 2021). Therefore, in this paper, the recipes proposed in Di Meo et al (2019) have been modified to mimic the mechanical properties of breast tissues, both healthy and diseased. Specifically, the amount of gelatin was considerably increased and both the dielectric and mechanical properties of the resulting phantoms were measured. In particular, the volume percentage of gelatin was increased to the point where either the mixture was no longer able to mix and solidify, or the dielectric properties of the produced mixture fall below one standard deviation of human breast ex-vivo tissues from the average value. The first scenario occurs in phantoms mimicking fatty tissues, where the volume percentage of water is too low to allow the mixture to solidify; whereas, the second scenario involves phantoms mimicking neoplastic tissues, where the percentage of gelatin required to increase the stiffness of the samples is particularly high.
Table 1 shows all the phantoms produced with the corresponding ingredients quantities. The acronyms in the first column refer to the volume percentage of gelatin (G) and sunflower oil (O) in the mixture. The total volume considered to compute the percentages reported in the acronyms was given by the overall amount of water and oil. For example, G3.3O66.6 indicates that the volume percentage of gelatin and oil are 3.3% and 66.6%, respectively.
Table 1. Composition of phantom mixtures.
| Mixture | Mimicked breast tissue (Di Meo et al 2018) | Deionized water (ml) | Gelatin (g) | Sunflower oil (ml) | Dishwashing liquid (ml) |
|---|---|---|---|---|---|
| G3.3O66.6 | Low-density | 68 | 6.8 | 136 | 3.8 |
| G4.9O66.6 | Low-density | 68 | 10 | 136 | 3.8 |
| G5O50 | Medium-density | 68 | 6.8 | 68 | 3.8 |
| G7.35O50 | Medium-density | 68 | 10 | 68 | 3.8 |
| G9.55O50 | Medium-density | 68 | 13 | 68 | 3.8 |
| G6.6O33.3 | High-density | 68 | 6.8 | 34 | 3.8 |
| G9.8O33.3 | High-density | 68 | 10 | 34 | 3.8 |
| G12.74O33.3 | High-density | 68 | 13 | 34 | 3.8 |
| G8O20 | Malignant | 68 | 6.8 | 17 | 3.8 |
| G16O20 | Malignant | 68 | 13.6 | 17 | 3.8 |
| G21.17O20 | Malignant | 68 | 18 | 17 | 3.8 |
2.2. Dielectric measurement setup
The experimental setup used to measure the dielectric properties of all phantoms consisted of:
- an open-ended coaxial probe (Keysight 85070E Dielectric Probe Kit), able to provide reliable dielectric measurements in the frequency range from 0.2 to 50 GHz and for temperatures from −40 °C to 200 °C;
- a FieldFox Handheld Microwave Analyzer (Keysight N9916A, 14 GHz), able to perform measurements from 30 kHz to 14 GHz;
- an high-precision flexible coaxial cable (provided with the Keysight 85070E Dielectric Probe Kit), to connect the probe to the FieldFox Analyzer;
- a mechanical probe holder, to keep the probe position fixed for the whole measurement session;
- a mechanical mover, to put the sample and the probe in contact, avoiding any kind of undesired movement of both the probe and the coaxial cable after calibration;
- a laptop to get the dielectric measurements and process experimental data.
In figure 1, a picture of the experimental setup for the dielectric characterization of the produced phantoms is shown.

Figure 1. Experimental setup for dielectric measurements.
Download figure:
Standard image High-resolution image2.3. Mechanical measurement setup
Unconfined compression was chosen among different techniques (i.e. unconfined compression, confined compression and indentation) for measuring the mechanical properties of the phantom, as this is the most widely used technique in the literature for measuring samples of this type (Miller 2005, Akki and Arunachalam 2014, Zhou et al 2016, Ismai et al 2017). In this method, a load is applied to the sample, that is held stationary between two plates larger than the surface area subjected to the load, and a lateral deformation of the sample is allowed.
The experimental setup used for mechanical measurements consisted of:
- an electromechanical traction/compression machine equipped with precision guide columns (MTS Insight 10, MTS System Corporation);
- a load cell of 250 N maximum capacity (MTS Load Cell);
- a digital controller for fine-tuning the crosshead position;
- two aluminum compression plates: the lower one is fixed and the upper one moves in accordance with the movement of the crosshead.
In figure 2, a picture of the experimental setup used for the mechanical characterization of the produced phantoms is shown.

Figure 2. Experimental setup for mechanical measurements.
Download figure:
Standard image High-resolution imageSamples were derived from each phantom using a standard cylindrical mold with a diameter ( ) of 28 mm and a height (
 ) of 10 mm, as shown in figure 3. Both dielectric and mechanical characterizations were done on samples at room temperature (Krouskop et al
1998, Wellman et al
1999, Kruse et al
2000, Samani et al
2003, Matsumura et al
2009, Umemoto et al
2014, Qiu et al
2015, Fallahi et al
2021).
) of 10 mm, as shown in figure 3. Both dielectric and mechanical characterizations were done on samples at room temperature (Krouskop et al
1998, Wellman et al
1999, Kruse et al
2000, Samani et al
2003, Matsumura et al
2009, Umemoto et al
2014, Qiu et al
2015, Fallahi et al
2021).

Figure 3. Samples derived from the G8O20 (top) and G16O20 (bottom) phantoms, numbered to indicate the different mechanical measurement conditions under which they were tested. For both the G8O20 and G16O20 sample '1' was measured with 0.4 N preload and 2 mm min−1 test speed (PL04TS2); sample '2' was measured with 0.2 N preload and 2 mm min−1 test speed (PL02TS2); sample '3' was measured with 0.2 N preload and 1 mm min−1 test speed (PL02TS1); sample '4' was measured with 0.4 N preload and 1 mm min−1 test speed (PL04TS1).
Download figure:
Standard image High-resolution image2.4. Experimental conditions for the mechanical characterization of phantoms
The literature related to the mechanical properties of phantoms, as well as of human breast tissues, does not show clear and unambiguous guidelines for the determination of the stiffness (e.g. the Young's modulus). However, in order to properly know these properties as well as to achieve comparable results, it is fundamental to know the impact of the experimental conditions on the measurements. Consequently, in this paper, the impact of preload and test speed on the mechanical properties of phantoms is quantitatively evaluated. The test speed refers to the speed of the movable plate of the electro-mechanical press. The pre-load represents the force threshold from which the compression test formally starts. This experimental condition does not affect the mechanical response of the material under test. Indeed, it is basically a method to focus in different zones of the stress–strain curve. Specifically, mechanical measurements were made considering different combinations of preload (0.1 N, 0.2 N, and 0.4 N) and test speed (0.5 mm min−1, 1 mm min−1, 2 mm min−1) as described in table 2, in which PL stands for preload and TS stands for test speed. In Ismail et al (2017), where similar phantoms were considered, preloads of 0.1 N and 0.2 N together with a test speed of 0.5 mm min−1 were used. Thus, we started from these same values in our analysis.
Table 2. Experimental conditions for the mechanical characterization of phantoms.
| Test | Pre-load (N) | Test speed (mm min−1) |
|---|---|---|
| PL04TS2 | 0.4 | 2 |
| PL02TS2 | 0.2 | 2 |
| PL02TS1 | 0.2 | 1 |
| PL04TS1 | 0.4 | 1 |
| PL02TS05 | 0.2 | 0.5 |
| PL01TS1 | 0.1 | 1 |
| PL01TS05 | 0.1 | 0.5 |
2.5. Experimental design for the bi-modal characterization
Eleven different recipes for the phantoms creation were considered. Each of the 11 produced materials was replicated 3 times (i.e. 33 phantoms) and dielectric measurements were conducted on each of these phantoms at 3 independent points along the diagonal of the phantom for homogeneity assessment, as described in Di Meo et al (2019). Thus, 99 dielectric measurements were conducted from which the average was computed (i.e. for each of the 11 phantom types, the average was calculated over 9 dielectric curves). To ensure 3 mechanical measurements in different days per phantom type, under each of the 7 different measurement conditions, additional phantoms (not dielectrically tested) were produced. For each of the 7 experimental conditions, the average of the mechanical measurements conducted on 9 samples was calculated (3 samples from each of 3 replies per phantom type in different days). This procedure was carried out for each of the 11 phantoms produced (3 × 3 × 7 × 11 = 693 samples in total). As an example, in figure 4 an explanation is provided for a single phantom. These considerations have to be repeated for each phantom. In figure 4, D1, D2 and D3 indicate the replicates of the single phantom type on different days. S1, S2 and S3 indicate the three samples derived from each phantom.
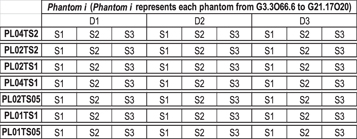
Figure 4. Schema of the mechanical measurements for each of the 11 materials.
Download figure:
Standard image High-resolution image3. Results and discussions
3.1. Dielectric properties of the produced phantoms
3.1.1. Cole–cole parameters
The dielectric properties (i.e. the dielectric permittivity  ) of the produced phantoms were measured up to 14 GHz and were described in the frequency domain using the Cole–Cole single-pole model (Gabriel 2006):
where  and
and  indicate the dielectric constant at zero and infinite frequencies, respectively,
  is the time constant,
  is the angular frequency,
  is a shape factor ranging from 0 to 1, and
  is the static conductivity.
Specifically, the Cole–Cole parameters were derived using the least squares method and their average values for all phantoms are shown in table 3. To show the quality of the fitting procedure, two extreme cases were chosen, i.e. G4.9O66.6 and G21.17O20, and the comparison between measured and fitted curves is reported in figures 5(a) and (b) for the real and imaginary part of  respectively. The Cole–Cole parameters for each of the 11 phantom types were derived by considering the average of the 3 independent measurements made on each of the 3 replicates of the phantom (as explained above). Then, for each phantom type the average between 9 measurements was made and, from this, the Cole–Cole parameters were derived.
Table 3. Cole–cole parameters of all the produced phantoms.
| Mixture | Δε | ε∞ | τ (ps) | α | σs |
|---|---|---|---|---|---|
| G3.3O66.6 | 13.73 | 1.95 | 7.5 | 0.198 | 0.055 |
| G4.9O66.6 | 11.09 | 2.06 | 5.5 | 0.315 | 0.036 |
| G5O50 | 25.9 | 4 | 8.5 | 0.13 | 0.152 |
| G7.35O50 | 20.6 | 4.2 | 9 | 0.19 | 0.09 |
| G9.55O50 | 25.82 | 0.5 | 8.05 | 0.261 | 0.1 |
| G6.6O33.3 | 35.44 | 3.61 | 8.95 | 0.095 | 0.195 |
| G9.8O33.3 | 39.18 | 2.02 | 8.61 | 0.165 | 0.171 |
| G12.74O33.3 | 37.96 | 1.03 | 8.67 | 0.195 | 0.172 |
| G8O20 | 50 | 3 | 8 | 0.08 | 0.304 |
| G16O20 | 40.85 | 7.15 | 9.1 | 0.082 | 0.313 |
| G21.17O20 | 42 | 8 | 12 | 0.1 | 0.25 |
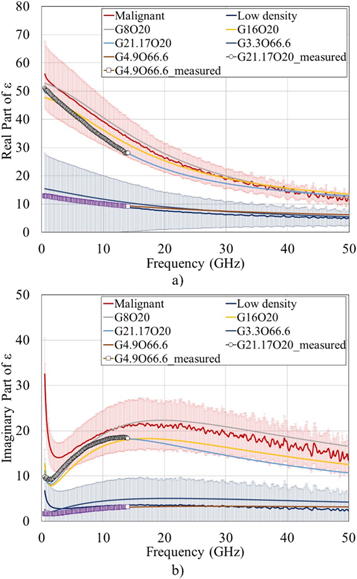
Figure 5. Comparison between the fitted dielectric properties of the produced phantoms (G3.3O66.6, G4.9O66.6, G8O20, G16O20 and G21.17O20) with the measured dielectric properties of low-density and malignant human breast ex vivo tissues (derived from [13]): (a) real part and (b) imaginary part of ε. Shaded regions indicate a standard deviation from the mean value of the dielectric properties of ex vivo tissues (derived from [13]). The dielectric properties of the produced phantoms were fitted up to 50 GHz by the Cole–Cole model. The lines with roads indicate the dielectric properties of the G4.9O66.6 and G21.17O20 phantoms measured up to 14 GHz
Download figure:
Standard image High-resolution image3.1.2. Impact of gelatine on phantom dielectric properties
The impact of gelatin on phantom dielectric properties has already been evaluated in Di Meo et al (2019) for small volumetric increases and has been shown not to drastically affect the mixture dielectric properties. However, these small increases of gelatin concentration were not enough to mimic the mechanical properties of breast tissues (Cannatà et al 2021). For this reason, in this paper, more significant increases in the gelatin volume percentage were evaluated, and the impact on dielectric properties was continuously monitored.
As an example, in figure 6, the real and imaginary part of the phantom dielectric permittivity at 6, 10 and 14 GHz as a function of the gelatin volume percentage is shown for all tissue-mimicking phantoms. These graphs show a decreasing trend of the dielectric properties of the mixtures as gelatin increases. Comparing these values with those of ex vivo breast tissue dielectric permittivity at 10 GHz, as reported in table 4, it can be observed that they are always in the range of one standard deviation from the average dielectric properties of the target tissues.
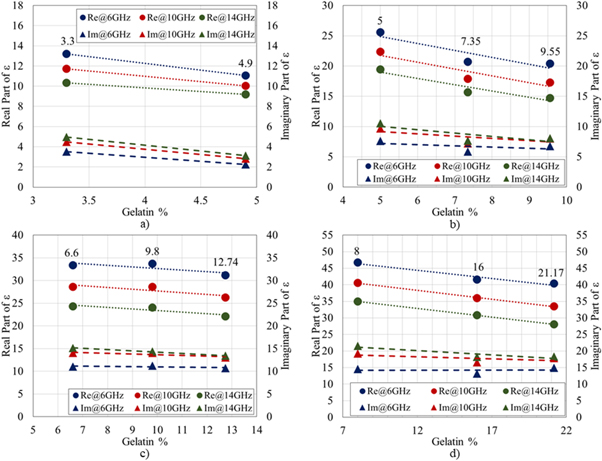
Figure 6. Trend for real (dot labels) and imaginary part (triangle labels) of dielectric permittivity at 6, 10 and 14 GHz for the 4 categories of tissue-mimicking breast phantoms-low-density (a), medium density (b), high-density (c) and malignant (d) tissue-mimicking phantoms- as a function of the gelatin volume percentage. The dotted and the dashed lines indicate the trend in dielectric permittivity as a function of gelatin percentage.
Download figure:
Standard image High-resolution imageTable 4. Dielectric properties of human breast ex-vivo tissues.
| Real part of ε @ 10 GHz (mean ± standard deviation) | Imaginary part of ε @ 10 GHz (mean ± standard deviation) | |
|---|---|---|
| Low-density | 9.87 ± 10.19 | 3.35 ± 5.32 |
| Medium density | 22.01 ± 13.08 | 9.93 ± 7.28 |
| High-density | 32.85 ± 12.25 | 16.05 ± 6.92 |
| Malignant | 39.29 ± 7.17 | 19.43 ± 4.36 |
3.2. Mechanical properties of the produced phantoms
3.2.1. Stress–strain curves and derivation of Young's modulus
The mechanical characteristics of the produced phantoms are described by means of the samples Young's modulus. In this short paragraph, we show how we derived Young's modulus from the strength ( )–displacement (l) curves we get as output from the traction/compression machine we used, also graphically clarifying why we chose to focus our analysis on the range of 0%–5% strain.
In particular, from the strength–displacement curves, the stress (σ)–strain (ε) curves were derived in this way:


where A =  is the area of each sample,
  is the diameter of the sample, and
  =
=  −
−  is the difference between the initial (
 ) and the final length of each sample. In figure 7, an example of stress–strain curves for two considered phantoms are shown, both measured under the experimental condition PL02TS1 (preload of 0.2 N and test speed of 1 mm min−1). In particular, G3.3O66.6 and G21.17O21 were chosen, since these represent the phantoms with the lowest and highest percentage of gelatin, respectively.
From these curves, in addition to the obvious result that higher percentages of gelatin correspond to greater slopes of the curves, indicating greater stiffness of the samples, it is possible to note that in the 0%–5% strain region the behaviour of both phantoms can be reasonably assumed as linear; in the 5–20/25% of strain region, the behavior is quasi-linear, while for higher strain percentages the behavior follows different trends (even highly non-linear in the case of stiffer samples) until the phantom breaks (data not shown for percentages of strain higher than 50%). To quantitatively describe the mechanical behavior of all phantoms within the 0%–5% of strain, we compute the Young's modulus, defined as the slope of the straight line interpolating the corresponding first tract of the experimental curve.
Please note that we have chosen to show only the Young's moduli of the phantoms at 5% strain because in this region the elastic behavior of the materials is approximately linear. Moreover, this threshold allows us to compare the results with those obtained by Ismail et al (2017), in which the authors produced similar materials.
As shown in figure 7, as the percentage of strain increases, the behavior of the phantoms (figure 7 shows the two limiting cases, at highest and lowest percentages of gelatin) tends to assume a non-linear behavior. In addition, low percentages of strain are widely used in the literature to mechanically characterize biological samples in order to remain in the region of linearity of both biological ex-vivo and phantom samples. Indeed, in (Krouskop et al 1998) the mechanical characterization of ex-vivo biological samples was proposed and the Young's modulus was calculated under the conditions of 5% and 20% 'pre-strain' to show that, as the initial compression level increases (in terms of 'displacement'), the values of the mechanical properties (including contrast) increase. In addition, the stress–strain characteristics of healthy tissues were shown to have a constant slope up to about 30% of strain (for tumour tissues, the linear behavior is kept over a shorter range, i.e. about 10%).
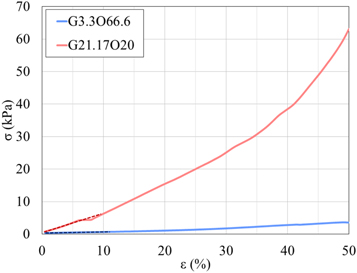
Figure 7. Stress–strain curves for two phantoms (G21.17O21 and G3.3O66.6) measured with 0.2 N of preload and 1 mm min−1 of test speed. Dashed lines indicate linear interpolation for the considered 0%–5% strain region.
Download figure:
Standard image High-resolution imageIn another example of characterization of ex-vivo samples (Wellman et al 1999), the decision not to consider the curve above 15% strain is clearly justified because of the non-linearity (and of damage to samples above this threshold) of tumour tissues.
On the other hand, there also seems to be a sensible limit on the stress level at which Young's modulus should be calculated: Umemoto et al (2014) mentions the concept of 'light touch' (stress < 0.2–0.4 kPa), which is an optimal compression threshold in order to obtain clearer and more accurate elastographic images. In the same paper, it is mentioned that tests are performed up to 50% strain on healthy specimens, but for tumours, due to their non-linear behaviour, it stops at 30%.
In other works, compression/indentation tests are carried out with very small displacements (0.5 mm maximum), but the size of the specimens is not specified, so it is not possible to determine the level of strain at which Young's modulus is calculated (Samani and Plewes 2007, Samani et al 2007).
In Akki and Arunachalam (2014), PVAL phantom characterization is carried out and Young's modulus is calculated at 15% and 30% strain as linear material behaviors are obtained up to this value.
In addition, reference guidelines on how to perform ultrasound elastography (Dietrich et al 2017) speak about values for tissue strain percentages among 0.1% and 2% for strain elastography in clinical in-vivo settings.
Furthermore, McKnight et al (2002) shows that the tissues stiffness in elastographic image achieved in an in-vivo scenario is lower than the sample stiffness in an ex-vivo scenario. In addition, the contrast between healthy and malignant tissues spans from 2.3 to 6.8, which in any case is in line with the values achieved in our tests and shown in tables 7 and 8.
3.2.2. Impact of preload on phantom mechanical properties
We firstly evaluated the impact of pre-load on the mechanical behaviour of the considered phantoms. In particular, we measured the mechanical properties of all the solidified mixtures at a test speed of 1 mm min−1 with preloads of 0.1 N, 0.2 N, and 0.4 N (experimental conditions PL01TS1, PL02TS1 and PL04TS1 in table 2). The results are shown in table 5 for all phantoms at 5% of strain. In addition, in figure 8, the Young's modulus values at 5% of strain for phantoms mimicking low-density (gelatin percentage = 3.3% and 4.9%) and malignant tissues (gelatin percentage = 8%, 16% and 21.17%) are shown. From this figure, the increasing impact of the preload on the mechanical properties of phantoms with higher gelatin percentages can be noticed, in agreement with the literature (Krouskop et al 1998, Ismai et al 2017).
Table 5. Young's moduli (kPa) of the produced phantoms for three different preloads (0.1 N, 0.2 N and 0.4 N) at a fixed test speed of 1 mm min−1 @ 5% of strain.
| Low density | Medium density | High density | Malignant | ||||||||
|---|---|---|---|---|---|---|---|---|---|---|---|
| G3.3O66.6 | G4.9O66.6 | G5O50 | G7.35O50 | G9.55O50 | G6.6O33.3 | G9.8O33.3 | G12.74O33.3 | G8O20 | G16O20 | G21.17O20 | |
| PL01TS1 | 4.51 ± 0.15 | 7.45 ± 2.80 | 6.46 ± 1.31 | 12.08 ± 3.33 | 15.28 ± 5.22 | 8.46 ± 2.17 | 14.83.8.46 | 27.51 ± 4.00 | 10.35 ± 3.36 | 17.84 ± 10.81 | 11.44 ± 5.46 |
| PL02TS1 | 3.86 ± 1.24 | 9.61 ± 4.53 | 5.73 ± 1.99 | 6.34 ± 0.93 | 19.57 ± 1.11 | 8.56 ± 2.45 | 12.58 ± 1.53 | 24.10 ± 0.05 | 12.77 ± 4.03 | 29.49 ± 16.53 | 36.06 ± 15.16 |
| PL04TS1 | 5.36 ± 2.08 | 9.57 ± 4.08 | 5.26 ± 0.67 | 11.21 ± 3.40 | — | 9.85 ± 3.02 | 15.56 ± 3.58 | — | 12.51 ± 0.91 | 28.51 ± 10.26 | 52.46 ± 17.57 |
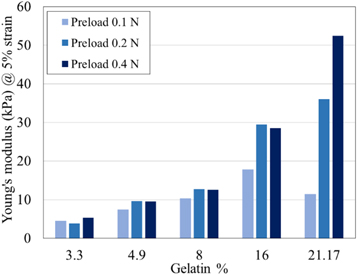
Figure 8. Comparison between the Young's modulus at 5% of strain of phantoms mimicking low-density (gelatin percentage = 3.3%, 4.9%) and malignant human breast tissues (gelatin percentage = 8%, 16%, 21.17%) for three different preloads using a test speed of 1 mm min−1.
Download figure:
Standard image High-resolution image3.2.3. Impact of test speed on phantom mechanical properties
The second parameter we examined was test speed. In particular, low- and high-test speed were considered to assess the impact of this parameter on phantoms mechanical characteristics in a broad range of test speeds. Specifically, we performed compression tests of all manufactured phantoms at a fixed preload (i.e. 0.2 N) with varying test speeds from 0.5 mm min−1 (quasi-static compression) to 2 mm min−1; and compression tests of two phantoms mimicking low-density healthy and malignant tissues at a fixed preload (i.e. 0 N) with test speeds of 60 mm min−1 and 80 mm min−1. For this last set of measurements, G4.9O66.6 and G21.17O20 were considered, as these represent the lower and upper category of mimicked tissue, in terms of density, corresponding also to the upper and lower percentage of oil involved in the mixtures. In table 6, the values of Young's moduli at 5% of strain under the experimental conditions of 0.2 N of preload and test speeds of 0.5 mm min−1, 1 mm min−1 and 2 mm min−1 (i.e. PL02TSO5, PL02TS1 and PL02TS2) are shown. In addition, in figure 9, a subset of the results presented in table 6 is illustrated (i.e. the Young's modulus values at 5% of strain for phantoms mimicking low-density and malignant tissues). Similarly, in figure 10, the Young's modulus values for G4.9O66.6 and for G21.17O20, under the experimental condition of preload 0 N and test speeds 60 mm min−1 and 80 mm min−1, are shown at 5% of strain.
Table 6. Young's Moduli (kPa) of the produced phantoms for three different test speeds (0.5 mm min−1, 1 mm min−1 and 2 mm min−1) at a fixed preload of 0.2 N @ 5% of strain.
| Low density | Medium density | High density | Malignant | ||||||||
|---|---|---|---|---|---|---|---|---|---|---|---|
| G3.3O66.6 | G4.9O66.6 | G5O50 | G7.35O50 | G9.55O50 | G6.6O33.3 | G9.8O33.3 | G12.74O33.3 | G8O20 | G16O20 | G21.17O20 | |
| PL02TS05 | 3.66 ± 0.06 | 12.43 ± 0.91 | 6.28 ± 0.82 | 13.89 ± 2.65 | 13.95 ± 1.07 | 8.37 ± 0.67 | 13.95 ± 2.24 | 24.10 ± 0.05 | 7.43 ± 2.80 | 20.59 ± 6.25 | 35.26 ± 16.98 |
| PL02TS1 | 4.64 ± 2.43 | 8.87 ± 3.17 | 4.82 ± 1.06 | 8.60 ± 3.69 | 24.17 ± 1.59 | 8.00 ± 2.27 | 12.84 ± 1.76 | 24.04 ± 7.79 | 8.75 ± 2.79 | 47.03 ± 20.53 | 32.46 ± 27.34 |
| PL02TS2 | 3.86 ± 1.24 | 9.61 ± 4.53 | 5.73 ± 1.99 | 6.34 ± 0.93 | 19.57 ± 1.11 | 8.56 ± 2.45 | 12.58 ± 1.53 | 24.10 ± 0.05 | 12.77 ± 4.03 | 29.49 ± 16.53 | 36.06 ± 15.16 |

Figure 9. Comparison between the Young's modulus at 5% strain of phantoms mimicking low-density (gelatin percentage 3.3% and 4.9%) and malignant human breast tissues (gelatin percentage 8%, 16% and 21.17%) for three different test speeds at a preload of 0.2 N.
Download figure:
Standard image High-resolution image
Figure 10. Comparison between the Young's modulus at 5% strain of phantoms mimicking low-density (gelatin percentage = 4.9%) and malignant human breast tissues (gelatin percentage = 21.17%) for two high test speeds (60 mm min−1 and 80 mm min−1) at a preload of 0 N.
Download figure:
Standard image High-resolution imageAlthough comparing the values of Young's moduli for the same material at very different compression rates these are quite different (e.g. for G21.17O20, the Young's modulus at low compression rates—from 0.5 mm min−1 to 2 mm min−1—is around 35 kPa, while for higher speeds—60 mm min−1 and 80 mm min−1—it is around 9 kPa), it should be noted that the preloads used for the two sets of measurements are different (for figure 9, the preload was 0.2 N and for figure 10 it was 0 N due to measurement setup issues), and as shown in figure 8 this justifies the different values of Young's moduli obtained. Therefore, taking this into account, the results shown in table 5 and figures 9 and 10 show that the compression rate has no significant impact on the Young's modulus values of the phantoms. The only three cases where a more visible variation is observed are G7.35O50, G9.55O50 (both shown in table 6 only), and G16O20 (see table 6 and figure 9). However, it is not possible to derive a correlation between them; therefore, they may be variations due to measurement errors. As an example, we noticed some troubles with the control of the experimental setup using high speeds: for what concerns the use of these materials, it is critical to manage the adherence between the compression punch and the sample under test, as its shape and dimension are difficult to geometrically standardize and strongly related to conditions like temperature and composition. Thus, as an example, the mechanical behaviour of the G16O20 for the test speed of 2 mm min−1 would merit further investigations. From these results, we can conclude that the mechanical behaviour does not appear to be rate dependent.
3.2.4. Mechanical contrast between healthy- and neoplastic-tissue-like phantoms
Mechanical contrast is represented by the ratio of the Young's moduli of two materials, it is a dimensionless quantity and expresses the relative difference in stiffness between two materials. In literature, the mechanical behaviour of in-vivo and ex-vivo samples is sometimes provided in terms of contrast (i.e. the ratio between the elastic modulus of two different materials) between healthy and tumor tissues (Sarvazyan et al 1995, Krouskop et al 1998, Wellman et al 1999, Manduca et al 2001, Srivastava et al 2011). This information can improve the sensitivity and specificity (related to the percentage of false positives and false negatives) of the imaging technique, being sometimes even more important than the knowledge of the absolute value of the Young's moduli of each phantom or tissue.
For this reason, we have chosen to compute the contrast between the tumor-like tissue-mimicking phantoms and two different categories of healthy-like phantoms (i.e. fat- and fibroglandular-like tissue-mimicking materials), for all the investigated experimental conditions. In the following tables, the mechanical contrasts at 5% of strain are shown. In particular, in table 7, the mechanical contrast between the phantoms mimicking malignant tissues and the softest phantom (G3.3O66.6) is shown. In table 8, the mechanical contrast between the phantoms mimicking malignant tissues and the one mimicking high-density tissues (G6.6O33.3) is shown.
Table 7. Mechanical contrasts between malignant- and low-density-tissue-like phantoms at a 5% strain.
| G8O20/G3.3O66.6 | G16O20/G3.3O66.6 | G21.17O20/G3.3O66.6 | |
|---|---|---|---|
| PL04TS2 | 2.35 | 7.59 | 7.35 |
| PL02TS2 | 1.88 | 10.12 | 6.98 |
| PL02TS1 | 3.30 | 7.62 | 9.32 |
| PL04TS1 | 2.33 | 5.31 | 9.77 |
| PL02TS05 | 2.02 | 5.61 | 9.61 |
| PL01TS1 | 2.33 | 3.87 | 2.53 |
| PL01TS05 | 2.15 | 2.74 | 4.18 |
Table 8. Mechanical contrasts between malignant- and high-density-tissue-like phantoms at 5% strain.
| G8O20/G6.6O33.3 | G16O20/G6.6O33.3 | G21.17O20/G6.6O33.3 | |
|---|---|---|---|
| PL04TS2 | 1.22 | 3.94 | 3.81 |
| PL02TS2 | 1.09 | 5.87 | 4.05 |
| PL02TS1 | 1.49 | 3.44 | 4.21 |
| PL04TS1 | 1.27 | 2.89 | 5.32 |
| PL02TS05 | 0.88 | 2.45 | 4.21 |
| PL01TS1 | 1.24 | 2.06 | 1.35 |
| PL01TS05 | 1.26 | 1.61 | 2.45 |
These tables show that the range of mechanical contrasts covered by our phantoms is wide. However, while the contrasts are too low when considering the ratio of G8O20 to G3.3O66.6, and indeed are not comparable with any value reported in the literature, they show higher values when considering tumor-like mixtures with higher percentages of gelatin (i.e. G16O20 and G21.17O20) and are more in line with those reported in other papers. In particular, under PL04TS1 and PL02TS05 experimental conditions, the G16O20/G3.3O66.6 ratio seems directly comparable with the mechanical contrast reported in Krouskop et al (1998). In addition, when considering the mechanical contrasts between tumor- and healthy-tissue-like phantoms with major fibrous and glandular components, the values we obtained are in line with those shown in Wellman et al (1999). In particular, the ratio G8O20/G6.6O33.3 is able to mimic the mechanical contrast between the papilloma and the fibro glandular tissue under almost all experimental conditions. On top of that, PL02TS1 condition allows to obtain a mechanical contrast in line with that shown in Wellman et al (1999) for IDC and glandular tissue when the mixtures G16O20 and G6.6O33.3 are considered. However, it should be noted that for all the values reported in the literature, obtained from the characterization of ex vivo samples, the experimental conditions are not specified, and only in some cases the level of strain is reported. Therefore, the previously made considerations referring to comparisons with results in the literature are mostly qualitative, as an actual quantitative comparison with such values is not possible.
3.3. Heterogeneous phantom
A realistic heterogeneous phantom, consisting of healthy-tissue-like background (G3.3O66.6) with tumour-like inclusion (G21.17O20), was finally produced. Specifically, the amount of ingredients used for the background phantom were 116.9 ml of water, 233.1 ml of sunflower oil, 11.55 g of gelatin, and 6.52 ml of dishwashing detergent. This represents the most challenging phantom, as it contains the highest percentage of oil and the lowest percentage of gelatin. Regarding the inclusion, the quantities shown in table 1 were used. The procedure used was the same described in Di Meo et al (2019). The tumor-like inclusion was thought to be oval, with an approximately 2 cm length.
A photo of the complete phantom is presented in figure 11(a), and a cross section of it in which the inclusion is visible is shown in figure 10(b). The food dye added to the mixtures is only intended to make the inclusion visible, without altering the properties of the phantom. The phantom was then sectioned in order to separate the background from the inclusion, and 4 cylindrical samples per phantom were derived, all with 28 mm diameter and 10 mm height. As an example, the samples were characterized under the experimental conditions denoted by PL02TS1 and PL04TS1, i.e. preload = 0.2 N and 0.4 N and test speed = 1 mm min−1. The average mechanical properties measured on these specimens are shown in table 9, from which it is possible to appreciate the good agreement with tables 5 and 6, and thus the repeatability of the mechanical measurements even when larger quantities of the ingredients are used to generate greater phantoms.

Figure 11. Photo of the complete phantom with an inclusion.
Download figure:
Standard image High-resolution image
Table 9. Young's moduli of the samples derived from the complete phantom with the inclusion.
| Young's modulus at 5% of strain (kPa) | ||
|---|---|---|
| PL02TS1 | PL04TS1 | |
| G3.3O66.6 | 3.16 | 4.02 |
| G21.17O20 | 34.02 | 49.48 |
3.4. Discussion
In the previous sections we have shown the results of the dielectric and mechanical characterization of a series of phantoms based on deionized water, sunflower oil, dishwashing liquid and gelatin. The recipes were derived from those previously proposed by our research group in Di Meo et al (2019) and the percentage of gelatin was increased to mimic the mechanical properties of breast tissues, always paying close attention to the dielectric properties of the mixtures. Specifically, the dielectric properties were measured up to 14 GHz and fitted with the Cole–Cole model. The dielectric permittivity curves were compared to those of human breast ex vivo tissues (Di Meo et al 2018) showing a good agreement, even when the percentage of gelatin was increased to mimic the mechanical properties of healthy- and neoplastic-tissues.
However, if on one hand the methods to obtain reliable dielectric measurements are now consolidated, on the other hand there are still uncertainties for the mechanical characterization. Analysing the literature related to the mechanical characterization of biological samples, the absence of univocal measurement guidelines is clear, with the consequent significant variability in the results produced. In particular, among the most common techniques for the mechanical characterization of materials (i.e. unconfined, confined and indentation compression), it seems that the most popular method used for this kind of semi-solid samples is the unconfined compression, which was thus employed also in our work. We analysed the impact of the two most critical parameters in this type of measurements, i.e. the preload and test speed, making mechanical measurements under different experimental conditions (preload = 0.1 N, 0.2 N, 0.4 N; test speed = 0.5 mm min−1, 1 mm min−1, 2 mm min−1). To do so, we produced 11 different phantoms mimicking all the possible breast tissues. Each phantom was replicated on three different days, and from each of the phantoms produced, 3 samples were derived and characterized. We focused the analysis on the strain range 0%–5%, as this is one of the most widely used values in the literature (when explicitly indicated), and it also represents a region where the stress–strain curve for this type of phantoms shows a linear trend, making it possible to determine the corresponding Young's modulus value. In particular, we showed that the preload has a major impact when considering phantoms with a high percentage of gelatin, while it has approximately no impact for phantoms mimicking soft tissues (i.e. with a low percentage of gelatin). This result is in line with the literature (Krouskop et al 1998, Ismai et al 2017), although the absolute values of the elastic moduli are different due to different (sometimes unspecified) measurement conditions.
Regarding the test speed, our results show that the dependence of the mechanical properties of the produced phantoms on this parameter is not significant, both for slow compression speeds in the range from 0.5 mm min−1 to 2 mm min−1 and for high compression speeds, as 60 mm min−1 and 80 mm min−1. A comparison between the Young's moduli we measured on our phantoms and those published in literature was possible only with Ismai et al (2017), because, to the authors' best knowledge, this was the only work in which almost the same experimental setup, as well as some of the experimental conditions, were used. The comparison with Ismai et al (2017) was also feasible due to the similarity of the materials involved in the phantoms. The results reported in tables 5 and 6 show that the mechanical properties of phantoms mimicking adipose tissues (G4.9O66.6) agree with Ismail et al (2017) when the same experimental conditions are considered. On the other hand, the Young's moduli of tumor-like tissue phantoms we achieved are lower than those proposed in Ismail et al (2017), also when the G21.17O20 mixture is considered, demonstrating that a variation of the gelatin percentage only is not enough in this case, and that a modified mixture recipe would be necessary.
In this paper, we focused also on the mechanical contrast between malignant and healthy tissues. In particular, we computed the ratio between the Young's moduli of neoplastic- and healthy-tissue-like phantoms under all the considered experimental conditions. However, here we reported only the contrasts between malignant- and adipose- tissue-like phantoms, as well as between malignant- and fibroglandular-tissue-like phantoms. Indeed, these two cases were selected because they represent both borderline cases and the two most interesting scenarios in a possible clinical setting (especially the contrast between malignant and fibro-glandular tissues). Despite the high dependence of mechanical properties from the experimental conditions, our results are in line with those reported in literature, when both these ratios are considered (Krouskop et al 1998, Wellman et al 1999).
4. Conclusion
In this paper, 11 different tissue-mimicking breast phantoms based on cheap, easy to handle and safe components were produced and characterized, both dielectrically and mechanically. Phantoms made by deionized water, sunflower oil, common dishwashing liquid and gelatin were considered. Three samples from each phantom were derived and tested. The dielectric properties of the phantoms were measured up to 14 GHz and then the Cole–Cole parameters were derived to allow the dielectric comparison up to 50 GHz with human breast ex-vivo tissues. The mechanical characteristics of all phantoms were measured by means of an unconfined compression test. The impact of preload and test speed on mechanical properties of the biological samples was analysed. The results were compared with those reported in literature and the dependence of the mechanical properties on the experimental conditions was assessed. In addition, we computed the mechanical contrasts between phantoms mimicking both healthy and malignant tissues, and we showed that, even if our results are in line with literature as the same order of magnitude is achieved, a direct comparison is not feasible due to unpecified experimental conditions in literature.
Therefore, in this paper, analysing for the first time an high number of oil-in-gelatin breast phantoms, we evaluated the impact of the experimental conditions on the mechanical properties of biological samples, stressing the importance of considering these parameters for a reliable mechanical characterisation of semi-solid biological samples. From this work, we can conclude that the higher is the phantom gelatin percentage the higher is the impact of the preload on its measured mechanical properties, while the test speed has no impact on the measured Young's modulus of the produced phantoms regardless of the gelatin percentage involved in the mixture; therefore, an high attention has to be paid to these parameters during the mechanical characterization of oil-in-gelatin tissue-mimicking breast phantoms. In addition, by this high number of tests, we provided also the bimodal characterization of phantoms to be possibly used for imaging purposes.