
Abstract
Objective. Next generation online and real-time adaptive radiotherapy workflows require precise particle transport simulations in sub-second times, which is unfeasible with current analytical pencil beam algorithms (PBA) or Monte Carlo (MC) methods. We present a deep learning based millisecond speed dose calculation algorithm (DoTA) accurately predicting the dose deposited by mono-energetic proton pencil beams for arbitrary energies and patient geometries. Approach. Given the forward-scattering nature of protons, we frame 3D particle transport as modeling a sequence of 2D geometries in the beam's eye view. DoTA combines convolutional neural networks extracting spatial features (e.g. tissue and density contrasts) with a transformer self-attention backbone that routes information between the sequence of geometry slices and a vector representing the beam's energy, and is trained to predict low noise MC simulations of proton beamlets using 80 000 different head and neck, lung, and prostate geometries. Main results. Predicting beamlet doses in 5 ± 4.9 ms with a very high gamma pass rate of 99.37 ± 1.17% (1%, 3 mm) compared to the ground truth MC calculations, DoTA significantly improves upon analytical pencil beam algorithms both in precision and speed. Offering MC accuracy 100 times faster than PBAs for pencil beams, our model calculates full treatment plan doses in 10–15 s depending on the number of beamlets (800–2200 in our plans), achieving a 99.70 ± 0.14% (2%, 2 mm) gamma pass rate across 9 test patients. Significance. Outperforming all previous analytical pencil beam and deep learning based approaches, DoTA represents a new state of the art in data-driven dose calculation and can directly compete with the speed of even commercial GPU MC approaches. Providing the sub-second speed required for adaptive treatments, straightforward implementations could offer similar benefits to other steps of the radiotherapy workflow or other modalities such as helium or carbon treatments.
Export citation and abstract BibTeX RIS

Original content from this work may be used under the terms of the Creative Commons Attribution 4.0 licence. Any further distribution of this work must maintain attribution to the author(s) and the title of the work, journal citation and DOI.
1. Introduction
Radiotherapy (RT) treatments intimately rely on accurate particle transport calculations. In computed tomography (CT) image acquisition (Pereira et al 2014) simulations of the interaction between photons, tissues and detectors are used to obtain a detailed 3D image of the patient anatomy, which can be delineated to localize target structures and organs-at-risk. Modern intensity modulated treatments (Hussein et al 2018, Meyer et al 2018) require particle transport to compute the spatial distribution of physical dose delivered by thousands of individual electron, photon, proton or other heavy ion beamlets (aimed at the patient from a few different beam angles), based on which the beamlet intensities can be optimized. Treatment plans—especially sensitive proton and ion treatments–must also be repeatedly evaluated under uncertainties (e.g. setup and range errors, tumor motion or complex anatomical changes) to ensure sufficient plan robustness, requiring recalculating the dose distribution in many different scenarios (Perkó et al 2016, van der Voort et al 2016, Rojo-Santiago et al 2021). With RT practice steadily moving towards adaptive treatments, accurate, fast and general purpose dose (and particle transport) calculations represent an increasingly pressing, currently unmet need in most clinical settings.
We focus our attention specifically to proton dose calculations due to their more challenging nature caused by higher sensitivity and complexity compared to traditional photons. Current physics-based tools—by and large falling into 2 categories: analytical pencil beam algorithms (PBAs) (Hong et al 1996, Schaffner et al 1999) and Monte Carlo (MC) simulations—offer a trade-off between speed and precision. While PBAs yield results without the computational burden of MC engines, their accuracy is severely compromised in highly heterogeneous or complex geometries, making slow and clinically often not affordable MC approaches necessary (Teoh et al 2020, Schuemann et al 2015, Taylor et al 2017, Grassberger et al 2014, Saini et al 2017). The problem is most acute for online (and ultimately real-time) adaptive proton therapy aiming at treatment correction prior to (or even during) delivery to account for inter-fractional anatomical changes, motion due to breathing, coughs or intestinal movements. To become reality, such adaptive treatments require algorithms yielding MC accuracy with sub-second speed.
Reducing dose calculation times is an active area of research, with most works focusing on improving existing physics-based algorithms or developing deep learning frameworks. Several studies benefit from the parallelization capabilities of Graphics Processing Units (GPUs) to massively speed up MC simulations, reducing calculations times down to the range of few seconds (Fracchiolla et al 2021, Wan Chan Tseung et al 2015) to minutes (Ma et al 2014, Gajewski et al 2021, Pepin et al 2018, Wang et al 2016, Qin et al 2016), with simulation speeds up to 107 protons s−1. Deep learning methods have also improved dose calculation times in several steps of the RT workflow (Meyer et al 2018), although usually paying the price of limited versatility and generalization capabilities. Some initial studies apply variants of U-net (Ronneberger et al 2015) and Generative Adversarial Networks (Goodfellow et al 2014) to aid treatment planning by approximating dose distributions from 'optimal' plans in very specific scenarios based on historical data. As input to these convolutional architectures, most works use organ and tumor masks (Chen et al 2019, Fan et al 2019, Nguyen et al 2019, Kajikawa et al 2019), CT images (Kearney et al 2018) or manually encoded beam information (Nguyen et al 2019, Barragán-Montero et al 2019) to directly predict full dose distributions, except for few papers predicting the required beam intensities needed to deliver such doses (Lee et al 2019, Wang et al 2020).
Regarding pure dose calculation, practically all deep learning applications rely on using computationally cheaper physics simulations as additional input apart from CTs. For photons, most works predict low noise MC dose distributions from high noise MC doses (Peng et al 2019, 2019, Bai et al 2021, Neph et al 2021) or simple analytical particle transport calculations (Xing et al 2020, Dong and Xing 2020), with some approaches also utilizing additional manually encoded beam/physics information such as fluence maps (Fan et al 2020, Xing et al 2020, Zhu et al 2020, Kontaxis et al 2020, Tsekas et al 2021). For protons, we are only aware of 3 papers (Wu et al 2021, Javaid et al 2021, Nomura et al 2020) that compute proton dose distributions via deep learning, using cheap physics models (noisy MC and PBA) or pre-calculated Bragg peak maps as input. While providing significant speed-up compared to pure physics-based algorithms, some even reaching sub-second speeds, all these works depend on secondary physics models to produce their output or are trained to predict only full plan or field doses for specific treatment sites. As a result, these methods do not qualify as generic dose algorithms and do not generalize to other steps of the RT workflow outside their original scope, e.g. to different plan or field configurations, treatment sites, or applications needing the individual dose distribution from each beamlet separately (such as treatment adaptation).
Instead, our study focuses on learning particle transport physics to substitute generic proton dose engines, providing millisecond speed and high accuracy, and is in principle applicable to all RT steps requiring dose calculations (e.g. dose-influence matrix calculation, dose accumulation, robustness evaluation). Our approach builds upon a previous study (Neishabouri et al 2021) using long short-term memory (LSTM) networks (Hochreiter and Schmidhuber 1997) to sequentially calculate proton pencil beam dose distributions from relative stopping power slices in sub-second times, but with the major disadvantage of requiring a separate model per beam energy. As shown in figure 1, we frame proton transport as modeling a sequence of 2D geometry slices in the beam's eye view, introducing an attention-based transformer backbone (Vaswani et al 2017) that dynamically routes information between elements of the sequence along beam depth. We extend on our previous work only focusing on lung cancer (Pastor-Serrano and Perkó 2021), training with a larger set of patients and treatment sites, and evaluating performance both for individual pencil beams and full treatment plans. The presented Dose Transformer algorithm (DoTA)—able to learn the physics of energy dependence in proton transport via a single model—can predict low noise MC proton pencil beam dose distributions purely from beamlet energy and CT data in ≈5 ms. Based on our experiments and available literature data, in terms of accuracy and overall speed DoTA significantly outperforms pencil beam algorithms and all other deep learning approaches (e.g. LSTM models (Neishabouri et al 2021) and 'denoising' networks (Wu et al 2021, Javaid et al 2021, Nomura et al 2020)), representing the current state-of-the-art in data-driven proton dose calculations and directly competing with (and even improving on) GPU Monte Carlo approaches.

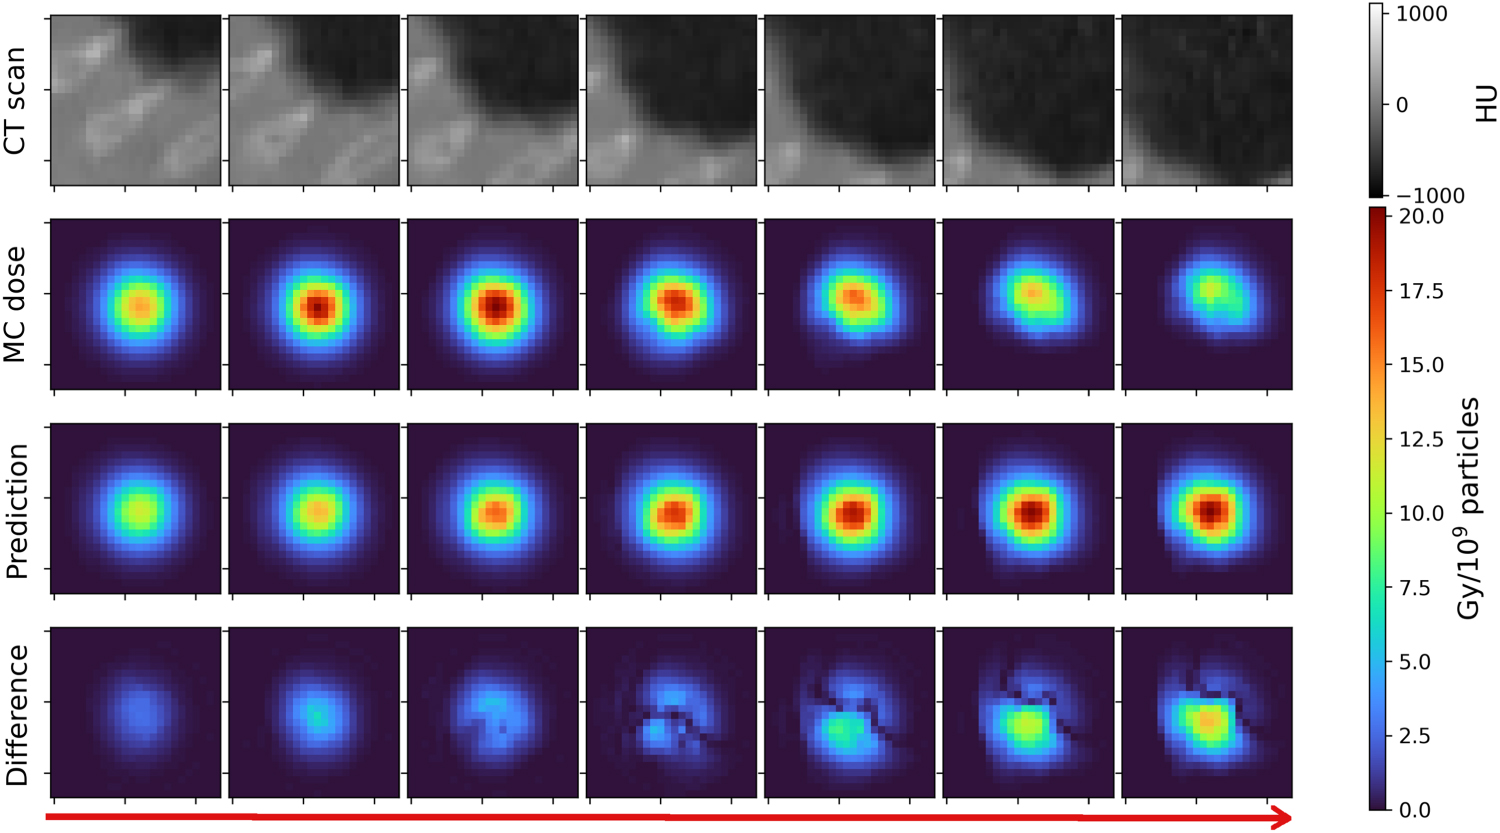
Figure 1. Dose transformer algorithm (DoTA). A data-driven model learns a mapping y = f θ ( x , ε) between input CT cubes x and energies ε and output dose distributions y . CT and dose distribution 3D volumes are both treated as a sequence of 2D slices in the beam's eye view. An encoder and a decoder individually transform each 2D slice into a feature vector and vice versa, whereas a transformer backbone routes information between different vectors along beam depth.
Download figure:
Standard image High-resolution image2. Methods and materials
The problem of dose calculation is common to many steps of RT workflow and ultimately involves estimating the spatial distribution of physical dose from thousands of pencil beams. A generic deep learning dose engine must be capable of calculating 3D dose distributions for arbitrary patient geometries purely from a list of beam directions and energies for a given beam model, without being conditioned on the type of treatment or task being solved. Therefore, our objective is to accurately predict dose distributions y from individual proton beamlets in sub-second speed, given patient geometries x and beam energies ε. We introduce DoTA, a parametric model that implicitly captures particle transport physics from data and learns the function y =f θ ( x , ε) via a series of artificial neural networks with parameters θ .
In particular, DoTA learns a mapping between a 3D CT input voxel grid  and output dose distribution
  conditioned on the energy
  , where L is the depth (in the direction of beam propagation), H is the height and W is the width of the grid. While traditional physics-based calculation tools process the entire geometry, we crop and interpolate the CT to the reduced sub-volume seen by protons as they travel through the patient, with a fixed 2 mm × 2 mm × 2 mm resolution and L × H × W size. Framing proton transport as sequence modeling, DoTA processes the input volume as a series of L 2D slices in the forward beam direction. Ideally, the exchange of information between the different elements in the sequence should be dynamic, i.e. the contribution or impact of each 2D slice to the sequence depends on both its position and material composition. Unlike other types of artificial neural networks, the Transformer architecture (Vaswani et al
2017)—and specifically the self-attention mechanism—is notably well suited for this.
, where L is the depth (in the direction of beam propagation), H is the height and W is the width of the grid. While traditional physics-based calculation tools process the entire geometry, we crop and interpolate the CT to the reduced sub-volume seen by protons as they travel through the patient, with a fixed 2 mm × 2 mm × 2 mm resolution and L × H × W size. Framing proton transport as sequence modeling, DoTA processes the input volume as a series of L 2D slices in the forward beam direction. Ideally, the exchange of information between the different elements in the sequence should be dynamic, i.e. the contribution or impact of each 2D slice to the sequence depends on both its position and material composition. Unlike other types of artificial neural networks, the Transformer architecture (Vaswani et al
2017)—and specifically the self-attention mechanism—is notably well suited for this.
Recently, Transformer-based architectures have replaced their recurrent counterparts in many natural language processing (Devlin et al 2019, Brown et al 2020) and computer vision tasks (Ramachandran et al 2019, Dosovitskiy et al 2020, Touvron et al 2020, D'Ascoli et al 2021). For modeling the sequentiality in proton transport physics, the advantage of Transformers with respect to LSTM frameworks is two-fold. First, every element can directly access information at any point in the sequence without requiring an internal hidden state, which is crucial to include beam energy dependence. The routing of information—referred to as self-attention—is different for every element, allowing each geometry slice to be independently transformed based on the information it selectively gathers from other slices in the sequence. Second, Transformers allow manually encoding the mostly forward scattering nature of proton transport by restricting interaction to only previous slices via causal attention. Transformers typically run multiple self-attention operations in parallel (known as attention heads), with each head focusing on modeling separate features of the sequence. We provide a detailed description of the fundamentals of self-attention and the Transformer module in appendix A.
2.1. Model architecture and training
Figure 2 shows DoTA's architecture, which first applies the same series of convolutions to each 2D slice of the input sequence  separately. This convolutional encoder contains two blocks—both with a convolution, a Group Normalization (GN) (Wu and He 2020) and a pooling layer, followed by a Rectified Linear Unit (ReLU) activation—which extract important features from the input, e.g. material contrasts and tissue boundaries. After the second block, the outputs of a final convolution with K filters are flattened into a vector of embedding dimension
  , where
  and
and  are the reduced height and width of the images after the pooling operations. The convolutional encoder applies the same operation to every element
x
i
, resulting in a sequence of L vectors
are the reduced height and width of the images after the pooling operations. The convolutional encoder applies the same operation to every element
x
i
, resulting in a sequence of L vectors  referred to as tokens in the remainder of the paper.

Figure 2. DoTA architecture. We treat the input and output 3D volumes as a sequence of 2D slices. A convolutional encoder extracts important geometrical from each slice into a feature vector. The particle energy is added at the beginning of the resulting sequence. A transformer encoder with causal self-attention subsequently combines information from the different elements of the sequence. Finally, a convolutional decoder individually transforms the low-dimensional vectors into output 2D dose slices.
Download figure:
Standard image High-resolution imageA Transformer encoder models the interaction between tokens
z
i
via causal self-attention, resulting in an output sequence  . Since Transformers operate on sets and by default do not account for the relative position of the slices in the sequence, we add a learnable positional encoding
  to each token
z
i
, e.g.
r
1 is always added to the token
z
1 from the first slice seen by the proton beam. The energy dependence is included via a 0th token
to each token
z
i
, e.g.
r
1 is always added to the token
z
1 from the first slice seen by the proton beam. The energy dependence is included via a 0th token  at the beginning of the sequence, where
  is a learned linear projection of the beam energy ε. We use the standard pre-Layer Normalization (LN) (Ba et al
2016) Transformer block (Xiong et al
2020), alternating LN and residual connections with a self-attention operation and a feed-forward block with two fully-connected layers, Dropout (Srivastava et al
2014) and a Gaussian Error Linear Unit activation (Hendrycks and Gimpel 2016).
is a learned linear projection of the beam energy ε. We use the standard pre-Layer Normalization (LN) (Ba et al
2016) Transformer block (Xiong et al
2020), alternating LN and residual connections with a self-attention operation and a feed-forward block with two fully-connected layers, Dropout (Srivastava et al
2014) and a Gaussian Error Linear Unit activation (Hendrycks and Gimpel 2016).
Finally, a convolutional decoder independently transforms every output token to a 2D slice of the same size as the input  . The decoder's structure is identical to that of its encoder counterpart, but substituting the down-sampling convolution + pooling operation in the with an up-sampling convolutional transpose layer.
Dataset We train DoTA to predict low noise MC dose distributions calculated with MCsquare (Souris et al
2016), obtained using a set of 30 CT scans from prostate, lung and head and neck (H&N) cancer patients (Aerts et al
2014, 2015, Clark et al
2013) with 2 mm isotropic grid resolution. Given that proton beams have approximately 25 mm diameter and travel up to 300 mm through a small sub-volume of the CT, we crop blocks  covering a volume of approximately 48 × 48 × 300 mm3. From each patient CT, we obtain ≈ 2500 of such blocks—corresponding to beamlets being shot at different angles and positions—by effectively rotating and linearly interpolating the CT scan in steps of 10° and by applying 10 mm lateral shifts.
For each block, we calculate 2 different dose distributions using 107 primary particles to ensure MC noise values around 0.3% and always below 0.5%, zeroing out dose values below noise levels. Both dose distributions correspond to a randomly sampled beam energy between 70 and 220 MeV, with a 140 MeV cap in lung and H&N geometries given the potential to overshoot the patient. As a result, we obtain ≈80,000 individual CT block–dose distribution input–output pairs. This amount is further quadrupled by rotating the CT and dose blocks in steps of 90° around the beam direction axis, yielding a final training dataset consisting of ≈320 000 samples, 10% of which are used as a validation set to prevent overfitting.
Our evaluation is based on an independent test set of 18 additional patients unseen during training, equally split into prostate, H&N and lung. Half of these patients (3 prostate, 3 H&N and 3 lung) are used to obtain 3888 test beamlet dose distributions (1386 lung, 1512 H&N and 990 prostate samples), with the other half serving to evaluate DoTA's performance in full plans.
Training details The model is trained end-to-end using Tensorflow (Abadi et al ), with the LAMB optimizer (You et al 2019) and 8 samples per mini-batch, limited by the maximum internal memory of the Nvidia Tesla T4® GPU used during our experiments. We use a mean squared error loss function and a scheduled learning rate starting at 10−3 that is halved every 4 epochs, with a restart after 28 epochs. In total, we train the model for 56 epochs, saving the weights resulting in the lowest validation mean squared error. The best performing model consists of one transformer block with 16 heads and 12 convolutional filters in the last encoder layer, as obtained from a hyperparameter grid search evaluating the lowest validation loss across all possible combinations of transformer layers N ∈ {1, 2, 4}, convolutional filters K ∈ {8, 10, 12, 16} and attention heads Nh ∈ {8, 12, 16}. Given the two down-sampling pooling operations, the transformer processes tokens of dimension D = H/4 × W/4 × K, which in our case with initial height H = 24, width W = 24, and K = 12 kernels results in D = 432.
2.2. Model evaluation
Using the ground truth MC dose distributions in the test set, we compare DoTA to several data-driven dose engines, including LSTM models (Neishabouri et al 2021), and deep learning frameworks using noisy MC (Javaid et al 2021) and PBA (Wu et al 2021) doses as additional input. Since PBA is the analytical dose calculation method commonly used in the clinic and one of DoTA's competitors in terms of speed and accuracy, we include the PBA baseline from the open-source treatment planning software matRad (Wieser et al 2017) (https://e0404.github.io/matRad/).
Test set accuracy metrics In our evaluation, the main mechanism to compare predictions to ground truth 3D dose distributions from the test set is the gamma analysis (Low et al 1998), further explained in appendix B. To reduce the gamma evaluation to a single number per sample, we report the gamma pass rate as the fraction of passed voxels over the total number of voxels. All calculations are based on the PyMedPhys gamma evaluation functions (available at https://docs.pymedphys.com).
Additionally, the average relative error ρ is used to explicitly compare dose differences between two beamlet dose distributions. Given the predicted output
y
and the ground truth dose distribution  with nv
= L × H × W voxels, the average relative error can be calculated as
with nv
= L × H × W voxels, the average relative error can be calculated as

Since the models are trained using a mean squared error (MSE) cost function, we also compute the root mean squared error (RMSE) between ground truth and predicted beamlet dose distributions, defined as

Finally, as an alternative metric to the gamma pass rate for comparing full dose distributions, we calculate the relative dose error (RDE) (Nomura et al 2020) between the ground truth and predicted D95, D90, D50 and D20 values, where Dv is the dose received by v% of the tumor volume. The RDE is computed relative to the planned dose Dpr as

Experiments A generic data-driven dose engine must yield accurate predictions for both single beamlet and full plan dose distributions. To ensure DoTA's suitability for replacing conventional particle transport tools in dose prediction tasks, we assess its performance in two different settings:
- Individual beamlets. First, we evaluate the speed and accuracy in predicting single beamlet doses for 9 patients in the test set and compare gamma pass rate distributions and inference times of DoTA, the LSTM models and the PBA baseline. Given the 2 mm × 2 mm × 2 mm grid resolution, a gamma evaluation Γ(3 mm, 1%) using a distance-to-agreement criterion δ = 3 mm ensures a neighborhood search of at least one voxel, while a dose criterion Δ = 1% disregards any uncertainty due to MC noise. Since DoTA's outputs are hardly ever 0 due to numerical inaccuracies of the last convolutional linear layer, and to disregard voxels not receiving any dose, we exclude voxels with doses below 0.1% of the maximum dose for the gamma pass rate calculations, resulting in a stricter metric (as the many voxels with near 0 dose could artificially increase the passing rate). Additionally, we compute the relative error ρ and RMSE between PBA/DoTA predictions and MC dose distributions. For both ρ and the gamma pass rate, we compare probability densities across all test samples.
- Full plans. A treatment plan with 2 fields is obtained for the remaining 9 test set patients using matRad. Given the list of beam intensities and energies in the plan, we recalculate dose distributions using PBA, MCsquare (Souris et al 2016) and DoTA, and evaluate their performance via the gamma pass rate, masking voxels receiving a dose lower than 10% of the maximum dose. For each field angle in the treatment plan, we rotate the original CT, calculate the dose from each beamlet and rotate back the entire field dose its original angle for dose accumulation. To allow for a fair comparison with other data-driven models—referred to as baselines B1 (Javaid et al 2021) and B2 (Wu et al 2021)—we compute three gamma evaluations Γ(1 mm, 1%), Γ(2 mm, 2%) and Γ(3 mm, 3%) and compare the pass rate results to the available values in these baseline studies. Since the third baseline B3 (Nomura et al 2020) does not report a gamma pass rate, we compare RDEs with the values reported in the paper. For more information about the experiments, table 1 contains a description of the metrics and evaluation settings.
Table 1.
Overview of experiments. Summary of the experiments, metrics and baselines used to evaluate DoTA's accuracy.  refers to the maximum dose value in a dose distribution and only voxels receiving dose above the cutoff level are included in the Γ calculations.
| Experiment | Test data | Metric | Dose cutoff (Gy) | Baseline |
|---|---|---|---|---|
| Individual beamlets | 3888 beamlets | Γ(3 mm, 1%) | 0 | LSTM |
| 1386 lung, | 0.1% of 
| PBA | ||
| 990 prostate, | Error ρ | 0 | PBA | |
| 1512 H&N | RMSE | 0 | PBA | |
| Full plans | 9 treatment plans | Γ(1 mm, 1%) | 10% of 
| PBA, B2 |
| Γ(2 mm, 2%) | 10% of 
| B1 | ||

| Tumor doses | B3 |
3. Results
In this section, DoTA's performance and speed is compared to state-of-the-art models and clinically used methods. The analysis is three-fold: we assess the accuracy in predicting beamlet dose distributions and full dose distributions from treatment plans, and explore DoTAs' potential as a fast dose engine by evaluating its calculation runtimes.
3.1. Individual beamlets
For each individual beamlet in the test set, DoTA's predictions are compared to MC ground truth dose distributions using a Γ(3 mm, 1%) gamma analysis. In table 2, we report the average, standard deviation, minimum and maximum of the distribution of gamma pass rates across test samples. By disregarding voxels whose dose is below 0.1% of the maximum dose, our gamma evaluation approach is stricter than that of previous state-of-the-art studies (Neishabouri et al 2021), where only voxels with a gamma value of 0—which typically correspond to voxels not receiving any dose—are excluded from the pass rate calculation. Even with the stricter setting and including energy dependence, DoTA outperforms both the LSTM and PBA dose engines in all aspects: the average pass rates are higher, the standard deviation is lower, and the minimum is at least 5.5% higher. Similar results are observed for stricter gamma evaluation settings in appendix C. The left plot in figure 3 further demonstrates DoTA's superiority, showing a gamma pass rate distribution that is more concentrated towards higher values. We subsequently divide each beam dose distribution into 4 fragments of equal size between the entrance and the Bragg peak, where each fragment is referred to as beam section in the remainder of the paper. The right plot in figure 3 shows the proportion of voxels failing the gamma evaluation in each beam section, out of the total number of failed voxels, indicating for both PBA and DoTA that most of the failing voxels belong to the 4th section, i.e. the high dose region around the Bragg peak where the effect of tissue heterogeneity is most evident.

Figure 3. Gamma pass rate distribution. (Left) Distribution of the gamma pass rates Γ(3 mm, 1%) of the test samples for the pencil beam algorithm (PBA) and the presented DoTA model. (Right) Distribution of the failed voxels along the beam, where each bin is an equally-sized fragment (referred to as section) of the beam from dose entrance (1st) to Bragg peak and dose falloff (4th). Each bin shows the ratio of the number of test set voxels that fail the gamma evaluation within a section divided by the total number of failed voxels.
Download figure:
Standard image High-resolution imageTable 2. Gamma pass rate of beamlet dose distributions. Gamma analysis results Γ(3 mm, 1%) for the presented DoTA, the pencil beam algorithm (PBA) from matRad (Wieser et al 2017) and the LSTM models are listed. Gamma pass rates are calculated using all test samples, with LSTM rates directly obtained from (Neishabouri et al 2021). The reported values include the mean, standard deviation (Std), minimum (Min) and maximum (Max) across the test set for different sites, and 'Multi-site' refers to computing statistics using all sites.
| Model | Site | Energy (MeV) | Mean (%) | Std (%) | Min (%) | Max (%) |
|---|---|---|---|---|---|---|
| LSTM (Neishabouri et al 2021) | Lung | 67.85 | 98.56 | 1.3 | 95.35 | 99.79 |
| 104.25 | 97.74 | 1.48 | 92.57 | 99.74 | ||
| 134.68 | 94.51 | 2.99 | 85.37 | 99.02 | ||
| DoTA (ours) | Lung | [70, 140] | 99.46 | 0.81 | 93.19 | 100 |
| H&N | [70, 140] | 99.21 | 1.23 | 93.49 | 100 | |
| Prostate | [70, 220] | 99.51 | 1.46 | 94.06 | 100 | |
| DoTA (ours) | Multi-site | [70, 220] | 99.37 | 1.17 | 93.19 | 100 |
| PBA (matRad) | Multi-site | [70, 220] | 98.68 | 3.14 | 87.53 | 100 |
As an additional measure of model performance, table 3 shows the mean and standard deviation of the relative error ρ and RMSE between predictions and ground truth MC dose distributions in the test set. The results confirm DoTA's improvement, with mean, maximum error and standard deviation less than half of PBA's. The left plot in figure 4 displays the distribution of ρ across all test samples, showing that values are smaller and closer to 0 for DoTA. As with the gamma pass rate, the beam is divided in 4 sections from entrance (1st) to the Bragg peak (4th), and the average relative error per section is shown in the right plot in figure 4. Although both models show a similar trend with errors increasing towards the beam's end, DoTA is on average twice better than PBA.

Figure 4. Average relative error ρ distribution. (Left) Distribution of the average relative error across the test samples for the pencil beam algorithm (PBA) and the presented DoTA model. (Right) Average relative error per beam section, where each bin is a section (4 equally-sized fragments) of the beam from dose entrance (1st) to Bragg Peak and dose falloff (4th). Each bin shows the average of the relative error values recorded within a section of the beam.
Download figure:
Standard image High-resolution imageTable 3. Error of beamlet dose distributions. The reported values include the mean, standard deviation (Std), minimum (Min) and maximum (Max) values of the relative error ρ and root mean squared error (RMSE) between 3888 test predictions and reference MC dose distributions, for both the pencil beam algorithm (PBA) from matRad (Wieser et al 2017) and DoTA.
| Model | Relative error ρ (%) | RMSE (Gy) | ||||||
|---|---|---|---|---|---|---|---|---|
| Mean | Std | Min | Max | Mean | Std | Min | Max | |
| DoTA (ours) | 0.126 | 0.109 | 0.025 | 1.258 | 0.083 | 0.041 | 0.024 | 0.277 |
| PBA (matRad) | 0.306 | 0.309 | 0.059 | 4.077 | 0.294 | 0.126 | 0.057 | 1.293 |
Finally, figure 5(b) shows DoTA's test sample with the lowest gamma pass rate, together with PBA's prediction of the same sample (figure 5(a)). Likewise, figures 5(d) and (c) show the predictions of the worst PBA sample from both models. In both cases, PBA results in errors as high as 80% of the maximum dose, severely overdosing parts of the geometry, while for DoTA errors are below 20% of the maximum dose.
3.2. Full dose recalculation
To assess the feasibility of using DoTA as a dose engine in real clinical settings, we recalculate full dose distributions from treatment plans and compare them to MC reference doses via 3 different gamma analysis: Γ(1 mm, 1%), Γ(2 mm, 2%) and Γ(3 mm, 3%), in decreasing order of strictness. The resulting gamma pass rates for each of the 9 test patients are shown in table 4, showing values that are consistently high and similar across treatment sites, always at least 10% higher than PBA. We additionally compare DoTA to recently published state-of-the-art deep learning approaches: a MC-denoising U-net (Javaid et al 2021) (B1), and a U-net correcting PBA (Wu et al 2021) (B2). Except for the prostate plans, DoTA outperforms both approaches, even without requiring the additional physics-based input.
Table 4. Gamma pass rate of planned dose distributions. Treatment plans of 9 test patients are recalculated using the presented DoTA model, and compared to ground truth MC dose distributions via 3 different gamma analysis: Γ(1 mm, 1%), Γ(2 mm, 2%) and Γ(3 mm, 3%). We additionally include the Γ(1 mm, 1%) pass rate for dose distributions recalculated with the pencil beam algorithm (PBA) from matRad (Wieser et al 2017). The baseline B1 corresponds to a MC-denoising U-net (Javaid et al 2021), while B2 is a U-net correcting PBA (Wu et al 2021), whose values are directly taken for their corresponding papers.
| Site | Patient | Number of spots | DoTA (ours) | PBA | B1 (Javaid et al 2021) | B2 (Wu et al 2021) | ||
|---|---|---|---|---|---|---|---|---|
| Γ(1, 1%) | Γ(2, 2%) | Γ(3, 3%) | Γ(1, 1%) | Γ(2, 2%) | Γ(1, 1%) | |||
| Lung | 1 | 954 | 95.86 | 99.73 | 99.99 | 80.38 | 84.1 | 89.7±3.8 |
| 2 | 2245 | 96.31 | 99.72 | 99.98 | 79.83 | |||
| 3 | 1646 | 95.63 | 99.64 | 99.97 | 78.92 | |||
| H&N | 4 | 1554 | 95.02 | 99.39 | 99.81 | 68.32 | 76.5 | 92.8±2.9 |
| 5 | 1064 | 94.71 | 99.62 | 99.97 | 76.63 | |||
| 6 | 708 | 96.93 | 99.88 | 99.99 | 83.02 | |||
| Prostate | 7 | 1598 | 96.38 | 99.81 | 99.99 | 87.34 | — | 99.6±0.3 |
| 8 | 2281 | 95.78 | 99.82 | 99.99 | 77.12 | |||
| 9 | 1518 | 96.18 | 99.71 | 99.98 | 83.64 | |||
Figure 6 shows the RDE of DoTA and the B3 baseline (a convolutional neural network predicting dose distributions from Bragg peak position maps). B3 results are taken directly from the paper Nomura et al 2020.Reproduced from Nomura et al 2020, © 2020 Institute of Physics and Engineering in Medicine. All rights reserved, while DoTA values are computed using all test set dose distributions. With a significantly lower spread and values much closer to 0%, the results further confirm DoTA's superiority and accuracy gains.
3.3. Runtime
Apart from high prediction accuracy, fast inference is critically important for clinical applications. Table 5 displays the mean and standard deviation runtime taken by each model to predict a single beamlet. Being particularly well-suited for GPUs, DoTA is on average faster than LSTM and physics-based engines, offering more than 100 times speed-up with respect to PBA. Additionally, although dependent on hardware, DoTA approximates doses four orders of magnitude faster than MC, providing millisecond dose calculation times without requiring any extra computations for real-time adaptive treatments.
Table 5. Beamlet prediction runtime. The reported values include the mean inference time and standard deviation (Std) taken by each model to predict individual beamlet dose distributions. Both the DoTA and LSTM models run on GPU hardware, while the pencil beam algorithm (PBA) (Wieser et al 2017) and Monte Carlo (MC) dose engine use CPUs with multiple threads. LSTM inference times are taken directly from (Neishabouri et al 2021).
| Model | Mean (ms) | Std (ms) |
|---|---|---|
| LSTM a (Neishabouri et al 2021) | 6.0 | 1.5 |
| DoTA b (ours) | 5.0 | 4.9 |
| PBA c (matRad) | 728.3 | 30.9 |
| MC c (Souris et al 2016) | 43 636.9 | 12 291.6 |
a Nvidia® Quadro RTX 6000 64 Gb RAM. b Debian 10 4 vCPUs—Nvidia® A100 40 Gb RAM. c CentOS 7 8 CPUs intel Xeon® E5-2620 16Gb RAM.
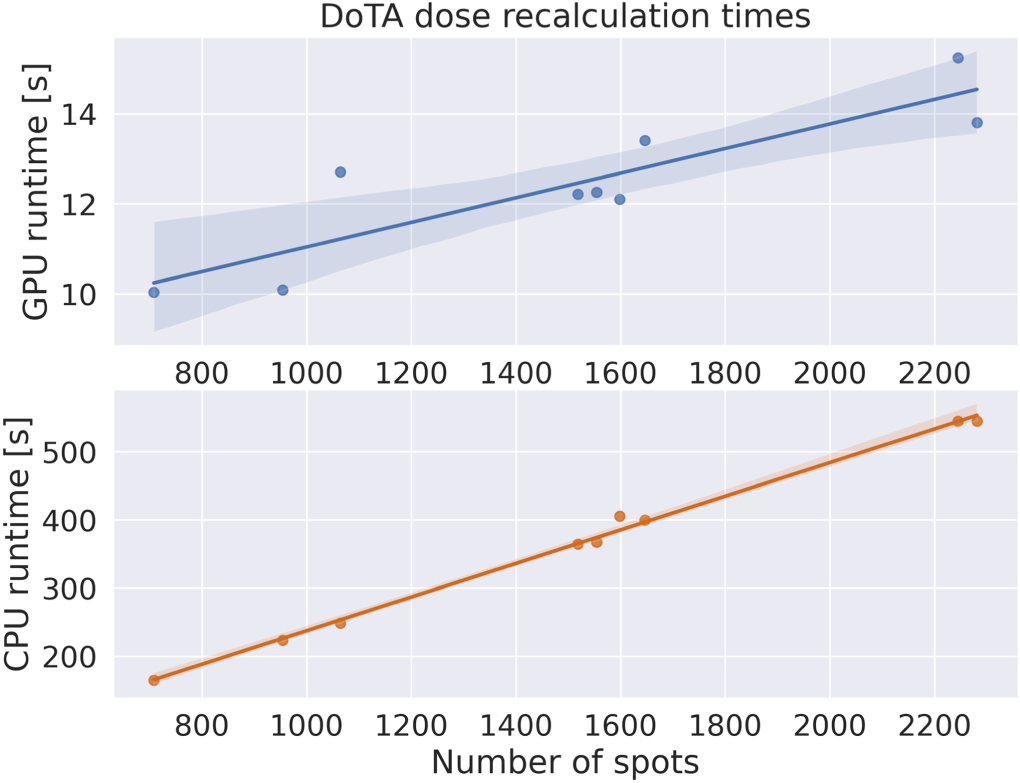
Regarding full dose recalculation from treatment plans, figure 7 shows total runtimes for DoTA using both GPU and CPU hardware, including all steps from loading CT and beamlet weights from plan data files, necessary CT rotations and interpolations, DoTA dose inference time and reverse rotations and interpolation to assign dose on the original CT grid. Being optimized for GPU acceleration, DoTA is the fastest alternative, needing less than 15 s to calculate full dose distributions. For the baselines in this paper, we find that PBA runtimes oscillate between 100 and 150 s, while B1 and B2 report needing only few seconds to correct/denoise their inputs, but must add the runtime necessary to generate their respective PBA (123–303 s in Wu et al (2021)) or MC (≈10 s in Javaid et al (2021)) input doses, as well as data transfer times between the physics engine and the deep learning framework. Furthermore, B2 is a per beam network, hence its runtime scales linearly with the number of beams, in practice meaning 2–4 times higher total calculation times.
4. Discussion
In this study, we present a data-driven dose engine predicting dose distributions with high accuracy. The presented DoTA model builds upon previous work learning proton transport as sequence modeling task via LSTM networks (Neishabouri et al 2021), by introducing energy dependence and significantly improving its performance in a varied set of treatment sites. DoTA greatly outperforms analytical physics-based PBA algorithms in predicting dose distributions from individual proton pencil beams, achieving high accuracy even in the most heterogeneous patient geometries, demonstrated by the 6% improvement in the minimum gamma pass rate. With millisecond inference times, DoTA provides at least a factor 100 reduction in calculation time compared to the clinically still predominant analytical PBAs.
The drastic reduction in spot dose prediction times translates into the ability to calculate full dose distributions in 12 s on average and less than 15 s even for the plan with more than 2200 pencil beams, which times include the required time for all steps from loading CT and pencil beam weights from plan data (≈1 s on average), CT interpolation and beamlet geometry extraction (≈1 s), DoTA model and weights loading (≈2 s), dose inference by DoTA (≈7.5 s) and interpolating the final dose distribution back to the original CT grid (≈1 s). Although publicly available deep learning frameworks are optimized for GPU architectures and may offer an advantage with respect to adapting MC and PBA to GPU hardware, we achieve this 10–15 s speed on a single GPU card, even without any optimization of GPU settings for inference, which can reportedly yield up to 9 times speed-ups depending on the task 1 . Without sacrificing accuracy, DoTA represents at least a factor 10 speed-up with respect to PBAs and a 33% speed-up (and ≈80% considering the difference in MC noise levels) with respect to the fastest GPU MC competitor we could find in the literature—clinically used GPU MC software Raystation® (Fracchiolla et al 2021), typically running in clusters or workstations with multiple GPUs and CPU cores. Moreover, DoTA offers a 10%–25% increase in the Γ(1 mm, 1%) gamma pass rate compared to PBA, and with a Γ(2 mm, 2%) gamma pass rate <99% it matches (Wang et al 2016) or outperforms (Wan Chan Tseung et al 2015, Qin et al 2016) the accuracy of GPU MC approaches. DoTA's accuracy is also on par with the agreement between commercial MC engines (Raystation®) and experimental measurements (Schreuder et al 2019, 2019). While the GPU-based PBA algorithm reported in da Silva et al (2015) calculates a full distribution in 0.22 s and is faster than DoTA, it was tested only on a single patient showing worse accuracy with a 3% lower Γ(2 mm, 2%) pass rate.
Our method is also substantially superior to the only 3 published deep learning approaches for proton full plan dose calculations (Javaid et al 2021, Wu et al 2021, Nomura et al 2020). We achieve 15% and 25% higher Γ(2 mm, 2%) pass rates compared to the MC-denoising U-net of Javaid et al (2021), and 6% and 2% higher Γ(1 mm, 1%) pass rates compared to the PBA correcting U-net of Wu et al (2021) in lung and H&N patients, respectively. With lower RDE values much more concentrated around 0, DoTA also improves upon the dose prediction U-net based on Bragg peak position maps (Nomura et al 2020). DoTA shows a slight inferiority in prostate patients, with a ≈3% lower Γ(1 mm, 1%) pass rates than (Wu et al 2021). However, this direct comparison is somewhat unfair to DoTA. In our work we evaluate performance on Intensity Modulated Proton Therapy plans with a small, 3–5 mm spot size, while in Wu et al (2021) double scattering proton therapy plans were used, which in general are less conformal and smoother, and therefore are expected to be easier to predict with data-driven approaches. We also use a finer voxel resolution of 2 mm × 2 mm × 2 mm compared to the 2 mm × 2 mm × 2.5 mm used in Wu et al (2021). Furthermore, Wu et al (2021) also reports site specific fine-tuning of their deep learning approach, unlike our method. Last, Wu et al (2021) has the further disadvantage of using per beam PBA calculations as input, thus the reported 2–3 s dose correction times easily translate to full treatment plan calculation times in the 5–10 min range depending on the number of beams (taking into account the >2 min PBA run times), even without accounting for the additional time for the necessary CT rotations and interpolations.
DoTA's accuracy may further be increased by training with larger datasets, as demonstrated by the improvement achieved when increasing training data from 4 lung patients in our earlier work (Pastor-Serrano and Perkó 2021) to 30 patients with varied anatomies in the current study. Using dose distributions with lower MC noise could further improve performance. Convincingly outperforming all recent works learning corrections for 'cheap' physics-based predictions (Wu et al 2021, Javaid et al 2021) both in terms of accuracy and speed, DoTA has the flexibility to be used in a great variety of treatment sites and clinical settings.
Application DoTA's accuracy and speed improvements outperform existing approaches and represent a new state-of-the-art that could benefit current RT practice in numerous aspects. The small number of potential geometries currently used to evaluate treatment plan robustness—whose size is limited by the speed of the dose calculation algorithm—can be extended with many additional samples, capturing a more diverse and realistic set of inter- and intra-fraction (Pastor-Serrano and Perkó 2021) geometrical variations. DoTA's capability to quickly and accurately estimate fraction dose distributions based on pre-treatment daily CT images could transform dosimetric quality assurance protocols, enabling direct comparison between the planned and estimated doses or even online adaptation of plans (Jagt et al 2017, 2018, Albertini et al 2020). Most crucially, by pre-computing the input volumes and updating their CT values in real time, the millisecond speed for individual pencil beam dose calculation makes our model well suited for real-time correction during radiation delivery.
Limitations The current version of DoTA is trained to predict MC ground truth dose distributions from a specific machine with unique settings and beam profiles, necessitating a specific model per machine. Likewise, range shifters—which are often dependent on treatment location and site—affect the dose delivered by some spots while inserted, thereby modifying the final dose distribution. Both problems could in principle be addressed by constructing a model that takes extra shape and range shifter specifications as input in the form of tokens at the beginning of the sequence, similar to our approach for treating the energy dependence.
DoTA is trained for a specific voxel grid resolution, requiring either an individual model per resolution level or an additional interpolation step that will likely negatively interfere with the gamma pass rate results, especially for gamma evaluations Γ(1, 1%) with a distance-to-agreement criterion lower than the voxel resolution level. While DoTA also works for finer nominal CT grids (Pastor-Serrano and Perkó 2021), an additional study testing the dose recalculation performance with more patients and finer grid resolution should confirm its suitability for direct clinical application needing such resolutions. MC noise may also affect the results of the gamma evaluation, as demonstrated in previous work (Cohilis et al 2020) showing that even 1% MC noise levels introduce significant under-estimation in the gamma pass rate. In our evaluation, we expect this detrimental effect to be limited given our lower noise levels of 0.3% in the ground truth MC doses (which level is considered as reference 'denoised' in Cohilis et al (2020)).
One of the main problems of deep learning algorithms is their limited generalization or extrapolation capability outside the domain of the used training dataset. In our evaluation, performed in an independent test set of patients with varied geometries unseen during training, DoTA is clearly superior to all other methods in all evaluated scenarios, showing strong evidence of high level of generalization. Nevertheless, just like any deep learning approach, DoTA may also yield unrealistic predictions for data that vastly differs from the training data (e.g. in the presence of metallic implants), contrarily to MC engines, which—when using enough particles—are certain to provide valid results. Whether or not 'more physics-based' PBAs perform better than DoTA in such cases is less straightforward. First, PBA clearly performed worse than DoTA in all our tests, and in particular showed worse performance in the examples of figure 5 exhibiting high heterogeneity (figures 5(a)–(b)) and the Bragg peak position coinciding with a sharp change in density (figures 5(c)–(d), further highlighted on the coronal views in figure 9 in appendix C). Second, the impact of approximations inherent to PBA approaches on the predicted dose in cases of unusual geometries (e.g. implants) is not easy to foresee without detailed analysis. The same holds for the error due to DoTA's potential generalization limitations in such cases. While we do not have direct evidence for it, physics-based approaches (even approximative ones) may maintain a higher level of accuracy when going far beyond the training dataset domain. For the specific case of radiotherapy however, to a large extent these problems could be mitigated by including geometries with metallic implants in the training data set and teaching DoTA to accurately predict dose distributions in such scenarios too and by limiting use to (the vast majority of) patients who do not have implants until such improved model is available.

Figure 5. Worst performing DoTA and PBA test sample. (a) Worst performing test sample in the gamma evaluation for DoTA, with gamma pass rate of 93.19%, and (b) the pencil beam algorithm (PBA) prediction for the same sample. (d) Worst performing prediction in the gamma evaluation across the test set for PBA, with gamma pass rate of 87.53%, and (c) DoTA's prediction of the same sample. In descending order, all 4 subplots show: the central slice of the 3D input CT grid, the MC ground truth dose distribution, the model's prediction and the dose difference between the predicted and MC beams.
Download figure:
Standard image High-resolution image
Figure 6. Relative dose errors. Error between the ground truth and predicted D95, D90, D50 and D20 for (a) the B3 baseline (Reproduced from Nomura et al 2020. © 2020 Institute of Physics and Engineering in Medicine. All rights reserved.) and (b) the proposed DoTA model, relative to planned doses. Red crosses are outliers, red lines represent the median, and box boundaries denote the 25th and 75th percentiles.
Download figure:
Standard image High-resolution image
Figure 7. Full dose recalculation runtime. Time needed to recalculate planned dose distributions with DoTA using (top) a Nvidia® A100 GPU or (bottom) an intel Xeon® CPU. Estimates include time for loading CT and beam weights from plan data, for dose inference by DoTA and for the necessary CT and dose interpolations. Shaded areas denote the 95% confidence interval.
Download figure:
Standard image High-resolution imageFuture work Besides the possibility to include shape, machine and beam characteristics as additional input tokens in the transformer, several extensions can widen its spectrum of applications, such as predicting additional quantities, e.g. particle flux, or estimating radiobiological weighted dose—potentially including simulating even DNA damage—typically significantly slower than pure MC dose calculation. A clinically highly relevant follow-up study is to include geometries with metallic implants in the training dataset and ensuring prediction accuracy in such challenging geometries too. Alternatively, future work adapting DoTA to learn photon physics would facilitate its use in conventional radiotherapy applications or provide CT/CBCT imaging reconstruction techniques with the necessary speed for real-time adaptation. Most importantly, DoTA offers great potential to speed up dose calculation times in heavy ion treatments with particles such as carbon and helium sharing similar, mostly forward scatter physics, whose MC dose calculation often take much longer to simulate all secondary particles generated as the beam travels through the patient.
5. Conclusion
We present DoTA: a generic, fast and accurate dose engine that implicitly learns proton particle transport physics and can be applied to speed up several steps of the radiotherapy workflow. Framing particle transport as sequence modeling of 2D geometry slices in the proton's beam travel direction, we use the power of transformers to predict individual beamlets with millisecond speed and close to MC precision. Our evaluation shows that DoTA has the right attributes to potentially replace the proton dose calculation tools currently used in the clinics for applications that critically depend on runtime. Predicting dose distributions from single pencil beams in milliseconds, DoTA offers 100 times faster inference times than widely used PBAs, yielding close to MC accuracy as indicated by the very high gamma pass rate Γ(3 mm, 1%) of 99.37 ± 1.17, thus has the potential to enable next generation online and real-time adaptive radiotherapy cancer treatments. The presented model predicts MC quality full plan dose distributions with at least a 10% improvement in gamma pass rate Γ(1 mm, 1%) with respect to current analytical approaches and reduces dose calculation times of planned doses to less than 15 s, representing a tool that can directly benefit current clinical practice too.
Acknowledgments
This work is supported by KWF Kanker Bestrijding [grant number 11 711] and is part of the KWF research project PAREL. Zoltán Perkó would like to thank the support of the NWO VENI grant ALLEGRO (016.Veni.198.055) during the time of this study.
Code availability
The code, weights and results are publicly available at https://github.com/opaserr/dota.
CRediT authorship contribution statement
Oscar Pastor-Serrano: Conceptualization, Methodology, Software, Validation, Formal Analysis, Investigation, Data Curation, Writing—original draft, Visualization.
Zoltán Perkó: Conceptualization, Methodology, Formal Analysis, Resources, Writing—original draft, Writing—Review and editing, Supervision, Project Administration, Funding Acquisition.
Appendix A.: Transformer and self-attention
Transformer DoTA's backbone is the Transformer (Vaswani et al 2017), based on the self-attention mechanism. Though originally introduced for sequential modeling applications in natural language processing such as machine translation, Transformers have recently achieved state-of-the-art performance across a wide variety of tasks, with large language (Devlin et al 2019, Brown et al 2020) or computer vision (Dosovitskiy et al 2020) models replacing and outperforming recurrent or convolutional architectures. One of the main reasons behind the success of attention-based models is the ability to model interactions between a large sequence of elements without needing an internal memory state. In Transformers, each sequence element is transformed based on the information it selectively gathers from other members of the sequence based on its content or position. In practice, however, the computational memory requirements scale quadratically with the length of the sequence, and training such large Transformers often requires a pre-training stage with a large amount of data.
Self-attention Given a sequence  with L tokens, the self-attention (SA) mechanism (Vaswani et al
2017) is based on the interaction between a series of queries
with L tokens, the self-attention (SA) mechanism (Vaswani et al
2017) is based on the interaction between a series of queries  , keys
  , and values
  of dimensionality Dh
obtained through a learned linear transformation of the input tokens with weights
of dimensionality Dh
obtained through a learned linear transformation of the input tokens with weights  as
as

Each token is transformer into a query, key and value vector. Intuitively, for an ith token  , the query
  represents the information to be gathered from other elements of the sequence, while the key
  contains token's information to be shared with other sequence members. The token
z
i
is then transformed into
contains token's information to be shared with other sequence members. The token
z
i
is then transformed into  via a weighted sum of all values in the sequence
  as
as

where each weight is based on a the similarity between the ith query and the other keys in the sequence, measured as the dot product  . The output sequence of transformed tokens
  is the result of the SA operation applied to all sequence elements, defined by the attention matrix containing all weights
  and the operations


A variant of SA called multi-head self-attention (MSA) runs Nh
parallel SA operations focusing on different features or inter-dependencies of the data. Setting Dh
= D, the outputs of the different SA operations, called heads, are first concatenated and then linearly projected with learned weights  as
as

By definition, every token can attend to all previous and future tokens. Causal SA is a variant of SA applied to sequence modeling tasks restricting access to future information, where all elements above the diagonal in the attention matrix
A
are masked to 0. Additionally, since SA is invariant to the relative order of elements in the sequence, a fixed (Vaswani et al
2017) or learned (Dosovitskiy et al
2020) positional embedding  is usually added or concatenated to the input tokens, where is element in the positional embedding sequence contains unique information about its position.
Transformer encoder The causal MSA Transformer backbone in DoTA is responsible of routing information between the geometry slices and the energy token. A learnable positional embedding r is added to the sequence of tokens produced by the convolutional encoder, while we add the first 0th position embedding r 0 in the sequence to the energy token. The transformer encoder is formed by alternating MSA and Multi-layer Perceptron (MLP) layers with residual connections, and applying Layer Normalization (LN) applied before every layer (Ba et al 2016). Therefore, the Transformer encoder blocks computes the operations


where MLP denotes a two layer feed-forward network with Dropout (Srivastava et al 2014) and Gaussian Error Linear Unit (GELU) activations (Hendrycks and Gimpel 2016).
Appendix B.: Gamma analysis
The gamma analysis is based on the notion that doses delivered in neighboring voxels have similar biological effects. Intuitively, for a set reference points—the voxel centers in the ground truth 3D volume—and their corresponding dose values, this method searches for similar predicted doses within small spheres around each point. The sphere's radius is referred to as distance-to-agreement criterion, while the dose similarity is usually quantified as a percentage of the reference dose, e.g. dose values are accepted similar if within 1% of the reference dose. Each voxel with coordinates a in the reference grid is compared to points b of the predicted dose grid and assigned a gamma value γ( a ) according to


where  is the reference dose at point
a
, δ is the distance-to-agreement, and Δ is the dose difference criterion. A voxel passes the gamma analysis if γ(
a
) < 1.
is the reference dose at point
a
, δ is the distance-to-agreement, and Δ is the dose difference criterion. A voxel passes the gamma analysis if γ(
a
) < 1.
Appendix C.: Additional results
Table C1 shows additional results for the accuracy of the beamlet dose predictions, using stricter gamma evaluation settings. DoTA's superiority over PBA is clearly demonstrated under these stricter conditions too, with significantly higher mean and minimum passing rates, as well as smaller standard deviation values. Figure 8 displays the beam eye's view of the worst PBA test sample (corresponding to the sample shown figure 5(d)) around the Bragg peak, showing the transition from lung tissue to air that results in an erroneous predicted dose distribution. The coronal view in figure 9 further confirms that denser bone tissue from the ribs near the lung air boundary is likely to exacerbate prediction errors.

Figure 8. Beam eye's view of the worst PBA prediction. A fragment of the worst PBA prediction around the Bragg peak is shown (between 80 and 90 cm from entrance). From left to right, the displayed 2D slices are perpendicular to the beam along beam depth.
Download figure:
Standard image High-resolution image
Figure 9. Coronal view of the worst PBA prediction. The coronal plane view of the dose worst PBA sample is shown for (a) PBA and (b) DoTA predictions. From top to bottom, each row corresponds to a 2 millimeter step, where the column 'Difference' displays absolute dose differences between predictions and the 'Target' ground truth MC dose distribution.
Download figure:
Standard image High-resolution image
Table C1. Gamma pass rate of beamlet dose distributions. Gamma analysis Γ(1 mm, 1%) and Γ(2 mm, 1%) for DoTA and the pencil beam algorithm (PBA) from matRad (Wieser et al 2017) are listed. The reported values include the mean, standard deviation (Std), minimum (Min) and maximum (Max) across all test samples.
| Model | Energy (MeV) | Settings | Mean (%) | Std (%) | Min (%) | Max (%) |
|---|---|---|---|---|---|---|
| DoTA (ours) | [70, 220] | Γ(1 mm, 1%) | 96.58 | 3.83 | 82.31 | 100 |
| Γ(2 mm, 1%) | 98.67 | 2.04 | 89.69 | 100 | ||
| PBA (matRad) | [70, 220] | Γ(1 mm, 1%) | 92.54 | 6.07 | 65.21 | 99.41 |
| Γ(2 mm, 1%) | 97.20 | 4.27 | 76.49 | 100 |
Footnotes
- 1
Discussed in the non-peer-reviewed study in https://huggingface.co/transformers/v2.10.0/benchmarks.html.