
Abstract
Proton therapy treatment for lungs remains challenging as images enabling the detection of inter- and intra-fractional motion, which could be used for proton dose adaptation, are not readily available. 4D computed tomography (4DCT) provides high image quality but is rarely available in-room, while in-room 4D cone beam computed tomography (4DCBCT) suffers from image quality limitations stemming mostly from scatter detection. This study investigated the feasibility of using virtual 4D computed tomography (4DvCT) as a prior for a phase-per-phase scatter correction algorithm yielding a 4D scatter corrected cone beam computed tomography image (4DCBCTcor), which can be used for proton dose calculation. 4DCT and 4DCBCT scans of a porcine lung phantom, which generated reproducible ventilation, were acquired with matching breathing patterns. Diffeomorphic Morphons, a deformable image registration algorithm, was used to register the mid-position 4DCT to the mid-position 4DCBCT and yield a 4DvCT. The 4DCBCT was reconstructed using motion-aware reconstruction based on spatial and temporal regularization (MA-ROOSTER). Successively for each phase, digitally reconstructed radiographs of the 4DvCT, simulated without scatter, were exploited to correct scatter in the corresponding CBCT projections. The 4DCBCTcor was then reconstructed with MA-ROOSTER using the corrected CBCT projections and the same settings and deformation vector fields as those already used for reconstructing the 4DCBCT. The 4DCBCTcor and the 4DvCT were evaluated phase-by-phase, performing proton dose calculations and comparison to those of a ground truth 4DCT by means of dose-volume-histograms (DVH) and gamma pass-rates (PR). For accumulated doses, DVH parameters deviated by at most 1.7% in the 4DvCT and 2.0% in the 4DCBCTcor case. The gamma PR for a (2%, 2 mm) criterion with 10% threshold were at least 93.2% (4DvCT) and 94.2% (4DCBCTcor), respectively. The 4DCBCTcor technique enabled accurate proton dose calculation, which indicates the potential for applicability to clinical 4DCBCT scans.
Export citation and abstract BibTeX RIS

Original content from this work may be used under the terms of the Creative Commons Attribution 4.0 licence. Any further distribution of this work must maintain attribution to the author(s) and the title of the work, journal citation and DOI.
1. Introduction
Proton therapy (PT) offers a ballistic advantage over photon therapy as there is considerably less energy deposition along the trajectory to the target and a negligible amount beyond, due to the complete stopping of protons in matter at therapeutic energies. This localised energy release allows significant dose sparing in organs at risk (OAR) and a reduced integral dose. In modern PT facilities, the dose distribution can be shaped to improve dose conformity using pencil-beam scanned intensity-modulated proton therapy (IMPT) (Lomax et al 2001, 2004). Protons are used for treatment of different tumour entities such as head and neck (H&N) (Manzar et al 2020), oesophageal (Welsh et al 2011), paediatric brain (Lin et al 2020), gastrointestinal (Verma et al 2016), meningioma (Weber et al 2012), and non-small-cell lung carcinoma (NSCLC) (Nakajima et al 2018). PT may also be helpful in treatment-related complications (Kim et al 2019).
One drawback of PT is its high sensitivity to anatomical changes (Chen et al 2020b), which may occur during treatment, and which are typically classified as either inter- or intra-fractional. Inter-fractional changes include anatomical changes such as weight loss, stochastic motion of internal organs on a time scale of hours or more, and changes in tumour size. The second group contains respiratory and cardiac motion as well as the filling of bladder and bowel and is particularly relevant for tumours within the abdominothoracic region (Keall et al 2006). The characteristic Bragg-peak of charged particles makes PT very susceptible to these changes, which can compromise both target coverage and OAR sparing (Berman et al 2015). Respiration patterns can vary markedly between different fractions (McClelland et al 2010, Zhang et al 2015), and hence, for the treatment of moving tumours in the lung, it is of paramount importance to have daily 4D imaging. This would enable the detection of those variations and ideally allow their correction with treatment adaptation (Hoffmann et al 2017, Jakobi et al 2017, Tseng et al 2018, Albertini et al 2020), so that the full potential of IMPT can be exploited. Consequently, daily dose reconstructions including the geometry and breathing curve of the day are highly desired, but not yet accessible in clinical practice. Current approaches rely on weekly 4D computed tomography (4DCT) acquisitions and offline adaptations (Meijers et al 2020a). It would thus be beneficial to use cone beam computed tomography (CBCT) images, which are routinely acquired in the scope of image-guided PT for patient positioning, to reconstruct the delivered fraction dose.
While the CBCTs acquired for patient alignment show the anatomy of the day in treatment position, they cannot be used directly for proton dose calculation due to inaccurate CT numbers. Utilising CBCT scans (Rit et al 2016, Veiga et al 2016, Landry and Hua 2018) for proton dose calculation has seen considerable interest for anatomical sites unaffected by respiratory motion (Kurz et al 2015, Landry et al 2015, Veiga et al 2016, Thummerer et al 2020, Lalonde et al 2020), as it further offers the benefit of neither increasing the dose burden nor requiring additional appointments for CT scanning.
Using CBCT for dosimetric evaluation necessitates image quality enhancements, which can be achieved through the correction of artefacts, occurring due to scatter detection (Siewerdsen and Jaffray 2001), detector lag and ghost (Siewerdsen and Jaffray 1999), beam hardening (Thing et al 2016), and scatter glare (Poludniowski et al 2011). Correction methods depend on a wide range of techniques such as look-up tables (Kurz et al 2015), Monte-Carlo calculations (Mainegra-Hing and Kawrakow 2010, Thing et al 2016, Zöllner et al 2017) or image registration (Landry et al 2015, Veiga et al 2016, Wang et al 2016). A deformable image registration (DIR) of the CT to the CBCT results in a virtual CT (vCT) (Peroni et al 2012), yielding sufficient image quality for PT dose calculation in the H&N region, but which fails for entities with more anatomical changes from fraction to fraction (Kurz et al 2016). To overcome those geometrical errors, the vCT along with the measured CBCT projections are used as input data for a so-called scatter correction algorithm (SCA), which in fact corrects all low frequency discrepancies such as scatter and beam hardening (Zöllner et al 2017). The SCA applied in this contribution, using a vCT prior, is based on works by Niu et al (2010), Park et al (2015). It results in a scatter corrected CBCT (CBCTcor) with suitable quality for proton dose calculations (Park et al 2015, Kurz et al 2016, Kim et al 2016, Botas et al 2018, Kim et al 2020, Andersen et al 2020) and has also been successfully applied for photon therapy (Hofmaier et al 2017). Furthermore, (Zöllner et al 2017) showed that the scatter estimate from the SCA approaches the expected values from a Monte Carlo simulation. Nevertheless, the feasibility of CBCT scatter correction in 4D, where new challenges, such as sparse projection data per breathing phase occur, has not yet been shown.
More recent methods for CBCT correction have been extended to tumour entities affected by intra-fractional motion in the thoracic region. Veiga et al (2016) showed range-corrected dose distributions on vCTs using 3D averaged images of lung cancer patients. Niepel et al (2019) extended the vCT approach to 4D by performing 4DCT to 4D cone beam computed tomography (4DCBCT) registration, using photon therapy CBCT scanners and iterative CBCT reconstruction by Hansen and Sørensen (2018). Bondesson et al (2020) applied a similar 4D approach to data from a PT CBCT scanner, using a different reconstruction approach by Mory et al (2016). Furthermore, in a study on simulated CBCT projections, Shrestha et al (2019) reconstructed a motion-compensated 4DCBCT on which carbon ion dose calculation was feasible, by deforming each phase-specific image and matching its position to that of the reference phase.
The objective of this study was to extend the 3D SCA approach to 4D by making use of our previous work on 4DvCT (Niepel et al 2019, Bondesson et al 2020), to allow time-resolved dose calculation at each PT fraction in treatment position. We extend the SCA of projections to a novel phase-based 4DCBCT correction method, referred to as 4DCBCTcor. As a first proof of principle, the method was evaluated using a porcine lung phantom, injected with simulated lesions, with reproducible but realistic breathing motions (Biederer and Heller 2003). The phantom was used to obtain 4DCT images in two different respiratory motion patterns. One simulated a breathing pattern for planning and was used as input for 4DvCT generation, while the other was identical to the one present at the time of CBCT scanning, thus providing a ground truth for evaluation. Lesion-specific robust treatment plans, optimised on the average ground truth CT, were recalculated on all phases of both 4DCBCTcor and the ground truth 4DCT.
The accuracy of the 4DCBCTcor was evaluated by analysing images and quantitative deviations of CT numbers to the corresponding reference 4DCT. Accumulated and phase-per-phase dose distributions were compared by means of dose-volume histograms (DVHs) and gamma pass-rates (PRs). Additionally, the 4DvCT generated within the SCA workflow was compared to 4DCT in a similar fashion.
2. Material and methods
2.1. Data acquisition
Image acquisition was carried out with a 4D artiCHEST phantom (PROdesign GmbH, Germany), consisting of two hard plastic layers, the outer one filled with water, the inner one filled with an ex vivo porcine lung, and a water-filled diaphragm. The latter were covered with ultrasound gel to ensure motion with reduced friction. A pressure pump, which drove the diaphragm, could be manually set to realistic values for the breathing rate and amplitude (Biederer and Heller 2003). The phantom is displayed in Rabe et al (2021), where a more comprehensive description is outlined. Four tumours of different sizes were mimicked by injecting a gelatin-water mixture (mass concentration = 0.3 g ml−1) into the lung. The volumes of the tumours ranged from 16 to 20 cm3, being comparable in size to stage T1 or T2 NSCLC lesions (Edge and Compton 2010).
The on-board CBCT imaging system of an Elekta Synergy linac (XVI 4.5.1, Elekta, Sweden) was used for 4 min moving 4DCBCT acquisitions with a shifted detector (tube voltage = 120 kVp, tube current = 32 mA, exposure time = 20 ms, collimator = M20, filter = F1, #frames = 1320, 512 × 512 pixels, and pixel size of 0.8 mm). The exposure time and tube current were adjusted to avoid saturation and loss of object edge as described by Niepel et al (2019). Additionally, a Toshiba Aquilion LB (Canon Medical Systems, Japan) CT scanner was used to acquire 4DCTs with a reconstruction grid of 1.074 mm × 1.074 mm × 2 mm. The breathing signal of the 4D phantom was recorded with an Anzai belt (Anzai, Japan) and a dedicated adapter.
Changing the vacuum level in the cavity of the phantom and the pressure amplitude, used for inflating the diaphragm, provided the possibility to achieve different specific patient-like breathing curves, as the lung could be inflated and moved to a varying degree. The settings we employed generated a breathing motion of the lung with a respiration rate of 11 breaths per minute. The vacuum pump as well as the diaphragm pressure amplitude were set to obtain a large amplitude for the planning motion (plan) and a smaller one for the day-of-treatment reference motion (ref) to acquire moving images in two different configurations. A total data set containing two 4DCT scans of the moving phantom (plan and ref, respectively) with 10 phases each and one moving day-of-treatment CBCT was acquired in a single measurement session of 3.5 h. Figure 1 shows CT images of the extreme phases for both motions. Between the inhale and exhale phases the centroid positions of the injected tumours moved 2.3 mm, 3.3 mm, 5.8 mm, and 5.5 mm for the ref CT data set and 1.7 mm, 3.5 mm, 10.7 mm, and 10.8 mm for the plan CT data set, respectively.
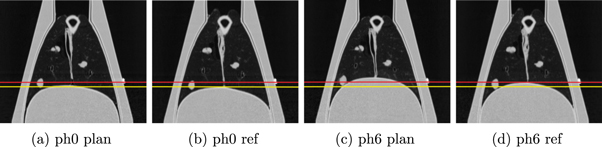
Figure 1. 4DCT images of the inhale (phase 0) and exhale (phase 6) phases of the two different motions (plan and ref) are displayed with level = −300 and window = 1600. The inhale phases in both motions (a), (b) were comparable, while the exhale phases showed the intended larger amplitude for the planning motion (c), (d). For better comparability, two horizontal lines indicate the diaphragm position of the respective reference motion.
Download figure:
Standard image High-resolution image2.2. 4DCBCTcor workflow
The workflow depicted in figure 2 was adjusted from the 4DvCT generation workflow, implemented in OpenREGGUI (https://openreggui.org/) and used by Bondesson et al (2020). 4DCT planning images and day-of-treatment 4DCBCT projections, equidistantly separated into 10 phases, were used as input for the 4DvCT workflow. Utilising a 3D Feldkamp, Davis, and Kress (FDK) algorithm (Feldkamp et al 1984), implemented in the reconstruction toolkit (RTK) (Rit et al 2014), a static average 3DCBCT image was reconstructed with 410 × 410 × 264 voxels on a 1 mm × 1 mm × 1 mm grid from the projections. Subsequently, an average CT obtained from the 10 4DCT phases was rigidly registered onto the 3DCBCT. With the help of this alignment, each of the 10 4DCT phases was transferred to the CBCT space.
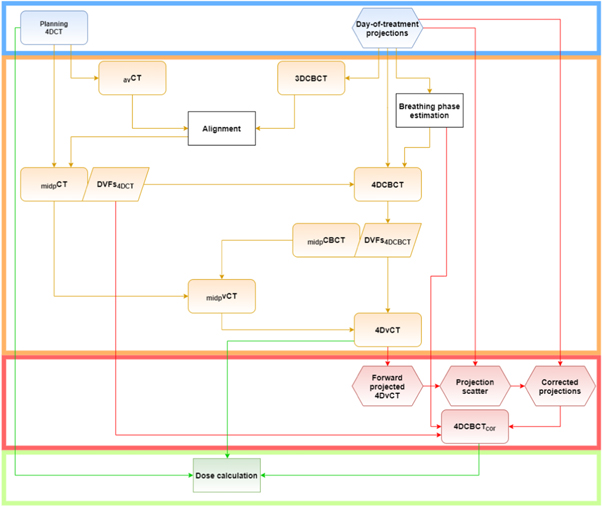
Figure 2. Sketch depicting the most important steps of the complete workflow from input (blue box), via 4DvCT (orange box) and 4DCBCTcor (red box) to the final dose calculation (green box). Rounded rectangles show images, hexagons represent projections, rectangles stand for actions, and parallelograms for DVFs.
Download figure:
Standard image High-resolution image2.2.1. Mid-positioning
A mid-position image (Wolthaus et al 2008a) of the 4DCT (midpCT) was used as a starting point of this workflow because of reduced motion artefacts.
The maximum expiration phase was chosen as reference phase, since the least artefacts were expected there due to minimal motion. Deformation vector fields (DVFs) from each 4DCT phase with respect to the reference phase were determined using DIR. All DIRs were performed using a diffeomorphic Morphons algorithm (Janssens et al 2011) with 8 resolution scales. The number of iterations of the scales was set to 2 and 5 for the finest and second finest scales and 10 for the 6 coarsest scales. Additionally, a Gaussian regularisation of 1.25 mm standard deviation was applied. The parameters are similar to previous studies performing CT to CBCT DIR for the lung (see supplementary material of Veiga et al (2016) available online at stacks.iop.org/PMB/66/175022/mmedia). Averaging these 10 DVFs yielded the mean motion vector field. The inverse mean motion vector field composed with each of the 10 DVFs with respect to the reference phase generated 10 DVFs with respect to the mean position. Applying this new set of DVFs (DVFs4DCT) to the corresponding 4DCT transformed each phase to the time-weighted mean position. The median of these phases yielded the motion-compensated midpCT.
2.2.2. 4DCBCT reconstruction
In order to extract the respiratory signal from the 4DCBCT projections, the following steps of the Amsterdam Shroud algorithm (Zijp et al 2004) were performed. On the original projection images, a logarithmic transform and superior-inferior derivative were conducted to enhance features in this direction, e.g. the diaphragm. Transversely summed pixels of all projections were concatenated to generate a 2D Amsterdam Shroud image, which was cropped to show only the main oscillatory signal. The phase of the analytic signal was used to determine the breathing phases. The measured CBCT projections, the breathing phases, and the 4DCT velocity fields from the mid-positioning were input data for 4DCBCT reconstruction (see the supplementary material for Amsterdam shroud image and corresponding extracted breathing phase).
The MA-ROOSTER (Mory et al
2016) optimisation algorithm implemented in RTK (Rit et al
2014) compromises between respiration-correlated techniques, showing high-contrast yet significant streaks and motion-compensated methods, which are less affected by streaks with the drawback of fully relying on a motion prior or estimate to reconstruct a single 3DCT image. MA-ROOSTER is based on ROOSTER, which uses a 4D conjugate gradient approach, that minimises the cost function  , where R is a forward projection operator, S is an interpolator along the time dimension, f is a vector containing the 3D image volumes f1, f2, ...fN
, N is the number of phases, p is the measured projection, and α is the projection index. ROOSTER uses a motion mask, corresponding to a segmented region with expected movement, and therefore removing motion outside of it. Additionally, MA-ROOSTER bends the temporal regularisation to follow moving structures, so that neither small structures are smoothed away nor high-intensity structures are spread to adjacent phases.
, where R is a forward projection operator, S is an interpolator along the time dimension, f is a vector containing the 3D image volumes f1, f2, ...fN
, N is the number of phases, p is the measured projection, and α is the projection index. ROOSTER uses a motion mask, corresponding to a segmented region with expected movement, and therefore removing motion outside of it. Additionally, MA-ROOSTER bends the temporal regularisation to follow moving structures, so that neither small structures are smoothed away nor high-intensity structures are spread to adjacent phases.
Using the same dimension and spacing settings as for the 3DCBCT reconstruction and the DVFs4DCT, the 4DCBCT reconstruction was performed with regularisation parameters γspace = 5 · 10−4 and γtime = 6.5 · 10−4.
γspace controlled the spatial 3D total variation for denoising the image, larger values favouring images with a lower spatial total variation (i.e. less noise). Similarly, γtime controlled the weight given to temporal 1D total variation but after warping the images according to the DVFs which favour 4DCT images describing the same motion as the one described by the DVFs for increasing γtime.
2.2.3. 4DvCT generation
The 4DCBCT mid-position image was generated analogously to the 4DCT, yielding the mid-position CBCT (midpCBCT) and DVFs4DCBCT. Subsequently, applying DIR with the same settings as described in section 2.2.1, the midpCT(plan) was registered onto the midpCBCT(day-of-treatment) yielding a mid-position vCT (midpvCT). The inverted DVFs4DCBCT were applied subsequently onto the midpvCT to obtain a 4DvCT. This workflow was previously presented and evaluated in Bondesson et al (2020).
2.3. Scatter correction
The SCA was based on works by Park et al (2015) and Niu et al (2010). It was conducted on a per-phase level, meaning that the inputs were a single phase of the 4DvCT and the corresponding 4DCBCT projections

where Iraw,α is the total intensity measured by the CBCT detector and I0 is the open field intensity. The raw intensity (Iraw,α ) consists of a scatter component (Isca,α ) and a primary component (Ipri,α ). The latter was calculated by applying the forward projection operator R to the vCT phase according to the CBCT geometry using RTK and was assumed to be scatter-free. Accounting for the tube current-exposure time (mA s) per projection, a correction factor of 4.0, defined as the ratio of a reference value mAs (tube current = 64 mA, exposure time = 40 ms) and the measured CBCT acquisition mAs (32 mA, 20 ms), was multiplied with Iraw,α . Subtracting these projections from each other and convolving them with a generous smoothing filter (F), as described in Kurz et al (2016), led to projection scatter (Isca,α )

Subtracting Isca,α from the measured Iraw,α generated corrected projections (Icor,α )

Applying this successively to all of the 10 phases, a set of corrected projections was obtained. Utilising MA-ROOSTER, the log-transformed corrected projections ( ) were reconstructed to the 4DCBCTcor, analogously to the 4DCBCT, with the same vector fields and settings.
2.4. Treatment planning
The day-of-treatment 4DCT dataset was aligned to the CBCT space as described in section 2.2. All ten phases of the day-of-treatment 4DCT, 4DvCT, and 4DCBCTcor, using the same generic CT density calibration curve, were transferred to the research version 8.99 of the commercial treatment planning system RayStation (RaySearch Laboratories, Sweden), on which treatment was planned. We used a beam model corresponding to a generic IBA pencil beam scanning beamline and nozzle ('RSL_IBA_DED'). The four different simulated tumours were contoured on all 4DCT phases. For all lesions, internal target volumes (ITVs) were created, which were then copied to the average CT. A density override of each ITV was performed using muscle tissue with a density of 1.05 g cm−3 (Meijers et al 2020a, Ribeiro et al 2021).
For each of the four ITVs, a 3D robust optimised pencil beam scanning proton treatment plan administering 60 Gy in 30 fractions with a 3-field arrangement was created on the average CT. The field angles were set to avoid sharp edges and screws of the phantom. The beams were optimised simultaneously. The specific angles are stated in the supplementary material. The Monte Carlo dose engine was used during plan optimisation with a statistical error of 1%. Following (Meijers et al 2020a), the clinical robustness settings (range error = ±3%, setup error = ±6 mm) were used. The robust optimisation used a minmax method, in which the worst-case scenario regarding the optimisation functions is considered (Fredriksson et al 2011). Each IMPT plan fulfilled the clinical goal of at least 95% volume above 57 Gy and was optimised using a constant relative biological effectiveness of 1.1 (Paganetti et al 2002). Subsequently, all four plans were re-computed on every phase and modality (day-of-treatment 4DCT, 4DvCT, 4DCBCTcor) without density override, generating a total of 120 different dose distributions.
2.5. Computer hardware
DIR, reconstruction, and filtering were performed on a computer with two Intel Xeon E5-2630 v3 processors at 2.4 GHz with each having 8 physical cores and hyper-threading enabled, resulting in a total of 32 threads. The GPU was a Nvidia Quadro P6000 with 24 GB memory.
2.6. Data analysis
Figure 3 shows an overview relating the different data sets to each other. The blue coloured boxes represent the data sets, which would be typically acquired in a clinical setting. The red background colour represents the image sets, which were generated as explained in section 2.2. In order to assess the accuracy of these generated images an additional 4DCT, shown in orange, was acquired with the same day-of-treatment breathing motion as the 4DCBCT, which was different to the motion of the initial planning 4DCT.

Figure 3. Scheme relating different data sets (clinically acquired in blue, generated in red, and reference in orange) to each other.
Download figure:
Standard image High-resolution imageThe image quality of the different 4D modalities was analysed using difference plots and mean error (ME) calculations in terms of CT numbers in Hounsfield unit (HU) with the day-of-treatment 4DCT as reference. The 4DvCT and 4DCBCTcor methods were further evaluated by comparing DVH parameters (D2%, D98%, Dmean,ITV, Dmean,lung) and calculating global gamma PR using (3%, 3 mm) and (2%, 2 mm) criteria with a 10% dose threshold for lesion-specific robust proton plans versus day-of-treatment reference 4DCT for individual phases and accumulated doses. Accumulated doses were calculated for each 4D image and ITV of each lesion. The accumulation was done by applying the DVFs4DCT to the respective 4DCT phase doses and the DVFs4DCBCT to the respective phase doses of 4DvCT and 4DCBCTcor and averaging the results.
3. Results
3.1. Comparison between different modalities
Figure 4 displays an exemplary sagittal slice of 4DCT(ref), 4DCBCT, 4DvCT and 4DCBCTcor for phases 0 (inhale), 3 and 6 (exhale) as well as corresponding image differences. Quality enhancements in 4DvCT and 4DCBCTcor compared to 4DCBCT were observed. The 4DvCT showed the expected low-noise images similar to the 4DCT. Both the 4DvCT and 4DCBCTcor showed good agreement to the 4DCT in regions of homogeneous tissue. At boundaries, such as the diaphragm-lung interface, differences of more than 100 HU were observed.
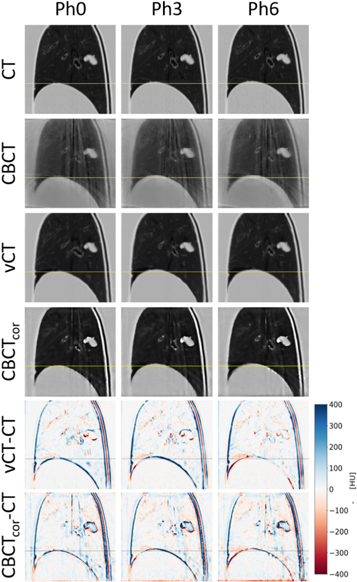
Figure 4. Phase 0 (inhale), phase 3 and phase 6 (exhale) are shown with level = −300 and window = 1600 for 4DCT, 4DCBCT, 4DvCT and 4DCBCTcor. Additionally, the differences 4DvCT-4DCT and 4DCBCTcor-CT are displayed.
Download figure:
Standard image High-resolution image3.1.1. Line profiles
Figure 5 shows two line profiles for all modalities for the inhale and exhale phases in the inferior–superior direction as indicated with the yellow arrows on the thumbnails on top of each plot. Both plots show similar behaviour in CT numbers for CT, vCT, and CBCTcor. The original CBCT with non-corrected HU systematically underestimated the diaphragm (left side of the plots), tumour (centre of the plots), and shell (right side of the plots) values by around 200 HU to the reference CT, while it overestimated the values in lung tissue by roughly the same amount. At the edges of the diaphragm and the outer shell, as well as inside the tumour, CBCTcor consistently overestimated HU values compared to CT and vCT.
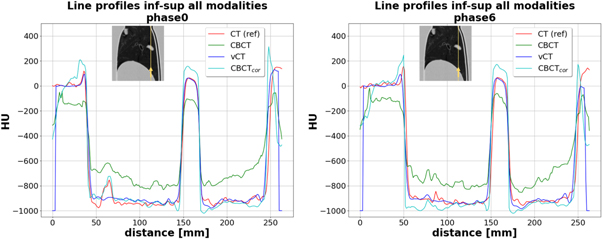
Figure 5. Line profiles displaying HU versus distance along the yellow line in mm in inferior–superior for the modalities CT, CBCT, vCT, and CBCTcor of the inhale (phase 0) and exhale (phase 6) breathing phase. Thumbnails are displayed with level = −300 and window = 1600.
Download figure:
Standard image High-resolution image3.1.2. Mean error
Figure 6 shows three different ME plots in HU versus phase for the three contours lung, body (whole phantom), and outer shell. Each sub-figure compares the reference CT with one of the three remaining images. The top right sub-figure, comparing CT and original CBCT, shows substantial discrepancies as expected. The two bottom sub-figures showed similar results with reduced deviations. The ME differences for the lung contour, which varied in absolute terms between close to 0 and slightly above (vCT) or below (CBCTcor) 10 HU, changed sign for phases close to the exhale phase 6. Consequently, the body contour, which was the union of lung and shell, showed reduced errors close to the maximum breathing amplitude. The values of the shell remained approximately constant throughout all different phases with difference values of around 10 HU (vCT) and 15 HU (CBCTcor), respectively.
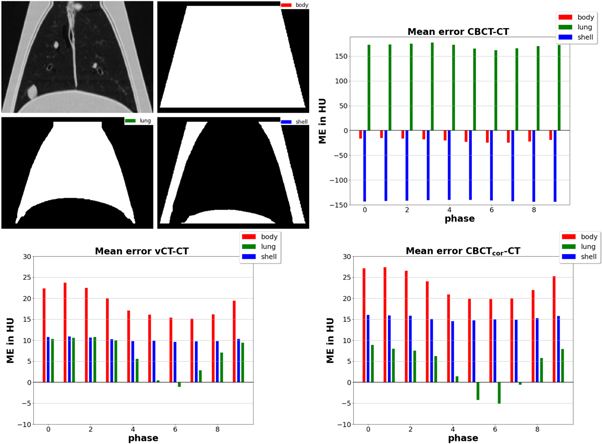
Figure 6. Plots showing mean error in HU versus breathing phases for three different contours, which are displayed on the top left. The CT numbers were subtracted from CBCT, vCT, and CBCTcor. For better readability, the ordinate is rescaled to a smaller range for the vCT and CBCTcor cases.
Download figure:
Standard image High-resolution image3.2. Proton dose analysis
Figure 7 displays axial slices of proton dose distributions of the ITV4 plan, calculated on phases 0, 3, and 6 of CT, vCT, and CBCTcor. Additionally, dose difference plots between vCT and CBCTcor to CT are shown. A good agreement was observed for vCT and CBCTcor. Only minor deviations of a few percent between reference CT images and generated vCT and CBCTcor and within different phases were found.
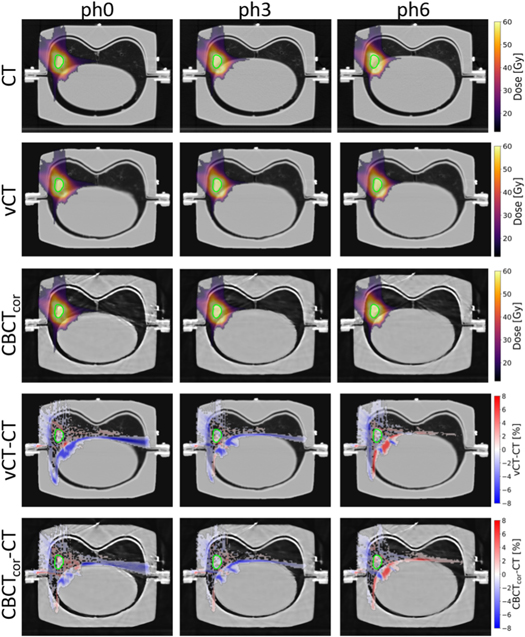
Figure 7. Proton dose distributions of ITV4 are displayed. To improve clarity, no values below 15 Gy are shown in the CT, vCT, and CBCTcor cases. For better readability, of the difference plots vCT and CBCTcor to the CT (expressed as a percentage of the prescribed dose), absolute dose differences smaller than 0.4% are masked. The CTs are shown with level = −300 and window = 1600 for phase 0 (inhale), phase 3, and phase 6 (exhale).
Download figure:
Standard image High-resolution image3.2.1. Dose-volume histograms
DVHs for exemplary ITV4 and the lung are presented in figure 8 for inhale and exhale phase and the accumulated dose. The images confirm good agreement in all scenarios. On the right tail of the DVH curve of ITV4, slightly larger dose values for vCT and CBCTcor were seen on both extreme phases. Overall smaller deviations were detected for the lung. For ITV4, the vCT-CT difference ΔD2%, ΔD98% are for phase 0 –1.0%, −1.0%, for phase 6 0.1%, −0.5% and for the accumulated dose 0.2%, 0.1%. The corresponding values for the CBCTcor-CT difference are for phase 0 –0.7%, −0.5%, for phase 6 –0.2%, −0.7% and for the accumulated dose 0.0%, 0.8%.

Figure 8. Dose-volume histograms of ITV4 and lung for CT, vCT, and CBCTcor of the extreme phases and the accumulated dose.
Download figure:
Standard image High-resolution image
Table 1 displays differences in DVH parameters for accumulated dose calculations on vCT and CBCTcor to the corresponding CT. The values confirmed the good agreement as ΔD2% and ΔD98% were not larger than 2% for all vCT and CBCTcor comparisons with respect to the CT. Mean dose values for ITV and lung had a maximum deviation of 1.3% over all cases.
Table 1. Relative differences between accumulated dose on vCT and CBCTcor to CT in D2%, D98%, Dmean,ITV and Dmean,lung for all plans. All dose difference values are displayed in percent.
| vCT | CBCTcor | vCT | CBCTcor | ||||
|---|---|---|---|---|---|---|---|
| ITV1 | ITV2 | ITV1 | ITV2 | ITV1 | ITV2 | ITV1 | ITV2 |
| ITV3 | ITV4 | ITV3 | ITV4 | ITV3 | ITV4 | ITV3 | ITV4 |
| ΔD2% | ΔD98% | ||||||
| 1.7% | −0.1% | 2.0% | −0.2% | 1.3% | 1.2% | 1.6% | 1.4% |
| 0.4% | 0.2% | −0.1% | 0.0% | 0.8% | 0.1% | 0.9% | 0.8% |
| ΔDmean,ITV | ΔDmean,lung | ||||||
| 0.9% | 0.4% | 1.0% | 0.4% | 1.1% | 1.3% | 1.0% | 1.2% |
| 0.3% | −0.1% | 0.4% | 0.0% | −1.2% | 1.0% | −0.5% | 0.6% |
Quantitative results regarding the proton dose comparison are summarised in table 2, displaying gamma PR for accumulated doses of vCT and CBCTcor compared to CT for two gamma criteria and all four plans. The gamma PR for vCT and CBCTcor were between 97% and 100% for a (3%, 3 mm) criterion and between 93% and 98% for a (2%, 2 mm) criterion. DVH parameters and gamma PR results on a per-phase level are shown in the supplementary material.
Table 2. Gamma-index PR in percent for two different global criteria with a fixed dose threshold of 10%. The accumulated doses of vCT and CBCTcor were compared to the corresponding dose values on CT.
| vCT | CBCTcor | vCT | CBCTcor | |
|---|---|---|---|---|
| Plan | (3%, 3 mm) | (2%, 2 mm) | ||
| ITV1 | 97.3 | 98.3 | 93.4 | 94.2 |
| ITV2 | 98.7 | 99.3 | 93.2 | 95.5 |
| ITV3 | 97.6 | 98.4 | 94.7 | 95.7 |
| ITV4 | 99.7 | 99.7 | 97.5 | 97.9 |
4. Discussion
A novel algorithm for 4DCBCT correction, which is based on 4DvCT, was successfully implemented and evaluated. The acquisition of CT and CBCT scans of the porcine lung phantom, with a reproducible breathing motion in a geometry similar to the human thorax, allowed for a 4DCT ground truth image and thus the experimental evaluation of the 4DCBCTcor method and comparison to the intermediate 4DvCT step. Proton dose calculation was feasible and accurate on both 4DvCT and 4DCBCTcor for the porcine lung phantom scans. The 4DCBCTcor was evaluated in the context of PT for the first time. Accumulated doses calculated on the 4DvCT and 4DCBCTcor were in good agreement with those calculated on the reference 4DCT. DVH parameter comparisons deviated at most 1.7% in the 4DvCT and 2.0% in the 4DCBCTcor case, respectively. Additionally, gamma PR for a (3%, 3 mm) criterion with 10% threshold were at least 97.3% (4DvCT) and 98.3% (4DCBCTcor). The motion amplitude between inhale and exhale for the centroid positions of the simulated tumours ranged from 2.3 to 10.8 mm, which is in accordance to the range typically observed in clinical routine (Wolthaus et al 2008b). The observed dose calculation accuracy was very similar between the four different simulated tumours, which were distributed in the lung and had different extents of motion.
Measuring doses would be of interest but remains challenging due to the closed shell of the porcine phantom. A study by Mann et al (2016) investigated the same porcine phantom in combination with a dosimetric gel. This MRI study reported a high agreement between measured and calculated doses while achieving a homogeneous coverage of the PTV. The measurements showed a gamma PR between 87.4% and 94.4% for a (3%, 3 mm) criterion.
A range analysis was not conducted since small differences become extensive in lung tissue, due to its low density. The DVH and gamma analysis results are comparable to those reported by Shrestha et al (2019) for a 4DCBCT carbon-ion lung cancer study, which used simulated projections and a motion-compensated reconstruction algorithm. Furthermore, the DVH analysis and gamma PR showed good agreement to previous 4DvCT studies. Niepel et al (2019) used a different reconstruction (Hansen and Sørensen 2018) and vCT generation approach which relied on phase-per-phase CT to CBCT Morphons DIR; they obtained phase-specific (3%, 3 mm) PR above 95% for a two-field plan and did not consider accumulated doses. Bondesson et al (2020) applied the 4DvCT algorithm used in this work to a PT-specific CBCT scanner and obtained accumulated dose (3%, 3 mm) PR > 95%. Both studies did not use injected simulated tumours but used residual tissues as surrogates.
It should be noted that, in our study, DVH difference values were in most cases slightly larger for the 4DCBCTcor than the 4DvCT, whereas for the gamma PR slightly larger values were achieved with the 4DCBCTcor. These minor differences of a few tenths of a percent can likely be explained by the difference in regions of interest. DVHs relate to voxels inside specific organs, while the gamma evaluation covers the dose volume covered by the 10% isodose.
For 4DCBCTcor, it should be stressed that large anatomical changes, which DIR cannot always model accurately, could not be simulated in our experimental setup. Consequently, we could not demonstrate the better anatomical fidelity for CBCTcor over vCT reported by Kurz et al (2016), who analysed the difference of 3DCBCTcor and 3DvCT by comparing the contours of PTV, CTV, bladder, and rectum to reference contours made on the initial 3DCBCT. The 3DCBCTcor-based contours showed an improved agreement with the reference 3DCBCT contours over the 3DvCT ones, which were hampered by inaccurate DIR.
Since tumour shrinkage and pleural effusion might be difficult to model by DIR, it is likely that 4DCBCTcor is beneficial in such scenarios. Cavity correction steps, which address these limitations of DIR, have been proposed by Veiga et al (2016) and would be needed for 4DCBCTcor.
Similar visual improvements were observed in studies of static targets (Park et al 2015, Kurz et al 2016) in 3D, although one should keep in mind that these studies relied on FDK reconstructions. Additionally, the reported gamma PR of these patient studies were in the same order of magnitude as in our study. Kurz et al (2016) values are not directly comparable as different regions were investigated. However, Park et al (2015) reports for lung 98.6% (3%, 3 mm) and 93.0% (2%, 2 mm), which is similar to our values.
The constant overshoot of CT numbers in the 4DCBCT images might originate from differences in the x-ray spectra, beam hardening, and spectral response of the CT and CBCT, which might not be perfectly captured by our scatter correction approach. Overshoot observed at the edges of the tumour and the shell, might also be caused by the DIR and the resampling steps, leading to a slight blurring of the vCT images used for generating CBCTcor. However, the different impact of these effects cannot be resolved within our experimental set-up and thus remains unknown.
By applying different breathing motions for the planning and reference states, we could show that the DIR can be employed successfully, yielding good geometric agreement between the 4DvCT and reference 4DCT images. Minor, yet perceptible, misalignments of diaphragm and shell were visible in our study. These residual mismatches led to divergences at boundaries such as the diaphragm-lung interface (see figure 4). Nevertheless, the feasibility of deforming a 4DCT into a 4DvCT with updated motion, which can be used as a prior for scatter correction eventually yielding the 4DCBCTcor, can be concluded.
As stated above, the porcine lung phantom, having a constant breathing pattern and non-varying anatomy, is an ideal tool for proof-of-principle studies, as demonstrated in various applications such as MR motion tracking (Rabe et al 2021) or proton radiography-based range uncertainty assessment (Meijers et al 2020b). However, the workflow has to be evaluated with clinical data of lung patients in a next step. Lung cases with changing tumour sizes over the course of the treatment, which as stated above could not be simulated in this study, would be of particular interest.
However, studies with patient data usually lack ground truth information as the same reproducible breathing motion and patient setup between the different acquisitions cannot be provided. The phantom allows to comprehensively evaluate the method before applying it to patient cases. This stresses the value of first performing proof-of-principle phantom studies (Landry et al 2014).
When applied to patient data, the 4DCBCTcor method would allow dose reconstruction by splitting the dose plan into different phases similar to Ribeiro et al (2021). This offers the advantage to account for the interplay between respiratory motion and pencil beam delivery in the geometry of the patient setup right before treatment and may permit protocol robustness evaluation without the need of additional 4DCT scans. Furthermore, this method would have the potential to be used for daily online dose adaptation in the future.
Before application in clinical online scenarios, the needed computation time would have to be addressed. In this proof-of-concept study, no special effort was made to accelerate the computation, resulting in runtimes of roughly 4 h for the entire workflow. The 4DvCT workflow, as a prerequisite of the 4DCBCTcor workflow, currently takes roughly 3.5 h. The successive 4DCBCTcor workflow, whose runtime again is not optimised, currently needs around 30 min. Current bottlenecks are DIRs using a Morphons algorithm, 4DCBCT and 4DCBCTcor reconstructions using MA-ROOSTER, and filtering during the scatter correction, which needs to be conducted separately for each phase. Further overall parallelisation and GPU-based filtering could speed up the process. Another promising approach would be to use deep learning also in 4D since it was successfully applied to 3DCBCT correction scenarios in the last years (Hansen et al 2018, Kurz et al 2019, Landry et al 2019, Thummerer et al 2020, Chen et al 2020a).
5. Conclusions
In this work, a 4DCBCTcor technique, based on a phase-per-phase scatter correction, which uses a 4DvCT as a prior, has been investigated for proton dose calculations on porcine lung phantom data. The results of this experimental validation study for 4DCBCTcor showed usability for accurate proton dose calculation. A similar performance was observed for the 4DvCT. The applied method generates up-to-date in-room images, accounting for breathing motion and potentially anatomical changes, and is thus of clinical interest for daily 4D proton dose estimation.
Acknowledgments
Katharina Niepel, Jan Hofmaier, and Vanessa Filipa da Silva Mendes are thanked for support related to CBCT projection acquisition. This work was supported by the German Research Foundation (DFG) project number 399 148 265 and Research Training Group GRK 2274, as well as by the FöFoLe commission of the Medical Faculty of the LMU Munich under grant 1056.