

Abstract
Recently, proton therapy treatments delivered with ultra-high dose rates have been of high scientific interest, and the Faraday cup (FC) is a promising dosimetry tool for such experiments. Different institutes use different FC designs, and either a high voltage guard ring, or the combination of an electric and a magnetic field is employed to minimize the effect of secondary electrons. The authors first investigate these different approaches for beam energies of 70, 150, 230 and 250 MeV, magnetic fields between 0 and 24 mT and voltages between −1000 and 1000 V. When applying a magnetic field, the measured signal is independent of the guard ring voltage, indicating that this setting minimizes the effect of secondary electrons on the reading of the FC. Without magnetic field, applying the negative voltage however decreases the signal by an energy dependent factor up to 1.3% for the lowest energy tested and 0.4% for the highest energy, showing an energy dependent response. Next, the study demonstrates the application of the FC up to ultra-high dose rates. FC measurements with cyclotron currents up to 800 nA (dose rates of up to approximately 1000 Gy s−1) show that the FC is indeed dose rate independent. Then, the FC is applied to commission the primary gantry monitor for high dose rates. Finally, short-term reproducibility of the monitor calibration is quantified within single days, showing a standard deviation of 0.1% (one sigma). In conclusion, the FC is a promising, dose rate independent tool for dosimetry up to ultra-high dose rates. Caution is however necessary when using a FC without magnetic field, as a guard ring with high voltage alone can introduce an energy dependent signal offset.
Export citation and abstract BibTeX RIS
1. Introduction
Due to the depth dose characteristics of charged particles, proton therapy allows for enhanced sparing of normal tissue compared to conventional radiation. Most conformal dose distributions are achieved with proton pencil beam scanning. Thorough commissioning and quality assurance of the proton gantry is important to guarantee repeatable and safe dose delivery to the patient. For each pencil beam, monitors in the gantry nozzle are used to control and check the deposited dose respectively (Pedroni et al 2011). These monitors measure the pencil beam intensity in monitor units (MU, arbitrary unit), which need to be calibrated to the dose or the protons at iso-center. As such, two calibration methods exist (see for example Goma et al 2014, Palmans and Vatnitsky 2016): calibration in terms of absolute dose measured with an ionization chamber (dose/MU), and calibration in terms of proton fluence determined with a Faraday cup (FC) (protons/MU). The FC measures the charge deposited by the proton beam, which is directly proportional to the number of delivered protons, and is an important device not only for commissioning of proton therapy facilities, but also for regular monitor quality assurance.
Recently, proton therapy treatments delivered at ultra-high dose rates are becoming of high scientific interest. Ultra-high proton dose rates could substantially decrease treatment times, and as such could help to mitigate the treatment of mobile tumors by allowing delivery of individual fields within a single breath-hold (Gorgisyan et al 2017, Emert et al 2020). Furthermore, there is evidence that ultra-high dose rates could potentially lead to beneficial tissue sparing without compromising the tumor control due to the so-called FLASH effect. For electron treatments, this has been studied in detail in mice (Favaudon et al 2014, Montay-Gruel et al 2017), in mini-pig and cats (Vozenin et al 2019), and recently a first patient has been treated at FLASH dose rates with electrons (Bourhis et al 2019). Given their improved physical characteristics in comparison to electrons however, there is also a rapidly growing interest in FLASH therapy using protons (see for example treatment planning studies van de Water et al 2019, van Marlen et al 2020).
As such, high dose rate treatments are likely to become clinical reality in the next years, requiring developments in dosimetry and beam monitoring that can accurately deliver and measure such deliveries. In this context, the FC, the response of which is typically assumed to be independent of dose rate, is a promising tool to benchmark and characterize the dose rate dependence of beam monitors and field detectors. It has been employed by Diffenderfer et al (2020) for an IBA (Louvain-la-Neuve, Belgium) fixed beam line in a dedicated research room to validate dose rates measured with Markus chamber, and by Darafsheh et al (2020) to investigate FLASH dose rates for a Mevion Hyperscan facility.
The most simple FC design consists of a simple absorber block (the cup) which measures the proton charge (referred to as 'poor mans' FC in Cascio and Gottschalk 2009). On the opposite side of the spectrum, more sophisticated FC's operate under vacuum and include both magnetic and electric fields to minimize the obfuscating effect of secondary particles (Verhey et al 1979, Lin et al 2009), mainly electrons, which can originate from the vacuum window or escape the cup. Alternatively, FCs can also be operated with an electric field only (Grusell et al 1995), still under vacuum conditions.
The best settings of magnetic field and voltage have been investigated by Verhey et al (1979) for an 135 MeV proton beam for their specific FC. They concluded that '100% efficiency' could be achieved with a 100 G (10 mT) magnetic field, with the measured signal then being independent of the applied voltage. On the other hand, they observed a 0.5% efficiency reduction with no magnetic field and a zero voltage bias, which remained also in the presence of negative voltages. In contrast (Grusell et al 1995), recommend to apply a −1000 V voltage without magnetic field for a 174 MeV beam, and show a 4% signal reduction compared to no applied voltage. They estimated a possible systematic error of less than 0.3% when no magnetic field was applied, concluding that such a field was therefore unnecessary in their design. No measurements were performed to validate this assumption however. In addition, to prevent ionization of air molecules from influencing the measured charge, the FC is typically set under vacuum. Verhey et al (1979) measured the charge collected by the FC with a 'spoilt vacuum', showing that the signal strongly depends on the applied FC voltage.
Table 1 summarizes different FCs and their respective settings used at different centers. The table gives an overview on the geometric and material properties of the respective FCs, and on the operating conditions. Following on the work of Verhey et al (1979), the PSI FC is currently operated at maximum magnetic and electric field to ensure that secondary electrons do not influence measured charges. To our knowledge however, FC settings have to date not been investigated for different proton beam energies spanning the whole therapeutic range (70–230 MeV). Furthermore, the influence of different magnetic field strengths on FC response for different proton energies has not been systematically quantified.
Table 1. Faraday cups used at different centers.
| Institute | Investigation | Block material, thickness, diameter | Entrance vacuum window | Operating conditions | Comment | Difference to ionization chamber measurements | References |
|---|---|---|---|---|---|---|---|
| TERA Collaboration (Italy) | 62 MeV, voltage between—800 and + 800 V, stable response for voltages below—150 V | Aluminum, 3 cm, 7 cm | Mylar 0.05 mm | Vacuum (10−6 mbar), no magnetic field, guard ring (−300 V) | Measurements with non-homogeneous magnetic field were not reproducible | 3.4% | Cambria et al (1997) |
| Center Antoine-Lacassagne (France) | 62 MeV, voltage between −800 and 0 V, stable response for voltages below—200 V | Copper, 6 cm, 6 cm | Kapton 0.13 mm | Vacuum (10–4 mbar), no magnetic field, guard ring ( −400 V) | Agrees to the TERA FC within 1.5%–3.6% | 5% | Cambria et al (1997) |
| University Hospital Uppsala and Karolinska Institute Stockholm, (Sweden) | 60−226 MeV, voltage between −1500 and 0 V, stable response for voltages below—1000 V | Copper, 6 cm, 12 cm | Steel, 0.5 ±0.05 mm | Vacuum (10–7 mbar), no magnetic field, guard ring (−1200 V) | Magnetic field 'considered unnecessary in the present design which is intended for use with high-energy protons' | 6% | Grusell et al (1995), Almhagen and Grusell (2020 private communication, see acknowledgments) |
| Francis H. Burr Proton Therapy Center, Boston (US) | — | Brass, 6.35 cm, 12.57 cm | Kapton, 2 × 0.13 mm and steel, 0.91 mm | No vacuum, no magnetic field, no guard ring | 'Poor Man's Faraday Cup', 1%–5% difference to HCL FC | 7% that could be reduced to 4% | Cascio and Gottschalk (2009) Clasie et al (2012) |
| Harvard Cyclotron Laboratory (US) | 135 MeV, Voltage between −1000 and + 1000 V Magnetic field measurements with 10 mT (ground truth), and without magnetic field | Brass, 3.81 cm, 10 × 12 cm | 0.076 mm Al foil | No magnetic field, no voltage | 0.5% lower signal at operating conditions compared to ground truth | Verhey et al (1979), Cascio and Gottschalk (2009) | |
| PSI (Switzerland) | — | Brass, 10 cm, 12.7 cm | Aluminum foil | Vacuum (10–5 mbar), magnetic field (24 mT), guard ring (−900 V) | 3% | Winterhalter et al (2018), Goma et al (2014), Lin et al (2009) | |
Taking into account the somehow contrasting literature summarized above, and considering the increased use of FCs for ultra-high dose rate experiments, the authors are convinced that a more detailed analysis of the FC settings is of interest. As such, in this study, we first investigate the response of our FC to changes in electric and magnetic field for multiple beam energies. We then demonstrate that the response of the FC is indeed dose rate independent, which is important for the renewed interest in high- and ultra-high proton dose rate experiments. We finally present examples of clinical applications of a FC used for monitor calibration at high dose rates at our institute. Finally, we highlight the uncertainties when using such a device for monitor calibration, including measurement data taken over a 6 year time span.
2. Materials and methods
2.1. FC at PSI
The FC used at PSI (figure 1) is inspired by the design of Verhey et al (1979) and has been described in detail by Lin et al (2009). Protons are absorbed by a 10 cm thick brass absorber (enough to stop protons up to 250 MeV), is sealed by an aluminum foil entrance window and operates under vacuum (10–5 mbar). The 12.7 cm diameter entrance window is wide enough to collect proton beams with varying widths over the whole energy range. A negatively charged guard ring (maximum negative voltage −1000 V) and a magnetic field (24 mT) complete the design, with the latter overlapping both with the guard ring and the brass cup. The collected proton number is then simply determined by dividing the charge measured with an electrometer (dark current has been subtracted) by the proton elementary charge. For this study a Keithley electrometer (type 6517B) was used.
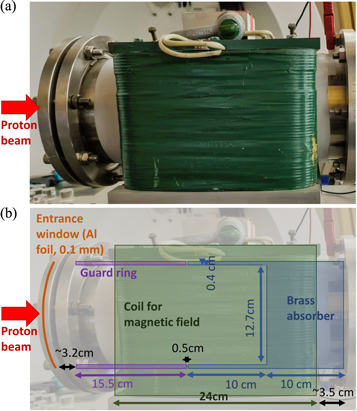
Figure 1. PSI Faraday cup, photo (a) and photo overlaid with a schematic drawing of the individual components (b). The magnetic field lines between the coils are oriented vertically (orthogonal to the beam direction).
Download figure:
Standard image High-resolution image2.2. Characterization of the FC response for different magnetic and electric field strengths
When using the FC, secondary electrons originating from the entrance window might contribute negatively to the measured proton charge, and electrons escaping from the brass absorber might add a positive bias to the measured proton charge. As such, a negatively charged guard ring between the vacuum window and the cup, as well as a magnetic field can be applied to minimize these contributions by averting secondary electrons from the entrance window and trapping electrons from the brass absorber.
To investigate the best settings of our FC, the FC response has been evaluated as a function of magnetic field (with no voltage), as well as for different applied voltages with both the magnet turned off and with maximum available magnetic field. Measurements were performed for four different energies, 250, 230, 150 and 70 MeV. The 250 MeV beam was delivered and measured in Gantry 1, which is described in detail in Lin et al (2009), while the remaining energies were tested in Gantry 2 (Safai et al 2012). The magnetic field has been measured with a Gaussmeter 410 (LakeShore Cryotronics) in the space between the magnetic field coils and the FC housing. The Hall probe has been oriented manually, such that the measured magnetic field is maximal. The magnetic field vectors within the FC, which are created by the field coils, are oriented in the vertical direction, orthogonal to the proton propagation direction.
All results have been normalized to the values measured with the maximum magnetic field (24 mT) and the maximum applied voltage of −1000 V. Therefore, the outcomes presented are expected to be independent from the Gantry (1 or 2), in which the measurements took place.
2.3. Clinical applications of the FC up to ultra-high dose rates
2.3.1. Dose rate dependency
The dose rate independency of the FC has been demonstrated by analyzing the proton current measured by the FC (ratio between the FC measured charge and delivery time recorded by the control system) for a 250 MeV beam for cyclotron currents up to 800 nA (corresponding to dose rates up to 1000 Gy s−1). Beam monitors used to measure the cyclotron current are ionization chambers suitable for high currents that give the instantaneous beam current (see Dölling et al 2007). These measurements have been performed on a gantry (Gantry 1) that has now been taken out of clinical operation and is currently being re-purposed for FLASH and ultra-high dose rates experiments (see Nesteruk et al 2021).
2.3.2. Dose rate response of a primary beam monitor
If dose rate independent, a FC is a useful device for independently assessing possible dose rate dependencies of other dosimetric devices. As such, during commissioning of a Varian ProBeam (VMS, Palo Alto, CA, US) gantry at our facility (Gantry 3), FC measurements have been performed to test the response of the primary dose monitor for dose rates of up to 30 Gy s−1 at the monitor level. Energies of 70 , 150 and 210 MeV were investigated, while delivering 10 MU/100 MU/1000 MU and varying the cyclotron current of 200–400 nA (70 MeV), 50−300 nA (150 MeV) and 25–200 nA (210 MeV), with the FC positioned at iso-center.
2.4. Consistency of primary beam monitor calibration
Finally, as FC measurements are a part of our periodic (3-yearly) Quality Assurance program, we have also been able to determine the consistency of primary beam monitor calibrations over a span of 6 years (2014–2020). The FC has previously been employed to calibrate the primary dose monitor of the PSI Gantry 2 (Pedroni et al 2011) which controls the beam delivery and provides an input to the safety system. This monitor measures the deposited intensity in Monitor Units (MU, arbitrary unit). By measuring the number of protons with the FC for a fixed number of MU, a conversion curve MU to number of protons as a function of initial proton energy was obtained. This process has been already described elsewhere (Goma et al 2014). As such, data taken on the PSI Gantry 2 in the energy range 70–230 MeV and in 2014, 2017 and 2020 have been compared.
Repeated measurements performed on the same day in 2017 and 2020 have been used to assess the precision of the FC response.
3. Results
3.1. Characterization of the FC response for varying magnetic and electric field strengths
Figure 2 depicts the response of the FC under different magnetic field settings without electric field, with the data normalized to the response with maximum magnetic and electric field for each energy (24 mT/−1000 V—referred to as the reference condition). The following behavior is observed: as the magnetic field is decreased from maximum to about 5mT the response decreases slowly down by 0.4% for the lowest energy. Between 5 mT and no magnetic field the behavior is then inverted and the decrease is followed by a quick increase of the collected positive charge up to 1.3% higher compared to the reference value for the lowest energy. The magnitude of the behavior appears to be energy dependent, with differences decreasing with increasing energy. For the 250 MeV beam the overall behavior is less evident and masked by the accuracy of the measured data, with the exception of the increase around 0mT, which is still clearly visible. A plausible explanation of the observation can be formulated considering that backscattered secondary electrons leaving the brass cup tend to be less energetic than forward scattered secondaries leaving the vacuum window. When no magnetic field is applied the signal is contaminated by a surplus of positive charge since the negative charge (electrons) leaving the cup is not fully compensated by the incoming negative charge from the electrons of the vacuum window. The application of a small magnetic field (0.5–1 mT) inverts this scenario by contaminating the signal with a surplus of negative charge since now the low-energy backscattered electrons are trapped while the more energetic electrons from the VW can still reach the cup. Only a much larger magnetic field, of the order of few 10 mT can prevent all secondaries from the VW from reaching the cup. The second observation that the magnitude of the contamination decreases with increasing energy can be understood by the fact that the number of secondaries produced per incident proton is expected to decrease with increasing energy because the ionization density decreases. More in-depth investigation (including for example Monte Carlo techniques to analyze the energy, and behavior, of secondary electrons) is necessary to further understand our observations.
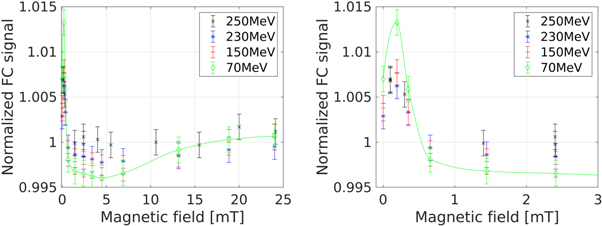
Figure 2. Faraday cup signal as a function of magnetic field with no applied voltage. The figure on the right focuses on the first few mT of the left figure. Proton numbers (per MU) have been normalized to the response at reference condition for each energy. 250 MeV has been measured in Gantry 1, 70 MeV/150 MeV/230 MeV in Gantry 2. A smooth line has been added to the 70 MeV data.
Download figure:
Standard image High-resolution imageFigure 3 shows the response of the FC as a function of the strength of the electric field with either magnetic field turned off or maximum magnetic field. With a maximum magnetic field applied (24 mT), the measured signal was found to be independent of the applied voltage, in agreement with the results of Verhey et al (1979). Without magnetic field however, the applied voltage alone is insufficient to reach the reference response, with a signal that remains up to 1.3% lower than the reference. The residual contamination is likely caused by the fact that even the maximum applied electric field of −1000 V is not sufficiently high to invert the trajectory of the most energetic forward directed secondary electrons originating from the VW. Interestingly, also in this case, the magnitude of the residual signal deficiency is dependent on the proton energy, with the smallest difference (0.4%) observed for the highest energy (250 MeV) and the largest difference (1.3%) for the lowest energy (70 MeV). Again, the effect may be explained with the increased number of secondaries produced at lower energies.

Figure 3. Faraday cup signal as a function of applied voltage when turning off the magnet (residual magnetic field between 0.3 and 0.7 mT) and with maximum magnetic field (line).
Download figure:
Standard image High-resolution image3.2. Clinical applications of the FC up to ultra-high dose rates
3.2.1. FC dose rate independency
Figure 4 shows FC response as a function of beam current (a surrogate for dose rate) up to 800 nA. Response is shown to be linear (residuals within 5%, figure 4(b)) over the complete range of current, corresponding to dose rates of up to approximately 1000 Gy s−1 along the central axis, indicating that there is no dose rate dependence of the FC readout. In order to determine the transmission thorough the beamline for a given beam intensity, we recorded beam currents measured simultaneously by 2 intensity monitors (downstream and upstream) with a time resolution of 100 ms. The transmission varies between 84.5% for lower beam intensities and 86% for high beam intensities. This is due to the changes in the phase space of the beam extracted from the cyclotron. FC currents for high beam intensities with slightly higher transmission were normalized to the minimum transmission of 84.5% corresponding to the slope in figure 4(a). The stability of cyclotron current during the charge collection was estimated to be always within 5%, with higher instabilities occurring at lower beam intensities. Therefore, a larger discrepancy between FC-derived and cyclotron currents (figure 4(b)) is observed for lower beam intensities. It should be pointed out however that this is an indirect test of the dose rate dependence of the FC, as it cannot be completely excluded that the monitor recording the cyclotron current might have exactly the same dose rate dependency as the FC. In practice however, this is highly unlikely, as these are two completely independent systems (ionization chamber versus FC).

Figure 4. Faraday cup measured current (250 MeV beam) as a function of cyclotron current (a) and residuals to a linear fit (b).
Download figure:
Standard image High-resolution image3.2.2. Dose rate response of a primary beam monitor
The above described and characterized FC has been used as part of the clinical commissioning of a Varian ProBeam gantry (Gantry 3) at our institute. It is estimated, that when the cyclotron is operated at its limit, the achievable maximum proton beam current at iso-center in Gantry 3 is of the order of 5 nA. This corresponds to about 30 Gy s−1 in the beam monitor, which could result in high ion recombination effects. It was therefore decided to add a dedicated test on the response of the primary beam monitor, and the FC was then chosen as the instrument to benchmark the dose rate response of the monitor. Figure 5(a) shows the calibration p/MU of the primary beam monitor as determined with the FC as a function of the cyclotron current for different energies and level of requested MUs. For each energy and number of MU, the average p/MU is calculated and the difference to each data point plotted in figures 5(b)–(d). As such, the dependency on the beam current can be considered as insignificant, since all values are below 1% and no trend can be recognized.

Figure 5. Monitor calibration for different energies and cyclotron currents (a), and ratio compared to the average when delivering 10 MU (b), 100 MU (c), 1000 MU (d).
Download figure:
Standard image High-resolution image3.3. Consistency of primary beam monitor calibration
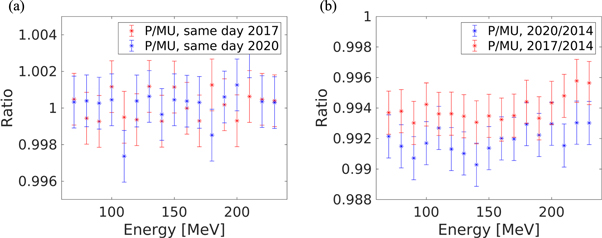
Figure 6 shows FC response for measurements repeated on the same day in both 2017 and 2020, as well as a comparison of the reading of the device in 2014, 2017 and 2020. FC measured protons per monitor unit taken on the same day show a repeatability of the number of protons per MU of 0.1% (one sigma), with a maximal deviation of 0.3% (figure 6(a)). Comparing quality assurance measurements of 2020, 2017 and 2014, results agree within 1% with a mean offset of −0.6%/−0.8% (2017/2020 compared to 2014, figure 6(b)). FC measurements are therefore very well repeatable if acquired on the same day and our experienced showed that the reproducibility remains well under 1% (see also Coray et al 2002). The difference of over 0.5% observed in the FC reading for the year 2017 and 2020 compared to 2014 is an indication that the output of Gantry 2 slightly drifted over the years. Results of the yearly reference dosimetry checks performed with calibrated ionization chambers show a similar drift over the same time period confirming a small change in the output of the treatment unit.
Figure 6. Reproducibility of p/MU measurements taken on the same day (a) and over multiple years (b).
Download figure:
Standard image High-resolution image
4. Discussion
FC measurements have been used for proton therapy for over 40 years (see for example Verhey et al 1979). Not only are these employed for regular quality assurance, the FC is now being increasingly used with upcoming interest in high dose rate experiments. The best settings of the FC are important for any center interested in these kinds of measurements, and different approaches, magnetic field and electric field (Lin et al 2009) or electric field only (Grusell et al 1995) have been used in different centers.
In this work, we have investigated the dependence of FC response on applied magnetic and electric field. With a strong enough magnetic field, the signal does not depend on the applied voltage. This might be explained by the magnetic field 'trapping' all electrons originating from the cup, and hindering all electrons from the vacuum window from reaching the cup. Without electric field however, but depending on the strength of the magnetic field, the reading of the FC could vary between +1.3% and −0.4% compared to the maximum magnetic field. The amplitude of the effect is dependent on the energy of the incident particle, with the largest differences observed for the lowest energy tested, i.e. 70 MeV. When applying only an electric field, without magnetic field (as it has been done by many institutes, see table 1), even with a negative voltage of −1000 V, the signal remains up to 1.3% lower than the reference readout. Again, the effect is energy dependent and is reduced to 0.4% for the highest energy of 250 MeV. The value reported by Verhey et al (1979) of 0.5% lower FC output without magnetic field and without applied voltage is within the range observed in this study, and was found for a magnetic field of 10mT for 135 MeV protons. Although Grusell et al (1995) suggested that a magnetic field might not be necessary since such a field would correct a possible small systematic error of only 0.3%, the present study shows that the effect could be larger and exceed the 1% level depending on the energy of the incident particle, which is still small but not negligible. The energy dependency of the FC response is indeed noteworthy since a calibration of a beam line performed with a FC without magnetic field could be affected by energy dependent systematic errors. In conclusion, if an accuracy in FC measurements of below 1%−2% is required, the use of a magnetic field should be considered. However, such a FC tends to be quite bulky and heavy. As such, the choice of the right FC is a trade-off between accuracy and portability. It should be noted, that these results are specific for the investigated FC geometry. Different geometries may lead to different optimal settings, both for the magnetic field and electric field, and the magnitude of the observed effects could also be different. For instance, Grusell et al (1995) observed a much higher change in response of about 4% compared to Verhey and our study. Nevertheless, as for all dosimetry equipment, our work demonstrates that each FC needs proper commissioning before its use.
The precision of successive FC measurements is of the order of 0.1% (one sigma, figure 6). The error bars (one sigma) in figures 2, 3, 5 and 6 follow the propagation of such precision. As for figure 4, where results are shown for varying dose rates, the error in measured cyclotron current is expected to be dominant compared to the error in measured FC charge and timing. As this is difficult to estimate, we did not include any error bars in figure 4. This graph nevertheless qualitatively clearly shows the linearity between the two independent measurement devices, and as such the dose rate independency of the FC.
Adjusting and measuring the actual applied magnetic field is challenging task. In this FC, the magnetic field is controlled by adjusting the current applied to two coils. The strength of the field is characterized by hysteresis and depends on the ramping of the magnet. As such, depending on the history of the magnetization and ramping sequence it could be that even when the magnetic field is turned off (no current through the coils) a residual magnetization below 1mT is present. Such a residual field, between 0.3 and 0.7 mT, was observed for measurements performed in two different Gantries. Additionally, all magnetic field values are based on the magnetic field measurements in the space between the coil and the FC, and might as such differ from the magnetic field in the middle of the device.
Future work will investigate the exact contributions of secondaries either escaping from the cup or originating from the vacuum window to the measured charge, and the influence of different FC geometries and materials (for example of the entrance vacuum window). Additionally, simulations of the exact contributions of different secondaries (electrons/protons) and potential vacuum contamination are needed to determine which setting represents the optimal response, and to investigate whether the overlap of magnetic field and brass absorber influences the presented results.
Table 1 shows an overview on the differences between ionization chamber measurements, and FC based absolute dose verification, ranging between 3% and 6% for different institutes. These differences might be caused by the ionization chamber, the theoretical model used to convert FC measured fluence to absolute dose, and the response of the FC. As such, the different values observed by different institutes might be partly explained by the different operating conditions of the respective FC.
Importantly, we have also demonstrated that the FC does not depend on the dose rate up to ultra-high dose rates of 1000 Gy s−1. As such, the FC is a valuable tool for commissioning of monitors and field detectors up to ultra-high dose rates. Additionally, FCs might not only be interesting for proton FLASH experiments, but might also be an interesting tool for other high-dose rate particle beams, for example electrons or heavier ions.
5. Conclusions
Using a magnetic field only, or using an electric and magnetic field combination, leads to an optimal FC response, for which the influence of secondary electrons is minimized. For the PSI FC geometry, no magnetic field and no electric field would cause a FC reading up to 1.3% higher compared to the response with maximum magnetic field, while using only a negative electric field would cause a FC reading 1.3% lower compared to the response with maximum magnetic field. In conclusion, this study shows that the FC is an effective tool for commissioning, calibration and quality assurance for proton pencil beam scanning monitors, which will be especially important for ultra-high dose rate experiments.
Acknowledgments
We are thankful for the experimental support by Benno Rohrer and Francis Gagnon-Moisan. Furthermore, we thank Erik Almhagen and Erik Grusell for the information on their Faraday cup settings.