
Abstract
International guidelines/standards for human protection from electromagnetic fields have been revised recently, especially for frequencies above 6 GHz where new wireless communication systems have been deployed. Above this frequency a new physical quantity 'absorbed/epithelial power density' has been adopted as a dose metric. Then, the permissible level of external field strength/power density is derived for practical assessment. In addition, a new physical quantity, fluence or absorbed energy density, is introduced for protection from brief pulses (especially for shorter than 10 s). These limits were explicitly designed to avoid excessive increases in tissue temperature, based on electromagnetic and thermal modeling studies but supported by experimental data where available. This paper reviews the studies on the computational modeling/dosimetry which are related to the revision of the guidelines/standards. The comparisons with experimental data as well as an analytic solution are also been presented. Future research needs and additional comments on the revision will also be mentioned.
Export citation and abstract BibTeX RIS

Original content from this work may be used under the terms of the Creative Commons Attribution 4.0 licence. Any further distribution of this work must maintain attribution to the author(s) and the title of the work, journal citation and DOI.
1. Introduction
In 2019, a new wireless communications system named '5G' (5th generation) began to be deployed. The technology is presently defined to operate in three bands; 'low' and 'mid' which are similar to presently used cellphone bands, and a 'high band' from 24 to 28 GHz that is higher than conventional wireless communication systems, e.g. 4G (2 GHz 3.5 GHz), wireless LAN (5.8 GHz) etc. This creates the need to assess human exposure to radiofrequency (RF) energy, both from uplink (handsets) and downlink (base station) and possibly the need to refine RF exposure limits and compliance assessment procedures at these higher frequencies.
In the previous version of the ICNIRP (1998) and the IEEE C95.1-2005 (2005) 7 , the specific absorption rate (SAR) was the dosimetric or internal physical quantity for assessing exposure below 3 or 10 GHz, depending on the limit. At higher frequencies, the dosimetric measure changed to the incident power density, because of the shorter power penetration depth in tissue. This introduced a discontinuity in the exposure limits across the transition frequency (Colombi et al 2015).
The recently updated limits, ICNRP (2020) and IEEE C95.1-2019 (2019) have adopted a common 'transition frequency' of 6 GHz. Below this frequency, the SAR remained the basic measure of internal exposure. Above this frequency a new metric for internal exposure has been adopted, 'absorbed/epithelial power density'. Both sets of limits were explicitly designed to avoid excessive increases in tissue temperature, based in large part on electromagnetic and thermal modeling studies but supported by experimental data where available (Foster et al 2016, Ziskin et al 2018, Hirata et al 2019).
This review summarizes recent advances in thermal and electromagnetic modeling of exposure at frequencies >6 GHz. It comments also on the strengths and weaknesses of thermal models to predict the rise in temperature of RF-irradiated tissues.
2. Background
2.1. Characteristics of human interaction with biological tissues
Microwave energy at frequencies >6 GHz is absorbed close to the surface of the body. Figure 1 summarizes the power penetration depth and power transmission coefficient, calculated from a simplified one-dimensional model (Foster et al 2018b) for tissue with dielectric properties of dry skin (Hasgall et al 2015).

Figure 1. Power transmission coefficient and power penetration depth into tissue estimated with the dielectric properties in Gabriel et al (1996). Power transmission coefficients are for plane waves normally incident on the surface. The power penetration depth is defined as the distance beneath the surface at which the power density has fallen to 1/e of that transmitted across the surface. The model is based on a uniform half plane of tissue with dielectric properties of dry skin.
Download figure:
Standard image High-resolution imageThe dosimetry and thermal modeling problems extend over two different distance scales: exposure to RF energy is limited to tissues close to the body surface, whereas heat propagates into subcutaneous tissues and eventually is dissipated in the body core.
In the frequency range of present interest, the most relevant tissues for dosimetry are skin and cornea. Ziskin et al (2018) reviewed the anatomy and electrical and thermal properties of skin that are relevant to assessments exposed to mm-wave (figure 2). The stratum corneum (outer layer) has comparatively low water content and varies in thickness in different parts of the body but is generally <0.02 mm thick. The epidermis and dermis have much higher water content, and their combined thickness can exceed 2 mm. The deepest layer, the hypodermis, consists of subcutaneous fat and it also varies considerably in thickness among individuals.
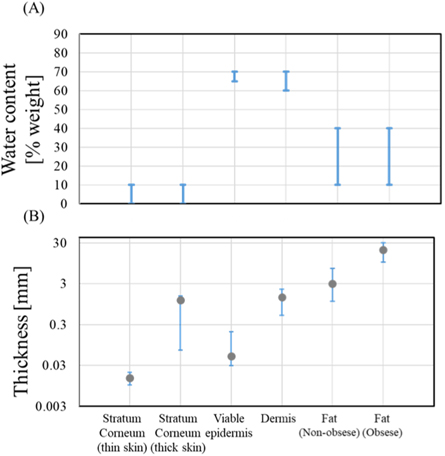
Figure 2. Thickness and water content of skin layers. The range of both quantities are indicated by the bars. In the case of thickness, the typical value is indicated by a gray circle. Thick skin refers to sole and palm regions. The data are based on those presented in ICRP (1975), Anderson et al (2010) and Ziskin et al (2018).
Download figure:
Standard image High-resolution image2.2. Dielectric properties of tissue
For a comprehensive review of the dielectric properties of tissue; see Foster et al (2018a) and Ziskin et al (2018). Some of the most widely used data are from Gabriel et al (1996), who measured the dielectric properties of 56 different human and animal tissues between 10 Hz and 20 GHz. The investigators fitted the data to cole–cole equations, and reported properties extrapolated to 100 GHz. With over 3700 citations (Google Scholar, September 2020), and a readily accessible online version, this dataset has become the de facto standard for dielectric properties for numerical dosimetry studies. It has been incorporated into commercial electromagnetic modeling programs.
Despite its widespread use, the Gabriel dataset has significant limitations. It was derived from a relatively small number of measurements on a limited number of tissue samples, many of them autopsy specimens or excised animal tissues, and the dataset may not accurately reflect the range of tissue properties in vivo. The highest measurement frequency was 20 GHz and entries at higher frequencies, up to 100 GHz, are extrapolated from lower frequencies, which is a potential source of error.
Tables 1 and 2 compare the real and imaginary parts of the complex relative permittivity (ε' and ε'' respectively) and two derived quantities (the power transmission coefficient into tissue (Ttr) and power penetration depth (L) of (rabbit) cornea at 30 and 100 GHz from the Gabriel dataset with measured data by Sasaki et al (2015). The properties agree very well. It is not clear, however, how large the normal background variability in these properties will be. Skin is anatomically a multilayer structure whose layers vary significantly in water content and thickness, and consequently the bulk dielectric properties measured across the full thickness of skin will vary considerably (Ziskin et al 2018).
Table 1. Comparison of dielectric properties of rabbit cornea, 35 °C–37 °C: Gabriel et al (1996) (extrapolated) and Sasaki et al (2015) (measured).
| Gabriel et al (1996) | Sasaki et al (2015) | |
|---|---|---|
| 30 GHz | ||
| ε' | 20.9 | 19.5 |
| ε'' | 20.5 | 20.3 |
| L (mm) | 0.39 | 0.38 |
| Ttr | 0.50 | 0.50 |
| 100 GHz | ||
| ε' | 8.0 | 13.1 |
| ε'' | 10.3 | 7.0 |
| L (mm) | 0.15 | 0.20 |
| Ttr | 0.63 | 0.63 |
Table 2. Comparison of dielectric properties of skin, 35 °C–37 °C: Gabriel et al (1996) (extrapolated) and Sasaki et al (2014) (measured).
| Dry skin in Gabriel et al (1996) | Dermis in Sasaki et al (2014) | |
|---|---|---|
| 30 GHz | ||
| ε' | 17.7 | 17.6 |
| ε'' | 16.5 | 15.4 |
| L (mm) | 0.43 | 0.47 |
| Ttr | 0.54 | 0.54 |
| 100 GHz | ||
| ε' | 7.2 | 6.6 |
| ε'' | 8.3 | 8.0 |
| L (mm) | 0.18 | 0.17 |
| Ttr | 0.7 | 0.68 |
Several studies have directly measured the dielectric properties of skin above 6 GHz (table 3). Most of these studies have used coaxial probes or open-ended waveguides placed against the skin or, at THz frequencies, measured wave reflection properties of the skin surface. These methods are sensitive to the dielectric properties of skin averaged over tissue volumes exposed to the field, typically including the stratum corneum, epidermis, and parts of the dermis. Some investigators have estimated properties of individual skin layers from such data using electromagnetic scattering models. Sasaki and his group (Sasaki et al 2014, 2017) extended measurements up to 1 THz by using a combination of coaxial probe and wave reflection techniques. That group has also reported dielectric properties of rabbit and porcine ocular tissues up to 110 GHz (Sasaki et al 2015).
Table 3. Selected studies on dielectric properties of tissues at frequencies >6 GHz.
| References | Animal/tissue (frequency range) | Comments |
|---|---|---|
| Sasaki et al (2014) | Porcine epidermis and dermis in vitro at frequencies from 0.5 to 110 GHz | Combination of dielectric probe (0.5−50 GHz) and free field techniques (50−110 GHz) |
| Sasaki et al (2015) | Porcine and rabbit ocular tissues in vitro at frequencies from 0.5 to 110 GHz | Dielectric probe was used. Dielectric properties of the cornea, lens cortex, lens nucleus, aqueous humor, vitreous humor, sclera, and iris were reported. Rabbit tissues were typically used, but porcine tissue was used for the aqueous humor. The dielectric properties of vitreous and aqueous humor are almost equivalent to those of pure water at frequencies over around 10 GHz |
| Sasaki et al (2017) | Porcine dermis, subcutaneous tissue fat, muscle in vitro at frequency ranges of 100 GHz−1 THz, 1 GHz−1 THz, and 1−100 GHz, respectively | Combination of dielectric probe (1 GHz−100 GHz) and free field techniques (100 GHz−1 THz). Study also included extensive Monte Carlo dosimetric modeling |
| Gao et al (2018) | Human skin in vivo at frequencies from 26.5 to 40 GHz | Reflection measurements using open-ended waveguide probe |
| 3 human subjects in several locations: forearm, shoulder, abdomen, thigh, calf, and palm. Error analysis considering effects of thicknesses of skin layers. The reported relative permittivity of skin at 30 GHz (average of measurements on 3 subjects): forearm 17.1, shoulder 20.2, abdomen 20.5, thigh 16.7, calf 16.1, 2 sites on the palm 6.4, 9.2 GHz |
Gao et al (2018) reported an extensive set of measurements of the dielectric properties of skin (26.5–40 GHz), using an open-ended waveguide placed against the skin of three human subjects in several locations (forearm, shoulder, abdomen, thigh, calf, palm). The investigators estimated the dielectric properties of different skin layers using an electromagnetic scattering model. In addition, they provided an extensive analysis of experimental uncertainties in measuring dielectric properties of skin in the mm-wave range. The study found that the permittivity of skin at 30 GHz varies by more than a factor of 3 in different sites of the body, reflecting variations in skin thickness; in addition, there was considerable intersubject variability (table 3).
Despite these several studies, there remains limited data from skin and ocular tissues. The currently available data are sufficient for many electromagnetic modeling studies, but the data remain insufficient at mm-wave frequencies to explore the variations introduced by interpersonal and intrapersonal variations in RF absorption in skin and subcutaneous tissue.
2.3. Bioheat transfer equation
To assess thermal hazards from mm-wave exposure, RF-induced temperature increases in skin and cornea are of principal interest, though whole-body exposure will be mentioned briefly in the discussion section. Several studies have combined electromagnetic and thermal modeling to estimate the increase in tissue temperature due to mm-wave exposure. Nearly all thermal modeling studies have used the finite difference time domain method for electromagnetic modeling, with solution of Pennes' bioheat equation (BHTE) (Pennes 1948) for thermal analysis. The BHTE equation can be written:

where r is the position vector, T is temperature of a volume of tissue that is sufficiently small that the temperature throughout the volume can be considered to be uniform for the purposes of the analysis. Thermal properties for the tissue are considered to be averaged over this control volume and may be different from those of blood; Tb is temperature of the perfusing blood (more precisely, the temperature of the arterial blood supply to a region of tissue, which is assumed to be constant and equal to the core body temperature); c (c b ) is the specific heat of the tissue (blood) (J kg−1 K−1); ρ (ρb ) is the density of the tissue (blood) (kg m−3); k is the thermal conductivity of the tissue (W m−1 K−1); M is the rate of metabolic heat generation (W m−3); ω b is the rate of blood perfusion per kg of tissue mass (m3 s−1 kg−1); SAR is the SAR (W kg−1); and t is time. The initial condition T(r, t = 0) is typically defined as the solution to equation (1) when both SAR and the right-hand term are zeros.
Heat exchange at the body surface proceeds through four main mechanisms: convective cooling by air, flowing past the body, evaporation of skin moisture, thermal conduction to surrounding materials, and radiation from the body surface back into space. The first of these processes is the dominant mechanism under ordinary conditions. It can be modeled through boundary condition at the skin-air interface:

where n is the outward normal vector to the interface, r0 is the surface temperature, Tair is the ambient temperature, and h is a convective heat exchange coefficient that depends on air velocity and temperature. This formulation neglects heat transfer across the skin surface from evaporation of surface moisture and radiation back into space, which under ordinary environments are small compared to convective heat exchange. For the presently considered frequency range, heat transport near the skin surface is dominated by thermal conduction into the tissue due to the high temperature gradients at the skin, and only a small fraction of the absorbed energy is lost back into the surrounding environment.
Equation (1) is readily solved numerically as an extension to FDTD electromagnetic modeling, and thermal modeling programs are included in several major electromagnetic modeling programs (e.g. Semcad X, Schmid and Partner Engineering AG, Zurich, and XFdtd, Remcom, State College PA). A variety of high-resolution image-based models of the human body are also available. Most thermal modeling studies discussed below computed the steady state increase in temperature (from equation (1) with the right-hand term in dT/dt set to zero) while a few studies computed the time-dependent increase in tissue temperature. For short times (a minute or less), effects of the blood perfusion term on the computed temperature increase are minor and equation (1) can be replaced by a simple heat conduction equation. Steady state is reached after several hundred seconds and the temperature increase is dominated by tissue blood perfusion (fourth term on the left side of equation (1)) which is highly variable.
Extensive tables of thermal properties of tissues can be found at (Bowman et al 1975, Duck 1990, Diller et al 2000, Hasgall et al 2015). However, these values are subject to considerable variability as discussed below.
In assessing thermal impacts of exposure to RF energy, a useful concept is heating factor, defined as the increase in temperature in the steady state per unit of exposure, with typical values of about 0.15 °C W−1 kg below 3 GHz and 0.018 °C W−1 m2 at higher frequencies (Funahashi et al 2018b).
2.4. Baseline model
Foster and colleagues (Foster et al 2016, 2018a, 2018b, Ziskin et al 2018) have developed simplified 'baseline' one-dimensional models for mm-wave heating of tissue which provides insights into the thermal response. The model is intended to provide a highly simplified 'baseline' approximation that can be compared to more detailed numerical simulations using anatomically realistic models and a fuller heat transfer model. A simplified version of equation (1) with assumption of ρb = ρ and cb = c can be written in form

where T* is the temperature increase above the baseline (pre-exposure) value, and z is the depth beneath the surface. As the heating is localized and does not significantly increase the body core temperature, both the metabolic heat generation and blood temperature are assumed not to change from their pre-exposure values. Consequently, they vanish from (3).
The 'baseline' model is developed in terms of the temperature increase at the skin surface above pre-exposure temperature, i.e. in terms of the temperature increase T* produced by the exposure. Scott (1988) has shown that the heat equation can be written in terms of the difference between pre- and post-exposure temperatures (T*). The boundary condition at the skin-air surface can be written approximately as

where h is the same for both equations (2) and (2') (in the range of 1–10 W m−2 °C−1). For the moderate increases in skin temperature presently considered (T*≈ 1 °C) at an incident power density of 100 W m−2, the energy loss from the skin due to convective cooling by surrounding air is a small fraction of that supplied to the skin surface by the RF energy. Consequently, a reasonable simplification of the model is to let h = 0. The resulting simplified model agrees with experimentally measured temperature increases from mm-wave exposure to within about 20% (figure 5 in section 5.3). It overpredicts computed temperature increases in a stratified model for tissue by about 30% (Christ et al 2020). The approximation will show larger errors under unusual environmental conditions (e.g. strong convective cooling of the skin by high air velocity). It is noted that the boundary condition equation (2) used with the larger bioheat equation model (equation (1)) is also physically incomplete since it ignores evaporative cooling of surface moisture and radiative losses from black body radiation from the skin, which are likewise relatively small effects. This 'baseline' model was developed to reduce the tissue heating problem to its simplest essentials, by setting convective cooling of the skin surface to zero as well. Such highly simplified models can be useful by examining where they fail.
In the simplest 1D case, the model consists of an insulated half-space of material with thermal and electrical properties characteristic of skin (homogeneous tissue), exposed to normally incident plane wave energy. In this 1D 'baseline' model, the initial temperature is chosen as 0 and the temperature is fixed at 0 as z → ∞. In 1D, the Laplacian ∇2 is replaced simply by d2/dz2. For a plane wave of intensity Io (t) incident on a planar surface, the absorbed power density (SAR) at z is

where L is the power penetration depth (one half of the field penetration depth) in tissue and Ttr is the power transmission coefficient into tissue. Equation (3) has two intrinsic time scales:


The first of these (τ1) characterizes the rate of removal of heat from tissues beneath the region where most of the energy is absorbed to the central core of the body by blood perfusion, and is ≈500 s for typically reported values of skin blood flow (Hasgall et al 2015). The second (τ2, <2 s at mm-wave frequencies) represents the rate of thermal diffusion from the exposed layer of tissue into deeper tissues. The increase in surface temperature T*sur is determined by the interplay between the rate of heat generation in the layer near the surface where most of the RF radiation is absorbed, the rate of diffusion of heat out of the region of high SAR (a relatively fast process due to the small thickness of this layer), and the rate of removal of heat to the body core by blood perfusion (a much slower process). In a more anatomically realistic model, convective heat transfer occurs in microvascular in the dermis and deeper tissues. Heat rapidly diffuses from the thin layer where most RF energy at mm-wave frequencies is absorbed, but if energy is pushed into it sufficiently rapidly (i.e. if the incident power density is high), significant temperatures increases can develop. Short (<1 s) pulses of mm-waves at high fluence induce large transient increases in surface temperature (Foster et al 2018b) and large temperature gradients near the surface.
The simple 1D 'baseline' model yields analytical solutions for simple cases, but in general these are unwieldy. Assuming an insulated surface (adiabatic boundary conditions) simplifies the mathematics greatly.
Foster et al (2018b) have developed approximate solutions for the increase in surface temperature that apply at mm-wave frequencies. An extensive discussion of these approximations and the conditions under which they apply is in the appendix to Foster et al (2020). They are applied to the simplified 1D planar model.
Surface heating approximation (L → 0). The increase in surface temperature T*sur can be written:

where erf is the Gauss error function. Taking the limit t → ∞ and substituting equations (5a ), (5b ) yields the steady-state temperature increase at the surface

For τ2 ≪ τ1 this is very close to the steady state increase in surface temperature provided by the full analytical solution to equation (3) for the adiabatic plane. In this approximation, the increase in surface temperature in the steady state scales as (ωb )−1/2. However, this model behaves poorly for calculating early transient temperature increases from intense pulses (in mathematical terms, its impulse response diverges). Physically, this is a consequence of pushing a finite amount of energy into an infinitesimally thin tissue layer. However this approximation works quite well for exposure times more than a few seconds for mm-waves (Foster et al 2020).
Conduction only model (ωb = 0), which applies at short times after exposure has begun where heat conduction in the skin layer is the dominant mode of heat transfer:

The full analytical solution to the model asymptotically approaches equation (8) as t → 0. Numerical simulations (Foster et al 2017, figure A1) show that equation (8) is closely approximates the full solution for the first hundred seconds or so of the step response for mm-waves. A comparison of the step response of the surface temperature of the model with ωb = 0 (i.e. the heat conduction equation) with that of the full bioheat equation at 94 GHz is shown in figure A1 of Foster et al (2020), showing close agreement for times below about 300 s. At 94 GHz, the power penetration depth is <0.2 mm and the step response for short times chiefly reflects heat conduction out of the thin layer with high SAR.
Because it neglects effects of blood perfusion, which becomes the main mode of heat transfer as time progresses, equation (8) does not have a finite steady-state solution in the 1D model using a semi-infinite plane of tissue. However, any realistic finite-sized model would impose boundary conditions that would result in a finite steady-state temperature increase.
Equation (8) suggests that for exposure times much shorter than the thermal time constant τ2 in (5b ) the increase is particularly sensitive to the product ρck (the thermal inertia of the tissue) (equation (8)) while for longer times (several seconds or more at mm-wave frequencies) the surface temperature increases as the square root of time. Close to the steady-state, the temperature increase at the surface scales as (ωb )−1/2 (equation (7)). These results apply to the simplified 1D 'baseline' model but give an approximate picture of the behavior of more detailed models as well. For highly localized exposures a 2D or 3D model would be needed. Major differences compared to the 1D model include shorter times to approach the steady state, and a larger contribution of heat conduction to convection from blood perfusion in heat transfer.
3. Physical quantities for local exposure below and above 6 GHz
3.1. Guidelines and standard
In the guidelines/standard, first, a physical quantity related to exposure to RF energy (including averaging region) is derived to correlate with the temperature rise, and then the corresponding limit/restriction is derived. At frequencies below 3–10 GHz, the SAR averaged over 10 g of tissue is an approximate surrogate of local temperature rise (Hirata et al 2006, Razmadze et al 2009, McIntosh and Anderson 2010b) (see also the review by Foster et al 2018a). The revised IEEE and ICNIRP limits introduced a more useful surrogate for local temperature rise for use at frequencies >6 GHz, the absorbed/epithelial power density (i.e. the power density absorbed in tissue from an incident RF wave, in terms of watts of power per unit area of skin). This power density is to be averaged over a specific area (averaging area) (ICNIRP 2020, IEEE-C95.1 2019).
To derive an appropriate averaging area, we note that the side length of the cube corresponding to 10 g tissue (the averaging volume below 6 GHz) is 2.2 cm, corresponding to a square with area 4.8 cm2 (assuming that the density of the tissue is 1000 kg m−3. To interface smoothly with the limits below 6 GHz, this suggests a choice of averaging area of about that size. IEEE C95.1-2019 specifies that 'the choice of 4 cm2 (for ERL between 6 GHz and 300 GHz) and 1 cm2 (for high-power pulsed RF exposures) for the spatial peak averaging area was influenced by several factors. First, there is general agreement with other guidelines and standards including ICNIRP and ANSI Z136.1-2014. Second, the smaller averaging area (1 cm2) provides an additional level of conservatism for brief, high-power pulses...'. The ICNIRP guidelines specify as follows: '... ICNIRP uses a square averaging area of 4 cm2 for >6 to 300 GHz as a practical protection specification. Moreover, from >30 to 300 GHz (where focal beam exposure can occur), an additional spatial average of 1 cm2 is used to ensure that the operational adverse health effect thresholds are not exceeded over smaller regions...' for a limit relaxed by a factor of 2.
3.1.1. Review of studies on averaging area of absorbed power density
This section reviews studies on the relationship between the power-density averaging area and the peak increase in tissue temperature for exposures above 6 GHz, including the rationale of averaging area. Foster et al (2017) suggested a distance where the temperature increase is removed by blood flow is 7 mm, approximately corresponding to a circle with a diameter of 14 mm. This distance is derived for a homogeneous skin model whose thermal parameters are in Hasgall et al (2015). This area is smaller than the 10 cm2 (frequency independent) used in previous international guidelines and standards (ICNIRP 1998). The averaging area of approximately 4 cm2 was suggested from FDTD computations (Hashimoto et al 2017). For beam exposure smaller than 4 cm2, those investigators proposed a compensation scheme to estimate the skin temperature, based on Foster et al (2017). He et al (2018), using FDTD analysis for realistic antennas for the 5th generation wireless communications, proposed a similar averaging area.
Neufeld et al (2018) derived an averaging area to limit the temperature rise to 1 °C for a spatially nonuniform incident power density whose averaged intensity was 10 W m−2. Those authors defined the averaging area as functions of frequency and distance from the transmitter to the body. Unlike other studies, Neufeld et al (2018) considered near-field exposures.
In sum, the latest versions of both IEEE and ICNIRP limits specify that the absorbed power density must be averaged over tissue areas of 4 cm2 above 6 GHz. At mm-wave frequencies, where beams smaller than 4 cm2 in area may be feasible, a smaller averaging area might be better correlated with the spatial-peak temperature rise. However, extreme exposure situations such as considered by Neufeld et al (2018) may require different choices of averaging area. Those are most likely to occur when a small antenna operating at mm-wave frequencies is in close proximity (a few mm to nearly in contact with) the skin.
4. Steady-state temperature rise in skin above 6 GHz
4.1. Review of computational dosimetry
Studies reporting on computational studies and specific metrics for (quasi-)steady-state temperature rise (e.g. incident power density) were included. In total, 14 studies were reviewed. As presented in equation (7), the temperature increases at the surface scales as (ωb )−1/2. There may be a different dependence on ωb for highly localized exposures The criteria for paper selection can be found in the appendix (to be listed; currently only for search strategy).
Gustrau and Bahr (2002) measured the dielectric properties of eye and skin tissues between 75 and 100 GHz and conducted electromagnetic and thermal simulations in for skin and a detailed model of the human eye subject to exposure to plane waves at 77 GHz. Thermal measurements in vivo in skin (in the forearms of two volunteers) and in vitro in excised porcine eyes, respectively, showed steady-state temperature increases of 0.7 °C from exposure at an incident power density of 100 Wm−2, which were consistent with simulation results 'in view of the natural variability of the measurement data... and reduced complexity of the model' (Gustrau and Bahr 2002).
Kanezaki et al (2009) derived an approximate expression for thermal steady state temperature rise in the skin layer of a three-layer (skin, fat, and muscle) one-dimensional model exposed to a plane wave at frequencies from 30 to 300 GHz. A Debye-type approximation was introduced to model the dielectric properties of the tissues between 30 and 300 GHz. The authors concluded that the effects of variations in dielectric properties on skin heating were smaller than from variations in the assumed thermal parameters and thickness of the tissue layers. Skin heating correlated with the power density absorbed in the skin rather than the SAR at the skin surface or the incident power density on the skin.
The same group derived the temperature rise in the thermal steady state in the skin layer of a one-dimensional one-layer (skin) and three-layer (skin, fat, and muscle) model for plane wave exposure at frequencies 30–300 GHz (Kanezaki et al 2010). The peak temperature was 1.1 °C at 30 GHz and 1.9 °C at 300 GHz with an incident power density of 50 W m−2. The surface temperature rises in the three-layer model were 1.3–2.8 times greater than those in the one-layer model due to the thermal resistance of the fat layer. The heat transfer coefficient h (see equation (2)) was the most dominant parameter in the change of the surface temperature rise in the three-layer model.
Table 4. Computational studies on temperature rise: steady-state exposures.
| References | Study design frequency, exposure | Major findings/comments |
|---|---|---|
| Gustrau and Bahr (2002) | Analytic model for SAR in skin, 3–100 GHz; FDTD calculation of SAR in skin and eye at 77 GHz in vitro (eye) and in vivo (forearm of 2 subjects) | The results of the thermal measurements and simulations provide consistent results for the assessment of thermal effects. Used literature values for skin blood perfusion, experimental temperature increase in rough agreement with model |
| Kanezaki et al (2009) and (2010) | Analytical/numerical model (SAR in skin and skin layers and temperature increase in skin and eye using BHTE), 30–300 GHz | The incident power density of 50 W m−2 causes temperature increase of 0.6 °C–0.9 °C. The fat causes higher computed steady-state temperature increases due to the adiabatic nature |
| Morimoto et al (2016) | FDTD simulation, 1–30 GHz, dipole antenna | The computed steady-state temperature rises in the head (skin) increase with the increase of the frequency. The SAR averaged over 10 g of tissue depend on the averaging schemes |
| Laakso et al (2017b) | FDTD calculation in anatomical human head models, 1–12 GHz, independently determined tissue blood perfusion | Variability of peak computed steady-state temperature rise in the skin due to individual and regional variations in the blood flow was less than ±15% |
| Leduc and Zhadobov (2017) | 60 GHz phantom in vitro and 1D model of surface heating | 50 W m−2 causes computed steady-state temperature increase of 0.6 oC–0.9 oC. Comparison to analytical solutions of heat conduction equation |
| Sasaki et al (2017) | Simulation study, skin heating (steady state) 10 GHz–1 THz, Detailed Monte Carlo model | For variation of human tissue composition, the computed steady-state temperature rise at the skin surface for different tissue thickness is generally 0.02 °C or less for an incident power density of 1 W m−2 at a frequency below 300 GHz |
| Funahashi et al (2018b) and (2018c) | FDTD simulation, 0.3–300 GHz, dipole, patch antennas | The absorbed power density is a good metric of computed steady-state temperature rise in the skin from 30 to 300 GHz, and provides a less accurate but still conservative estimate down to 10 GHz, whereas the SAR is a good metric below 3 GHz. The heating factor for plane wave exposure is 0.15 °C W−1 kg below 3 GHz and 0.018 °C W−1 m2 above 10 GHz |
| Kodera et al (2018a) | FDTD simulation 300 MHz–10 GHz, head and brain heating, includes vasodilation in model | The effect of vasodilation is significant, especially at higher frequencies where the highest increase in tissue temperature occurs in the skin. Its effects become notable at an SAR >10 W kg−1 |
| Ziskin et al (2018) | Simulation study at 6–100 GHz, skin heating. BHTE incorporating blood flow rate-dependent thermal conductivity | The computed steady-state temperature increase at the skin surface is determined by the thermal resistance of subcutaneous tissues, blood flow in the dermal and muscle layers, and thickness of subcutaneous fat |
| Li et al (2019) | Human skin exposure to obliquely incident electromagnetic waves at frequencies from 6 GHz to 1 THz. Monte Carlo analysis | The absorbed power density provides an excellent estimate of computed steady-state skin temperature elevation through the millimeter-wave band (30–300 GHz) and a reasonable and conservative estimate down to 10 GHz, whereas the SAR is a good metric below 3 GHz |
| Nakae et al (2020) | FDTD simulation at 28 GHz. Cubic model, 4 and 8 element dipole arrays. | The enhancement of the ratio of the computed steady-state temperature increase to incident power density was observed around the Brewster's angle |
| Christ et al (2020) | Simulation study, skin heating (steady state) 6 GHz–100 GHz | When the stratum corneum and related layers serve as matching layer that increases the power absorption and the resulting computed temperature increases in the tissue |
Morimoto et al (2016) computed the SAR and steady state temperature rise in the head and brain from 1 to 30 GHz. As the frequency increases, the computed temperature rise in the head increase, and in the brain decrease, due to absorption of energy progressively closer to the body surface. Morimoto et al (2016) noted that SAR averaging algorithms excluding the pinna must be used when correlating the peak temperature elevation in the head excluding the pinna.
Sasaki et al (2017) measured the dielectric properties of tissue and computed the steady-state temperature rise in a one-dimensional four-layer model (epidermis, dermis, subcutaneous tissue, and muscle) exposed to plane wave RF energy at 10 GHz–1 THz. Using a Monte-Carlo simulation, they studied the variations of temperature rise due to variations in thickness of the tissue layers obtained from statistical data from the human body. The computed steady state temperature rise over the skin surface was generally <0.02 °C for an incident power density of 1 W m−2 at frequency below 300 GHz. From the models, the investigators determined the maximum incident power density versus frequency that would result in steady-state temperature rises within specified limits.
Ziskin et al (2018) developed a simplified model for skin that incorporates anatomic detail, using a series of planar structures representing the skin and subcutaneous fat. The model shows that the thermal resistance of subcutaneous fat contributes significantly to the steady-state increase in computed skin temperature.
Funahashi et al (2018a) studied both analytically and computationally the effectiveness of the absorbed power density at the skin as a metric to estimate the steady-state rise in skin temperature at frequencies above 6 GHz. They concluded that the absorbed power density provided an excellent estimate of skin temperature rise through the millimeter-wave band (30–300 GHz) and provided a less accurate but conservative estimate down to 10 GHz, whereas the SAR is a good metric below 3 GHz. They reported that the heating factor for plane wave exposure is 0. 15 °C W−1 kg below 3 GHz and 0.018 °C W−1 m2 above 10 GHz. Funahashi et al (2018c) confirmed the effectiveness of the absorbed power density for use in estimating the skin temperature rise even for a realistic antenna but noted that for small beam diameters an averaging area smaller than 4 cm2 is needed above 30 GHz.
Li et al (2019) analyzed the temperature rise in the thermal steady state in skin exposed to plane waves with oblique incidence at frequencies from 6 GHz to 1 THz, using the four-layer plane model described in Sasaki et al (2017). The investigators studied the variations in computed temperature rise and total power transmittance into the skin as functions of angle of incidence and wave polarization. For transverse electric wave exposure, the largest electromagnetic enhancement appears in vertical incidence, whereas the different tendency is observed for incident waves with transverse magnetic polarization because of the Brewster effect. The computed temperature rise produced by waves with oblique incidence never exceeded that of normally incident waves of the same power density. They mentioned that the evaluation surface for oblique incidence scenarios needs to be standardized.
Nakae et al (2020) computed the temperature rise in the thermal steady state for dipole arrays at 28 GHz. The investigators reported an increased ratio of the temperature increase to incident power density for incidence angles of radiation agrees with Li et al (2019), but for only the angle range close to the Brewster's angle appear disagreement. For the dipole antenna arrays, is the distances between the antenna and body that were large (e.g. 45 mm) for large incident angle, which is not realistic for compliance assessment of transmitters operated near the body. This study presented for a given output power, the highest absorption, consistent with Li et al (2019), is when the beams impact the tissue with normal incidence.
Christ et al (2020) computed the steady-state temperature rise in multilayer skin models including the stratum corneum and the viable epidermis, over a frequency range from 6 to 100 GHz. Under 'worst case' assumptions, i.e. that the thickness and dielectric properties of the tissue layers adjusted to maximize transmission into the skin and adiabatic boundary conditions at the air-surface boundary, the authors reported that the calculated steady-state temperature rise at the surface is 0.4°C for an incident power density of 10 W m−2. For other exposure scenarios, the same incident power density produced calculated temperature increases of 0.1 °C–0.2 °C (for a thin stratum corneum) and 0.1 °C–0.3 °C for a thick stratum corneum (table 4).
4.2. Power density and temperature rise
Figure 3 summarizes the required power densities from 1 to 300 GHz reported in several studies to increase skin/cornea temperature in the steady state by 0.5 °C; virtually all of these studies found that exposure levels exceeding occupational limits of IEEE and ICNIRP would be required. Only one study (Neufeld et al 2018) reported that incident power densities below international limits could cause a 0.5 °C increase in the steady state. That result was from a worst-case scenario, in which the thickness and dielectric properties of cutaneous and subcutaneous tissue layers had been chosen to maximize the fraction of absorbed power, and is unlikely to represent a realistic exposure situation.
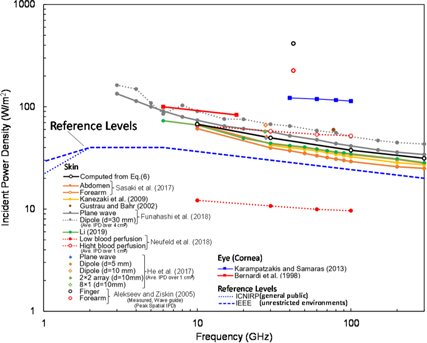
Figure 3. Incident power density needed to increase the skin/cornea temperature by 0.5 °C in the steady state, as computed by thermal modeling programs.
Download figure:
Standard image High-resolution imageEquation (6) predicts that an incident wave of 100 W m−2 will produce steady-state temperature increases ranging from 0.74 °C (10 GHz) to 1.58 °C (300 GHz) in a uniform 1D baseline model. More complex models produce similar results. For a multilayer model for the forearm and abdomen, (Sasaki et al 2017) calculated temperature increases (scaled to an incident power density of 100 W m−2) of 0.74 °C and 1.76 °C, respectively, for the forearm at 10 and 300 GHz, and 0.84 °C and 1.90 °C for the abdomen.
All of the results discussed above are from computational studies. Only one study in table 5 reported experimental measurements of temperature increases in human subjects from exposures to RF energy at frequencies above 6 GHz. Alekseev et al (2005) measured the rise in skin temperature exposed to RF energy at 42.25 GHz, from a rectangular waveguide antenna. In that study, the antenna produced a circularly symmetric Gaussian exposure pattern on the skin. A peak incident power density was 2080 W m−2 on finger and forearm of human subjects. The IPD averaged over 4 cm2 estimated from the IPD distribution on the skin surface was 347.6 W m−2. The value plotted in figure 3 was estimated as 69.5 W m−2 in finger and 37.8 W m−2 in forearm, respectively, assuming the Gaussian field distribution. Based on the theory in Foster et al (2016), Hashimoto et al (2017) suggested an equivalent power density for a smaller beam in terms of the root of the ratio of the exposure area to 4 cm2. The corresponding incident power density over 4 cm2 would be 795.6 W m−2 with a factor of 0.44. The plots in figure 3 would be lowered by a factor of 0.44 from the original value; 159 W m−2 in finger and 86 W m−2 in forearm, respectively, which are in good agreement with other computational analysis.
Table 5. Computational studies including temperature increase: brief exposures.
| Study | Study design | Major findings |
|---|---|---|
| Foster et al (1998) | Analytical modeling study based on simplified BHTE | Experimental agreement with estimated threshold for perception or pain for plane-wave irradiation as a function of frequency and exposure duration. One-dimensional model provides conservative estimation for extreme heating situation (exposure to brief high fluence pulses) |
| Nelson et al (2000) | Modeling study only (layered spherical model for head of monkey) 100 GHz, up to 30 kW m−2 for 3 s or 3 kW m−2 for 30 s. Studied effects on: (1) surface convection coefficient; (2) surface evaporation rate (i.e. sweating); (3) blood-flow rate to the scalp/surface tissue | The peak surface temperature is affected by environmental conditions (convection coefficient, sweat rate). Subsurface temperature increases are considerably lower than increases in surface temperatures |
| Alekseev et al (2005) | Experimental study, forearm and middle finger skin exposed from open ended waveguide at 42.25 GHz. Two-dimensional computational modeling based on BHTE with effective thermal conductivity | Local heating of the skin was greatly reduced by elevated blood perfusion occurring in the forearm and in the finger. The relationship between blood flow and the effective thermal conductivity was linear |
| Morimoto et al (2017) | Modeling (FDTD) 1–30 GHz, layered plane and head models, effects of beam diameter, up to 2000 s | Calculated temperature elevation at the skin surface for short pulse exposure (<10 s, beam of 20 mm) is at least twice higher (15–30 GHz) compared to that produced by continuous exposure. Shorter thermal time constant with higher radiation frequency (16 and 5 min at 1 and 30 GHz) |
| Laakso et al (2017a) | Modeling (FDTD), 6–100 GHz, pulses <10 s. Human face model. Considered maximum-fluence pulses consistent with earlier IEEE and ICNIRP limits | Areas of enhanced absorption near edges of eye and nose, due to complexity of the surface (<10 s). Effect of pulsed exposure duration diminishes as the frequency decreases |
| Foster et al (2018b) | Analytical modeling study based on simplified BHTE | The impulse response to millimeter wave radiation (30–300 GHz) showed a sharp peak temperature rise due to short term accumulation of heat near the surface |
| Kodera et al (2018b) | Modeling (FDTD) 0.1–6 GHz, layered plane and human head models, exposure from 0.01 s to 6 min and pulse train at frequencies 0.1–6 GHz | Maximum temperature rise (brief intense exposure with a total fluence corresponding to the maximum allowable SAR averaged over a 6-min averaging time) exceeded the steady-state temperature above 400 MHz (continuous exposure with the same time-averaged SAR) |
| Neufeld and Kuster (2018) | Analytical approach applied to peak temperature increase in the skin for plane-wave and localized exposures (<600 min) | Estimation of a maximum averaging time of 240 s for mm-waves based on surface heating theory to limit the maximum local temperature increase to 1 °C for pulses of duty cycle ≥0.1 |
Other studies have been reported by Japanese groups funded by Ministry of Internal Affairs and Communications, Japan. Kodera et al (2017) conducted FDTD analysis for rat brain exposed to RF radiation at 6 and 10 GHz from antennas near the body surface. The experimentally measured and computed temperature rises were in good agreement, considering the effects of vasodilatation (Masuda et al 2011, Rakesh et al 2013) predicted by a thermoregulatory model. Straightforward comparison of these results with other studies is not feasible, because the rats' brain is 2 g which is much smaller than 10 g, which is used in the averaging mass of SAR. Further investigation is needed on how to extrapolate the findings of small animals to humans.
Kojima et al (2018) exposed the eyes of rabbits to millimeter waves at 40, 75, and 95 GHz (extended in 2020 to 162 GHz) and documented damage to the eyes (as well as eyelids) depending on exposure (Kojima et al 2020). Those authors measured increases in corneal temperature during the exposure; the initial temperature was 34.5 °C and then reached 37.6 °C at 6 min for exposure with 500 W m−2 at 75 GHz. So far, no detailed thermal modeling of this exposure situation has been reported.
5. Temperature rise after brief exposures
5.1. Review of computational dosimetry
Studies that have investigated the effects of brief pulses or sequences of brief pulses incident on skin have are reviewed in this section. For exposure times much shorter than the thermal time constant τ2 in (5b ), the surface temperature increases almost linearly with time in accordance with equation (8) while for longer times (several seconds or more at mm-wave frequencies) the surface temperature increases as the square root of time. Nine papers were included in the review.
Foster et al (1998) proposed an equation for an upper-limit increase in skin temperature assuming a one-dimensional model that applies in extreme heating situations, e.g. if all of the exposure during the averaging time occurs in one brief pulse, and estimated thresholds for perception or pain for plane-wave irradiation as a function of frequency (1–300 GHz) and exposure duration. They also discussed how the microwave and laser standards differ in their formulation, particularly with respect to thermal averaging time. (This early study has largely been supplanted by more recent and more detailed studies by Foster et al cited elsewhere in this review.)
Nelson et al (2000) calculated the temperature rise in a spherical four-layer model of the body produced by exposure to intense RF pulses (100 GHz) of duration 3 s (10–30 kW m−2) and 30 s (1–3 kW m−2). In both cases, the applied energy densities (pulse fluences) were 30–90 kJ cm−2. The calculated increase in skin temperature was 22 °C–24 °C from a 3 s pulse and 7 °C–12 °C from a 30 s pulse, in each case with a fluence of 90 kJ m−2.
Morimoto et al (2017) computed the thermal time constant, defined in that study as the time for the peak temperature increase to fall by a factor of 1/e (approximately τ1 in (5a )), in anatomically detailed image-based models of the human body for exposure frequencies up to 30 GHz. They showed that the thermal time constant declines with increase in frequency to reach 16 min at 1 GHz and 5 min at 30 GHz, respectively. These changes result from different power penetration depths. Deep tissues (e.g. brain) have a slower thermal response than superficial tissues due to the fact that most of the RF energy is deposited outside of the skull in the scalp and the deposited heat has to be conducted through the skull into brain tissue, which increases the thermal response time of the brain to 10–30 min.
Laakso et al (2017a) computed the temperature rise in the human face produced by plane wave pulses shorter than 10 s at frequencies from 6 to 100 GHz. The time constants that characterize the rate of temperature rise depended on the three-dimensional distribution of energy absorption, with more localized absorption near the body surface resulting in a more rapid initial increase in temperature and shorter thermal response times. Laakso et al (2017a) showed that the peak temperature rise was below 1.5 °C for a pulses of < 0.1 s duration and fluence of 1 kJ m−2.
Foster et al (2018b) compared the temperature rise produced by a single RF pulse or pulse train with a pulse duration of 0.57 ms to 1000 s at frequencies 1–300 GHz from predictions of the 1D baseline models and more detailed calculations based on an anatomical human head model. The RF radiation consisted of both plane waves incident on the head, and radiation from a dipole antenna close to the head. The impulse response to millimeter wave radiation (30–300 GHz) showed a sharp peak temperature rise due to short term accumulation of heat near the surface.
Kodera et al (2018b) investigated the transient temperature rise from exposure to pulses of 0.01 s–6 min, considering individual pulses and pulse trains, at frequencies 0.1–6 GHz. The maximum transient temperature rise produced by a maximally intense pulse (with the maximum fluence permitted by the exposure limit times the 6 min averaging time) exceeded the steady state temperature rise produced by continuous exposure with the same time-averaged SAR, at frequencies above 400 MHz. These authors subsequently extended their studies to the frequency range from 6 to 300 GHz in Kodera and Hirata (2019). Similar results have been reported by Foster et al (2019, 2020).
Neufeld and Kuster (2018) carried out a worst-case thermal analysis of thermal response of tissue using the surface heating approximation for pulse-train exposures. They suggested a maximum averaging time of 240 s for mm-waves to limit the maximum local temperature increase to 1 °C for pulses of duty cycle ≥0.1. The validity of the surface heating approximation for simulations of transient heating by brief intense pulses has been discussed Foster (2019) and Neufeld and Kuster (2019) (see section 4.2).
Foster et al (2020) calculated transient temperature increases in the backs of human subjects exposed to high-fluence 3 s RF pulses at 94 GHz. The measured temperature increases in 10 subjects (7 males, 3 females) on their backs to 3 s 94 GHz pulses with incident power densities ranging from 9 to 17.5 kW m−2 were in reasonable agreement with predictions based on the 1D baseline model described above equation (3) using values for thermal and electrical parameters taken from the literature without further adjustment. The authors suggested that a consistent residual error of about 20% between the data and predictions of the 1D model were within the range of uncertainty in the literature values for the model parameters. Similar modeling of the transient temperature rise in the corneas of rabbits exposed to similar RF pulses (Foster et al 2003) was less successful due to the high variability in the temperature rises in the cornea, which is attributable to the presence of standing waves caused by scattering of RF energy from the eyelid. The overall conclusion from these studies is that the thermal response of tissue to mm-waves over short time periods (seconds to tens of seconds) is chiefly determined by thermal conduction, a relatively simple process, and that effects of blood perfusion (which are much more difficult to model with accuracy) only become significant for longer times.
5.2. Comparison of computation and analytic solution
Figure 4 compares the transient temperature rise in skin for RF pulses with constant fluence of 36 kJ m−2 for different pulse widths. The analytical solution of the 1D baseline model agree well numerical solution (FDTD method) for the model. However, the surface heating approximation overestimates the transient temperature increase for short pulses of duration <1 s) due to the singularity in its transient response as discussed above. (The surface heating approximation is much more accurate for pulse widths >1 s and particularly for the steady-state temperature increase.) For short pulses the errors introduced by the surface heating approximation can be very large, e.g. 182 times for 10 μs, 18 times for 1 ms. Thus, while the surface heating approximation results in simple analytic results for the increase in surface temperature at mm-wave frequencies, its limitations for short pulses should be considered as commented in Foster (2019).
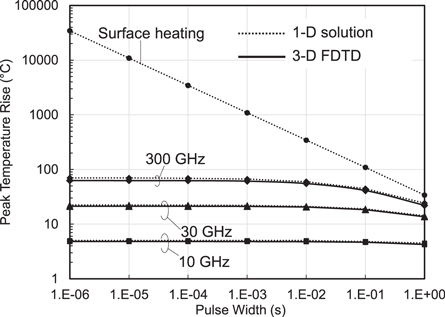
Figure 4. Instantaneous temperature rises in a 1D model for skin, comparing analytical results for the model, the surface heating approximation, and a detailed numerical solution using the 3D FDTD method. This figure shows the large errors introduced for short pulses (<1 s) using the surface heating approximation.
Download figure:
Standard image High-resolution image5.3. Comparison of computation and measurement
Perhaps the most extensive measurements of the temperature increase from pulsed mm-waves were done under support of the US Department of Defense beginning in the late 1990s as part of a program to develop an (as yet unused) nonlethal weapons system, called the Active Denial system (Zohuri 2019). The weapon beams brief (about 3 s duration) pulses of high intensity mm-waves (94 GHz) at targets with the aim of eliciting cutaneous thermal pain without causing thermal burns.
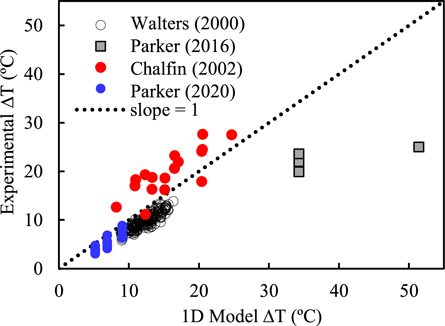
Figure 5 shows the measured temperature increase in rhesus cornea (Chalfin et al 2002, Parker et al 2020) and skin from human subjects (Walters et al 2000, Parker et al 2016) exposed to 2–4 s pulses of 94 GHz RF energy versus calculated results from the 1D model. The calculations were done using the 1D baseline model with no adjustable parameters: the thermal parameters for dry skin and cornea were taken from the IT'IS dataset (Hasgall et al 2015) and the electrical parameters were calculated from dielectric data in Gabriel et al (1996). Under the exposure conditions (short pulses) of these experiments, the conduction-only approximation (equation (7)) closely agrees with the full solution to the bioheat equation.
Figure 5. Calculated versus measured transient temperature increase in rhesus cornea (blue, red dots) and skin of human subjects (black circles, squares) from brief (2–4 s) pulses of 94 GHz radiation. Each point represents a single measurement. Calculations for the 1D model used literature values for dielectric and thermal parameters for skin and cornea without further adjustement.
Download figure:
Standard image High-resolution image
Three of the sets of results (Walters et al 2000, Chalfin et al 2002) in figure 5 agree well with the predictions of the simple 1D model (equation (3)), while the other (Parker et al 2016) diverges from the model. A larger scatter in the earlier set of data from the rhesus cornea results (Chalfin et al 2002) because that study recorded temperature increases across the whole cornea, which were strongly affected by standing wave effects, while the more recent study (Parker et al 2020) analyzed temperatures only from in the central 1/3 of the cornea to avoid interference effects (Foster et al 2020). The outlying data points for skin (Parker et al 2016) have no apparent explanation and dosimetry errors cannot be excluded.
6. Discussion
From the review presented above, the following comments address remaining uncertainties in the modeling that should be addressed by future studies.
6.1. Parameter uncertainty
6.1.1. Uncertainties in dielectric properties
The dielectric properties of tissue determine the absorption of RF energy as well as reflection of energy from a tissue surface. There are, however, a number of important sources of uncertainty in these parameters. Variabilities in tissue composition (in particular tissue inhomogeneity and water content) contributes the variability in the tissue dielectric properties. In particular, the variabilities in tissue water content tends to be large in the tissues with low water content, and that to fat contributes by a factor of 3 of the tissue dielectric properties (Gabriel and Peyman 2006, Sasaki et al 2017, Pollacco et al 2018). In addition, the variation of tissue dielectric constant with temperature in the range 6–100 GHz is marked, because of the strong effects of temperature on dielectric dispersion of water (the main constituent of tissue) in this range (Andryieuski et al 2015). Most thermal modeling studies use parameter values for the dielectric properties of tissues taken from a few sources, which contributes to the consistency of results across studies but not necessarily to generalizability of results. These data were typically measured in excised animal tissues that may not accurately reflect the dielectric properties of human tissue in vivo. Moreover, most studies used a constant set of dielectric properties for skin. However skin is a heterogeneous tissue, and the water content of stratum corneum differs considerably from that of epidermis, and the relative thickness of the stratum corneum is highly variable across the body (Gao et al 2018). Consequently, the use of a lumped parameter to represent dielectric properties of 'skin' will introduce considerable uncertainty. The variation of tissue dielectric properties by animal species and physiological condition needs further clarification.
6.1.2. Uncertainties in material thermal properties
The material thermal properties of tissues (thermal conductivity, heat capacity, thermal diffusivity) used in modeling studies are mainly based on a few sources (Bowman et al 1975, Duck 1990, Mcintosh and Anderson 2010a, Hasgall et al 2015). These properties were mostly measured in excised animal tissues. The transient thermal response of skin can vary by 50% or more depending on the values for the individual parameters that are chosen in the literature, which show considerable variability (Hasgall et al 2015). Lipkin and Hardy (1954) reported that the thermal inertia of skin increased by more than a factor of 4 with vasodilation. Those investigators obtained values for 'thermal inertia' by fitting heating curves for skin exposed to infrared radiation over short (20 s) time periods to an equation equivalent to the present equation (8). Whether this reflects a change in the bulk thermal properties of skin, perhaps related to eccrine glands filling up with sweat, or some other factor is unclear.
6.1.3. Physiological variability
Reflecting its thermoregulatory function, skin is well supplied with blood vessels, and skin blood flow can vary by more than an order of magnitude depending on thermoregulatory status of an individual (ILO 2012). Under ordinary room conditions, skin blood flow in humans varies by factors of 2–4 or more depending on the part of the body and the measurement technique (Hertzman and Randall 1948). Skin blood flow in the head under resting conditions may vary by a factor of 3 and also depends on the direction relative to the skin surface because of the geometry and orientation of the capillary bed (Laakso et al 2017b). Since the steady state temperature scales as ω b −1/2 this could lead to uncertainties of a factor of two or more in calculated temperature rises in skin, particularly in the steady state. Increasing skin temperature will cause other changes as well, such as filling eccrine sweat glands with sweat, that will affect its electrical and bulk thermal properties (Mayrovitz 2020).
6.1.4. Anatomical variability
Variability in tissue segmentation is another comparatively unexplored source of variability in thermal modeling studies. Sasaki et al (2017) reported that variations in thickness of subcutaneous tissue layers among different individuals contributed more to variability in calculated steady-state temperature increases than measurement uncertainties of dielectric properties. Subcutaneous fat acts as a layer of thermal insulation and greatly affects the steady state increase in skin temperature (Ziskin et al 2018), and its thickness varies greatly among individuals and in different parts of the body. Individual features of the face or other body parts affect the distribution of the absorbed RF energy due to reflection and interference effects (Laakso et al 2017b). Their effects on inter-individual variability of temperature increases have not yet been studied.
6.2. Validity of BHTE
The BHTE (equation (1)) is one of several theoretical models that have been proposed for heat transfer in vascularized tissues, all of which are approximations (Baish 2000, Hristov 2019). The BHTE was initially formulated under the assumption that heat exchange occurs in the capillary bed. In fact, most heat exchange in tissue occurs in larger vessels of diameter ranging from 80 μm to 1 mm (Baish 2000). Smaller vessels, e.g. capillaries, are thermally equilibrated with surrounding tissue and do not transport heat through tissue, while larger vessels are too few in number to transport a significant amount of heat in tissue (but they do create temperature gradients in their vicinity and set up different heat transfer processes such as counter current heat flow). While such vessels can be included explicitly in a thermal model for RF dosimetry (e.g. Kotte et al 1996 and Flyckt et al (2007), that would greatly complicate the problem and may require more data than is available.
While this does not invalidate the use of the BHTE, it points to the need for caution in its interpretation. In the BHTE, the 'temperature' has to be interpreted as an average over a control volume that encompasses many thermally significant vessels, and which is not close to larger blood vessels. The blood flow parameter in the BHTE is conceptually different from tissue perfusion that is measured by laser Doppler flowmetry, for example (which measures velocity of red blood cells as opposed to volumetric flow). As Baish (2000) pointed out, 'As long as ωb (the blood perfusion parameter) and Ta (arterial temperature, identified as Tb in equation (1)) are taken as adjustable, curve-fitting parameters rather than literally as the perfusion rate and arterial blood temperature, the model may be used fruitfully, provided that the results are interpreted accordingly.' For an example of a successful use of curve-fitting the blood perfusion parameter for hyperthermia treatment planning, see (Verhaart et al 2014, DeFord et al 1990). By contrast, nearly all of the thermal modeling studies discussed above were based on blood perfusion and other parameters taken from the literature, which will provide a representative value of the temperature increase in an actual subject but the results are hardly exact.
In spite of these caveats, limited comparisons with data show that the BHTE does an excellent job of predicting transient temperature increases, and a reasonable job of predicting long-term (steady state) temperature increases in RF-exposed tissues over a wide range of exposures (Kanezaki et al 2010, Foster et al 2018a). No studies, however, have been reported in which a representative group of human subjects were exposed to RF energy in the presently considered frequency range with measurements of the resulting increase in skin temperature; the few available studies (e.g. Alekseev et al 2005) employed very few subjects and a limited range of exposure parameters. Nearly all thermal modeling studies have employed standard literature values for thermal parameters, few have experimentally validated the model results, and only a few studies have used subject- specific values of blood flow (Laakso et al 2017b). Uncertainties could be partly assessed through the use of a sensitivity or, more elaborately, a Monte Carlo analysis to calculate a distribution of temperatures over different combinations of parameters (e.g. Sasaki et al 2017, Li et al 2019) but ultimately more data are needed.
6.3. Thermoregulation
Except one study (Kodera et al 2018a), thermoregulation was not considered in the computational evaluation of the local temperature rise. Skin blood flow is controlled by both core body and local skin temperature. Raising skin temperature from 32 °C to 40 °C at an ambient temperature of 22 °C results in a >10-fold increase in skin blood flow (Song et al 1989, Charkoudian 2003). (However, local cutaneous microvascular responsiveness is impaired in patients with type 2 diabetes mellitus, making them more susceptible to heat stress Charkoudian 2003.) A thermal model that does not take into account the increase in skin blood flow with skin temperature will overpredict temperature increases in skin, increasing safety margin. Conversely, cool ambient temperatures will lead to lower skin temperatures and reduce skin blood flow (Milan (1961)) and will cause a model to under-predict the RF-induced rise in skin temperature, although such errors are probably of secondary importance when designing RF safety limits. However, the effects of thermoregulatory responses on RF-induced increases in skin temperature have not yet been well studied and remain to be clarified.
6.4. Whole-body exposures
The IEEE C95.1 standard and ICNIRP guideline have extended the frequency range of exposure reference level (IEEE) and reference level and basic restrictions (ICNIRP up to 300 GHz, versus 100 GHz in previous versions of the guidelines. Limits on whole-body exposure are designed to take into account the total heat load on the human body from exposure at these frequencies. Only two studies considered here have reported changes in core body temperature from whole body exposures, and only up to 6 GHz (Hirata et al 2013, Moore et al 2017).
As in comments in section 5.3, most of the computational studies reported here assume an ambient (or environmental) temperature of around 22 °C–28 °C (room temperature). In a modeling study, Moore et al (2017) investigated the effects of exposure to RF energy in environments with elevated temperatures and high relative humidity, considering situations where heavy protective clothing must be worn. One scenario assumed exposure to RF energy at 6 GHz in an environment with ambient temperature of 38 °C and relative humidity of 60% (nearly an intolerable environment, with a 'heat index' value on the threshold of 'extreme danger'). In this environment, whole body exposure at 252.5 W m−2 (whole body average SAR of 0.4 W kg−1) increased local temperature by only 0.3 °C in the eyes and the testes, with smaller and physiologically insignificant rises in skin, bone marrow, brain and core. These exposure levels are considerably higher than IEEE and ICNIRP occupational exposure limits (50 W m−2). Clearly more work needs to be done in this area, although at this stage, it would appear that the effects of added RF will be minor in comparison to the effects of altered ambient conditions.
7. Summary
This paper reviewed the dosimetric/analytic studies for human exposure to radio frequencies above 6 GHz where new wireless communication systems were deployed. Systematic review has been conducted for the studies on steady-state temperature for sinusoidal wave exposures and transient temperature rise for short pulse or pulse-train exposures. Though a limited number of studies have been reported on experimental studies, fair agreement between analytical, computational, and experimental temperatures was observed. The research necessity, especially for experimental studies, has been outlined for quantifying the uncertainty of computational results as well as improving the rationale of the limits in the international guidelines/standards.
Appendix
A search strategy was developed to retrieved using Web of Science database covering the period from 1990 to 2020. All the retrieved papers are screened to assess soundness based on the title and abstract by two reviewers. Then, the full contents of the papers that passed the initial screening are revised and classified as 'relevant' or 'excluded' by one reviewer. Additional papers were screened in Google Scholar engine and included if they were of high relevance.
The papers were excluded on the basis that they were no computational dosimetry studies, review/commentary papers without any new results, or not relevant for dosimetries at frequencies above 6 GHz. In sections 4.1 and 5.1, search strategies developed were summarized in tables A1 and A2, respectively. If the reviewers found technical weakness and limitation, points were mentioned.
Table A1. Search strategy (skin and eye above 6 GHz). The term 'relevant' indicates the number of studies identified from the database that were not excluded.
| Search data | TS = (Temperature$) | ||||||
| AND TS = ('Heating' OR 'Thermal Model*' OR Bioheat OR 'Bio-heat' OR 'Power density') | |||||||
| AND TS = ('Millimet* Wave$' OR mmW$ OR 'Millimet* Band$' OR '5 G' OR '5th generation') | |||||||
| AND TS = (eye$ OR skin OR Phantom$) | |||||||
| Identified from database | 56 | Excluded (not relevant) | 46 | Relevant | 10 | Identified from other sources | 4 |
| Included in analysis | 14 | ||||||
Table A2. Search strategy (brief exposure). The term 'relevant' indicates the number of studies identified from the database that were not excluded.
| Search data | TS = (temperature$) | ||||||
| AND TS = ('Heat* ' OR 'Thermal Model*' OR Bioheat OR 'bio-heat') | |||||||
| AND TS = (Microwaves$ OR Millimet* OR mmW$ OR Radiofrequency OR 'Radio-frequency') | |||||||
| AND TS = (Eye$ OR Skin OR Tissue$) | |||||||
| AND TS = (Brief OR 'Short-Duration' OR Train OR 's Exposure$' OR 'Time Constant$' OR 'Few minutes' OR 'Few seconds' OR 'heating kinetics') | |||||||
| Identified from database | 43 | Excluded (not relevant) | 37 | Relevant | 6 | Identified from other sources | 3 |
| Included in analysis | 9 | ||||||
Footnotes
- 7
ICNIRP refers to its limits as 'guidelines' while IEEE uses the term 'standard'. For conciseness the term 'limit' is used to refer to either guideline/standard.