
Export citation and abstract BibTeX RIS
The original published paper titled 'The impact of sensitive volume (SV) thickness for silicon on insulator microdosimeters in hadron therapy' (Bolst et al 2020), showed the effect which the SV size had on microdosimetric values by means of Monte Carlo simulations.
We have since discovered that the electron production used in these simulation were 250 keV instead of the stated value of 250 eV in the publication. The electron production is the minimum kinetic energy that a secondary electron must have in order to be produced in the simulation, such as via ionisation. If an ionisation interaction were to occur in the simulation where the secondary electron would have a kinetic energy below the production threshold, then the electron would not be produced/tracked in the simulation. Instead, the electrons kinetic energy that it would have had, is deposited at the point where it would have been generated, instead of transporting the electron in the simulation and depositing energy at multiple positions.
The main consequence of the simulation having a higher production value is when a charged particle traverses a detectors SV or its surrounding material. Many of the delta electrons which would have been produced with a kinetic energy of less than 250 keV in the SV would not have deposited all their energy in the volume, instead only a fraction of their energy. This results in the lineal energy values calculated being derived from an energy deposition which is shifted towards the energy lost value (linear energy transfer (LET)).
The higher production threshold effects thinner SVs the most, since a thicker volume will have the same amount of energy being artificially deposited, causing smaller SVs to have higher values of lineal energy. In addition to thinner SVs being more strongly effected, lower LET beams (protons in this context) will be more effected due to having an LET much more closer to electrons compared to higher LET beams such as carbon ions.
We sincerely apologise for this error and any confusion that the original results may have caused with the production threshold of 250 keV instead of the stated value of 250 eV. The simulations have consequently been re-run with the more appropriate production threshold of 250 eV, with the updated results/figures provided. For the benefit of the reader, an explanation is provided for each updated figure, describing the reason for the distributions values changing from the original.
Despite the updated results shifting from their original values, the general conclusion of the original paper does not change. This being that microdosimetric quantities measured with different sized SVs can greatly vary due to the effects of straggling and the track density (electron production) of the beam and care should be taken when comparing two measurements against one another. However, the specific values have shifted from their original as a result of the updated electron production threshold.
Figure 3—shows the lineal energy distributions for H, He and C beams at depths of 10 and 140 mm in water for different thicknesses of SVs. The updated results change fairly subtly from the original, since the spectra mostly shows the primary beams peak, the peak itself will not be strongly changed from the energy lost versus the energy it deposits in the energy range. However, due to extra electrons being produced you can see an increase in the far left of the spectra, where delta electrons enter the SV and deposit energy.
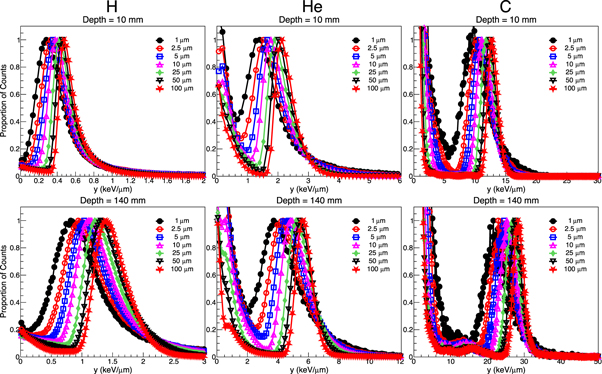
Figure 3. Updated figure 3.
Download figure:
Standard image High-resolution imageFigure 4—plots the width and position of the primary beams peak for the different thicknesses of SVs. These results again remain largely unchanged since the primary beam will deposit a significant portion of the energy in the SV compared to its delta electrons it produces in the SV.
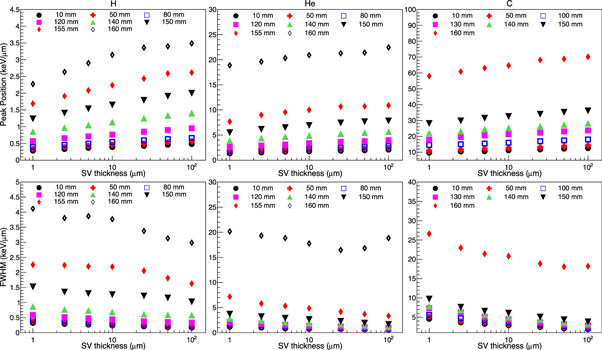
Figure 4. Updated figure 4.
Download figure:
Standard image High-resolution imageFigure 5—shows the dose lineal energy spectra (yd(y)) at 10 mm in water for the different ion beams. Unlike figure 3, which showed linear spaced binned spectra without weighting the lineal energy events, figure 5 weights the higher lineal events more, with them being proportional to the lineal energy. The extra weighting to the higher lineal energy events means that the results are more noticeable when viewing with log binned data, which extend to higher lineal energies. The original results showed a high energy tail which extended to ∼100 keV μm−1 for 1 μm volumes and decreased for thicker volumes. The prominence of this tail, seen the most for protons, was due to the larger production threshold causing electrons which would have been created in the SV with an energy of <250 keV depositing all of their energy in the SV instead of only a fraction. Using the more realistic production threshold of 250 eV results in the high lineal energy tail not extending to as high values. Additionally, it was noticed that the position of the peaks of the original spectra were lower than those in figure 3, this was due to the silicon to tissue conversion factor being applied twice instead of once when plotting the log binned data, shifting the spectra to lower lineal energies.
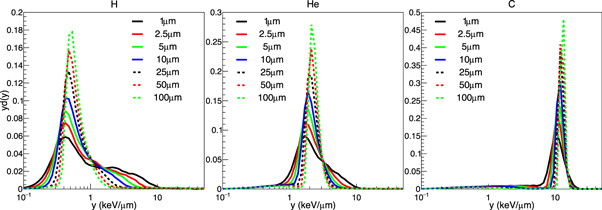
Figure 5. Updated figure 5.
Download figure:
Standard image High-resolution imageFigure 6—shows the mean lineal energy, yF , at different depths in water for different thicknesses of SVs/detectors. The overall trends and cause of the results do not vary significantly, however the lower LET beams (proton and helium) now show a larger dependency on the SV thickness. This is due to so few electrons being produced originally for these beams, making yF being close to LET, especially for protons. Like previous results, the larger SVs have larger values of yF , due to the range of electrons being relatively small, causing the LET of electrons to increase within the SV. As a comparison, a 10, 30 and 125 keV electron will have ranges of ∼1, 10 and 100 μm in silicon, respectively, with the LET being ∼4, 2 and 1 keV μm−1.
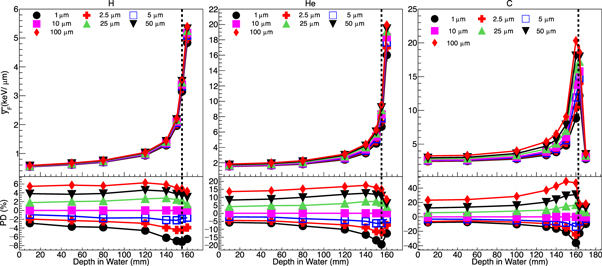
Figure 6. Updated figure 6.
Download figure:
Standard image High-resolution imageFigure 7—shows the dose mean lineal energy, yD , at different depths in water for different thicknesses of SVs. The updated yD results show noticeable differences with the original, with the original showing higher values with thinner SVs due to electrons below 250 keV, which would have been created in the SV, depositing all their energy in the SV regardless of the thickness, causing thinner volumes to have higher maximum lineal energy values. Since yD is the second moment of the lineal energy distribution divided by yF , it means that the higher lineal energy events contribution will be amplified.
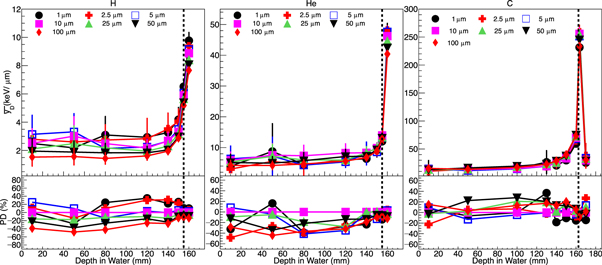
Figure 7. Updated figure 7.
Download figure:
Standard image High-resolution imageFigure 8—compares the yD values of 1 μm thick SVs in proton beams, calculated using different maximum lineal energy values for the spectra. As mentioned above for figure 7, yD will amplify the contribution of higher lineal energy events, which will be artificially higher with a higher electron production threshold. With the updated results lower production threshold, the extent of the higher lineal energy events are reduced, minimising the impact of calculating yD with higher maximum lineal energies.

Figure 8. Updated figure 8.
Download figure:
Standard image High-resolution imageFigure 9—compares the RBE values estimated using the MK model. The updated RBE trends are similar to the updated yD , however RBE reduces the fluctuations caused by high lineal energy events, resulting in clearer trends. As with the original yD results, the original RBE results showed a simple trend of the smaller SVs having larger values, for the case of protons this trend still exists for the updated results but for the reasons mentioned for yD , the extent of this is diminished. For the carbon ion beam results however, the updated results show the smaller SVs having smaller values. The reason for these opposite trends of the proton and carbon beams is due to the different densities of delta electrons, with carbon having a much higher number of electrons produced. Lower electron density means higher energy deposition straggling (wider distributions), which when weighting events by lineal energy (yD and RBE) causes the wider distributions to have higher values. Additionally, as mentioned for yF , with the relatively short range of electrons, their LET can increase significantly the further they travel in the SV. The updated helium beam results are a mix between the proton and carbon results, resulting in it being the least sensitive to thickness out of these configurations.
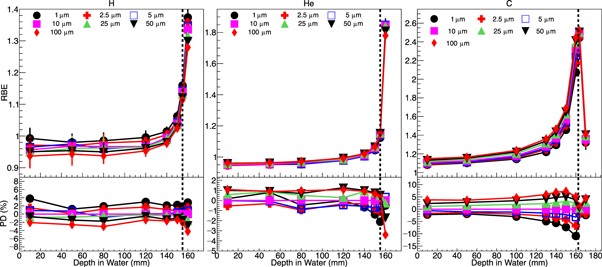
Figure 9. Updated figure 9.
Download figure:
Standard image High-resolution imageFigure 10—shows the yF , yD and RBE values of various different sized volumes for proton beams but considers hits in the detector in terms of if the particle track is a (1) electron or (2) a primary ion track, entering the SV.

Figure 10. Updated figure 10.
Download figure:
Standard image High-resolution imageThe 'electron only' data, represents electron tracks generated outside of the SV and enters the SV, as well as any electrons the incident electron generates within the SV. Due to the updated results having a much lower electron production, the number of electrons produced/entering the SV and their energy spectra varies noticeably. When all electrons above 250 eV are considered the updated results show a more uniform trend across yF , yD and RBE, with the smaller the SV the higher the quantity. This mimics the general trends of the original results except that yF generally had higher values for larger SVs due to the much higher incident energy spectra and production of secondary electrons within. As mentioned above, the electrons will increase in LET relatively rapidly so the larger the volume the higher the LET the electron would reach. Due to the original results high production threshold value, fewer electrons would stop in the SV, but now that many more low energy electrons are created, many will stop in the SVs, with larger volumes having artificially lower values of lineal energy. The effect of this increases near the end of the protons range, where the delta electrons produced have low enough energy that a greater portion will stop within the larger volumes, causing the smaller SVs to have even higher values.
For the 'primary only' distributions, the trend of the yF distributions change noticeably with the updated results, with the original plots showing the different SVs to be almost constant, while the updated results show a ±10% dependence on the SV size. The reason is due to the original production threshold causing very few electrons to be produced from the primary proton, this effectively means that the energy loss (stopping power/LET) was being sampled (almost). With the updated results using the smaller production threshold of 250 eV you can now see the strong influence from delta electrons being produced in the SV from the primary proton beam. Unlike the 'electron only' data which considers hits as when an electron enters a SV and any electrons which are subsequently produced in the SV, the yF values are larger for the 'primary only' data for the larger SVs. This is due to the electrons which contribute to these 'primary only' hits are produced within the SV from the primary ion, instead of outside the SV like for the 'electron only' data, meaning that much fewer of the electrons will stop in the SV when they are produced inside of the SV itself. Which again, due to the relatively short range and rapid increase of the electrons LET, causes the larger volumes to have higher values of yF , with the difference in the SVs reducing near the end of the protons' trajectory due to the decreased range of the delta electrons being produced.
The yD and RBE distributions for the 'primary only' data follow the same trends as the original publications results, with the smaller SVs having larger values, but as mentioned earlier for figure 7, the extent of this is reduced due to the more realistic production threshold being used. Since the trends of yD are much 'cleaner' without the presence of high LET secondary particles it may be beneficial to point out that the yD , and RBE to a lesser extent, enhance the effects of straggling due to the extra weighting of lineal energy on the distributions. The yF distributions do not give extra weighting to different lineal energy events, so two distributions which have the same yF but one is sharp while the other is wide (higher straggling), when calculating the yD value, due to the extra weighting on higher lineal energy events will cause the wider distribution to have larger values, as mentioned in the original publication. yF is instead noticeably influenced from delta electrons produced inside the SV, due to the electrons' relatively short range causing their LET to increase more in larger SVs.
Figure 11—presents the same data as figure 10 but for carbon ion beams instead of proton beams. The updated results for carbon ions follow a similar trend as the updated proton results with the exception of yD and RBE for the 'primary only' distributions. Due to carbons denser track structure, the lineal energy distributions produced are much sharper and do not have a strong influence from straggling because of this, as seen in figures 3 and 5. The updated results for both yD and RBE differ from the original, which as mentioned earlier for figures 7 and 9 is due to the different production threshold. Additionally, due to protons less dense track structure it has a smaller contribution from delta electrons and a higher contribution from the primary beam itself compared to the higher LET beams such as carbon ions.
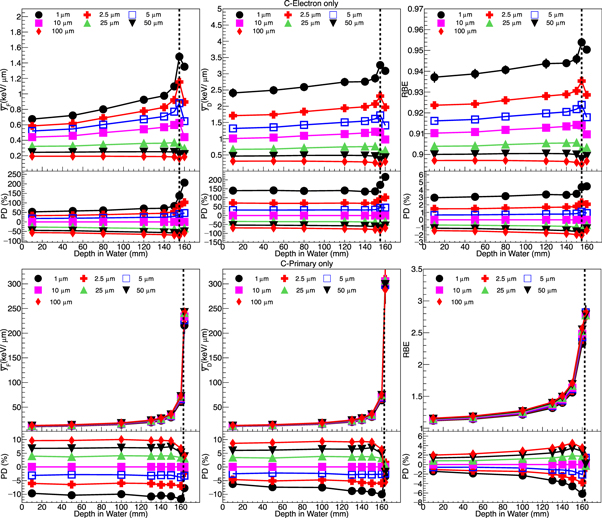
Figure 11. Updated figure 11.
Download figure:
Standard image High-resolution imageFigure 12—compares the response of different sized spheres and cylinders in terms of yF , yD and RBE. The differences in the updated results follow the same reasons as mentioned for the previous figures.

Figure 12. Updated figure 12.
Download figure:
Standard image High-resolution image
Conclusions
The impact of the SV thickness of SOI microdosimeters was investigated in therapeutic mono-energetic proton, 4He and 12C ion beams. SV thicknesses were investigated between 1 and 100 μm. Larger SV thicknesses were seen to cause the lineal energy spectra peak to be shifted to higher energies and produce a sharper peak.
The microdosimetric quantity  was seen to be strongly influenced by the delta electron production density of the beams. With larger SVs having larger values of
  due to the relatively small range of electrons, meaning that their LET could increase significantly within the SV. The difference in
  among the SVs increased towards the pinnacle of the BP. With 12C being impacted the most from SV size due to its much higher delta electron production, with a maximum difference of ∼40% in
  between the 1 and 10 μm thick SVs, while the proton beam only had a maximum difference of ∼7% and 4He ∼20%.
In contrast to  , the trends of
  showed fluctuations due to high LET secondary particles created through inelastic nuclear reactions, with
  weighting lineal energy events by an additional factor of y compared to
  . Unlike
  , the response of
  varied differently among the SVs depending on the beam, with the lower LET proton beam having higher values of
  for smaller SVs, while the higher LET carbon ion beam resulted in the smaller SVs generally having lower values of
  . This is due to the competing effects of straggling, more prevalent for lower LET particles, and delta electrons increasing in LET as they traverse the SVs. With the differences between the
  values for the 1 and 10 μm SVs being on average ∼20% higher for the proton beam, 20% lower for 4He and ∼10% lower for 12C.
The calculated RBE values had similar trends as  but with reduced fluctuations, due to over-killing corrections of the model reducing the effect of high lineal energy events. Lower LET beams had higher values of RBE for smaller SVs, while higher LET beams had lower values of RBE for smaller SVs. The differences at the start of the beam between the 1 and 10 μm thick SVs was ∼4% higher for the proton beam, ∼0% for 4He beams and ∼2% lower for the 12C beam. However, near the pinnacle of the BP the differences were ∼2% higher for the proton beam, ∼2% lower for the helium beam and ∼10% lower for the 12C beam.
Due to the dependency of the SV size on the  ,
,  and RBE, care should be taken when comparing microdosimetric quantities obtained with different sized SVs.