
Abstract
The noninvasive detection of tumor proliferation is of great value and the Ki-67 is a biomarker of tumor proliferation. We hypothesized that radiomics characteristics may be related to tumor proliferation. To evaluate whether computed tomography (CT) radiomics feature analyses could aid in assessing the Ki-67 marker index in hepatocellular carcinoma (HCC), we retrospectively analyzed preoperative CT findings of 74 patients with HCC. The texture feature calculations were computed from MaZda 4.6 software, and the sequential forward selection algorithm was used as the selection method. The correlation between radiomics features and the Ki-67 marker index, as well as the difference between low Ki-67 (<10%) and high Ki-67 (≥10%) groups were evaluated. A simple logistic regression model was used to evaluate the associations between texture features and high Ki-67, and receiver operating characteristic analysis was performed on important parameters to assess the ability of radiomics characteristics to distinguish the high Ki-67 group from the low Ki-67 group. Contrast, correlation, and inverse difference moment (IDM) were significantly different (P < 0.001) between the low and high Ki-67 groups. Contrast (odds ratio [OR] = 0.957; 95% confidence interval [CI]: 0.926-0.990, P = 0.01) and correlation (OR = 2.5☆105; 95% CI: 7.560-8.9☆109; P = 0.019) were considered independent risk factors for combined model building with logistic regression. Angular second moment (r = −0.285, P = 0.014), contrast (r = −0.449, P < 0.001), correlation (r = 0.552, P < 0.001), IDM (r = 0.458, P < 0.001), and entropy (r = 0.285, P = 0.014) strongly correlated with the Ki-67 scores. Contrast, correlation, and the combined predictor were predictive of Ki-67 status (P < 0.001), with areas under the curve ranging from 0.777 to 0.836. The radiomics characteristics of CT have potential as biomarkers for predicting Ki-67 status in patients with HCC. These findings suggest that the radiomics features of CT might be used as a noninvasive measure of cellular proliferation in HCC.
Export citation and abstract BibTeX RIS

Original content from this work may be used under the terms of the Creative Commons Attribution 3.0 license. Any further distribution of this work must maintain attribution to the author(s) and the title of the work, journal citation and DOI.
Abbreviations
| HCC | hepatocellular carcinomas |
| IHC | immunohistochemistry |
| CT | computed tomography |
| EAP | early arterial phase |
| LAP | late arterial phase |
| PVP | portal venous phase |
| EP | equilibrium phase |
| ROI | region of interest |
| GLCM | gray-level co-occurrence matrix |
| ASM | angular second moment |
| SumOfSqs | sum of squares IDMinverse difference moment |
| ROC | receiver operating characteristic |
| WHO | World Health Organization |
| AUC | areas under the curve |
| OR | odds ratio |
| CI | confidence interval |
Key points
1. Investigate whether CT radiomics features analyses could aid in assessing Ki-67 marker index of hepatocellular carcinoma (HCC).
2.ASM, contrast, correlation, IDM, and entropy showed strong correlations with the Ki-67 scores. Contrast and correlation were considered independent risk factors for combined model building with logistic regression.
3. The radiomics characteristics of CT have potential as biomarkers for predicting Ki-67 status in patients with HCC.
1. Introduction
Hepatocellular carcinoma (HCC) has become the second most common cancer in the world and the sixth most common cause of cancer-related death(Zhang et al 2019), causing a considerable global health burden (Ke et al 2019). Attempts have been made to predict the therapeutic effect and prognosis of patients with HCC (Huang et al 2015). At present, pathological methods are often used to determine the state of tumor proliferation. However, pathological evaluation is limited to small nodules at the time of diagnosis, and these lesionsare limited to patients with good liver function. Biopsies, an invasive and unpleasant procedure, are unnecessary for these patients. Hence, the noninvasive detection of tumor proliferation is of great value (Huang et al 2015).
Ki-67 protein in the nucleus is associated with cell proliferation, which may indicate the aggressiveness of tumors and is expressed at all stages of the cell cycle except G0, with the highest expression levels in the G2/M phase(Gerdes et al 1984). Paraffin-embedded section immunohistochemistry (IHC) is used to obtain the Ki-67 marker index, and the positive rate could be used as an indicator for the prognosis of patients. High Ki-67expression is significantly associated with advanced HCC, including characteristics such as poor differentiation, large tumor size, multiple tumor nodules, metastasis, cirrhosis, and venous invasion, suggesting that Ki-67 may be an adverse prognostic factor for HCC patients (Perou et al 1999, Luo et al 2015).
Tumor proliferation leads to changes in tissue structures (Huang et al 2015). Imaging can reflect the heterogeneity of the tumor's internal structure and provide longitudinal information about disease status, such as disease evolution and treatment response (Tu et al 2019).However, the identification of these computed tomography (CT) morphological features depends on the radiologist's experience. Due to the strong subjectivity and the difference between the diagnostic doctors in reading the slices, the consistency of CT morphological feature analysis is not high enough (Tu et al 2019). Radiomics has been used to predict diagnosis, survival, distant metastasis, and genetic mutations (Choi et al 2018, Jiang et al 2018, 2019, Lin et al 2019, Tu et al 2019, Wang et al 2019, Yang et al 2019, Zhang et al 2019). Several studies have attempted to assess the relationship between texture characteristics and genetics or proteins (Aerts et al 2014, Wan et al 2016), and additional studies have analyzed the relationship between texture and histology (Khalvati et al 2015). There have been several studies about the relations between Ki-67 and images or radiomics (Huang et al 2015, Luo et al 2015, Hu et al 2017, Juan et al 2018, Zhang et al 2020). A nomogram composed of radiological features was established, and tumor size had the greatest accuracy in predicting the expression of Ki-67 in gastrointestinal stromal tumors (Zhang et al 2020). Intratumoral subregions identified breast tumor subregions associated with an early time to peak, in which dynamic contrast-enhanced magnetic resonance imaging features were used as predictors of Ki-67 features in breast cancer (Fan et al 2018). Apparent diffusion coefficient values on diffusion-weighted imaging may be used to measure cell proliferation in HCC (Huang et al 2015, Meng et al 2016), and the histogram parameters of the apparent diffusion coefficient and arterial phase were potentially helpful for predicting Ki-67 (Hu et al 2017). Arterial heterogeneous enhancement was associated with high Ki-67 expression (Li et al 2019); hence, it is possible to use noninvasive imaging to reflect the expression level of Ki-67.
In our study, we hypothesized that radiomics characteristics may be related to tumor proliferation and that Ki-67 is a biomarker of tumor proliferation. Therefore, the purpose of this study was to analyze the relationship between radiomics characteristics and Ki-67 molecular markers.
2. Materials and methods
2.1. Clinical data
This retrospective study was approved by the institutional review board of the hospital and was conducted based on the principles of the Helsinki Declaration.The institutional review board waived the requirement for obtaining written informed consent from the participants.
HCC was diagnosed according to the World Health Organization (WHO) criteria of microscopic morphological assessments after surgical resection. A total of 98 patients with primary HCC who had undergone initial CT imaging between October 2009 and December 2019 were selected from the radiology report database. In this study, the inclusion criteria were as follows: (a) confirmation by pathology; (b)complete pathological data, including Ki-67; and (c) complete CT images. The exclusion criteria were as follows: (1) recurrent or metastatic tumors; (2) liver transplantation; (3) incomplete CT images or poor quality; and (4) lack of Ki-67 data. A review of clinical data from medical records found that no patients in this cohort received neoadjuvant therapy;74 patients with HCC were enrolled in this study, as shown in table 1.
Table 1. Statistically significant clinical characteristics of patients with hepatocellular carcinoma (P < 0.050).
| Characteristics | Low Ki-67 (n = 20) | High Ki-67 (n = 54) | P | |
|---|---|---|---|---|
| Sex | F | 5 | 9 | 0.416 |
| M | 15 | 45 | ||
| Age (y) | Average | 59.15 | 58.07 | 0.865 |
| Min | 38 | 26 | ||
| Max | 81 | 82 | ||
| Child-pugh* | A | 9 | 18 | 0.617 |
| B | 8 | 28 | ||
| C | 3 | 8 | ||
| Size (cm) | Average | 6.38 | 6.1 | 0.855 |
| Min | 1.7 | 1.2 | ||
| Max | 16.3 | 15.1 | ||
| Pathogenesis | Alcohol | 1 | 8 | 0.758 |
| HBV | 18 | 44 | ||
| HCV | 1 | 1 | ||
| PBC | 0 | 1 | ||
| AFP(ng ml−1) | 798.20** | 58.84** | 0.451 | |
| STB (umol l−1) | 63.09 ± 20.92 | 40.07 ± 24.14 | <0.001 | |
| CT# (Slices) | 16 | 4 | 2 | |
| 64 | 5 | 15 | 0.073 | |
| 320 | 11 | 37 |
Statistically significant (P < 0.050)*Liver functionPBC = Primary biliary cirrhosisSTB = Serum total bilirubin#CT scanner**median
2.2. CT protocols
CT examination was performed using a 16-(Aquilion 16, Toshiba Medical Systems Corporation; Tochigi ken, Japan), 64-(Brilliance 64, Philips, Netherlands) or 320-slice helical CT scanner (Aquilion ONETSX-301A, Toshiba Medical Systems Corporation; Tochigi ken, Japan). The technical parameters were as follows: tube voltage: 120 kVp; tube current: 200 mAs; beam collimation: 64 × 0.6 mm; pitch: 0.9; and rotation time: 0.5 s. The thickness of the reconstructed section was 5 or 7 mm for the picture archiving and communication system system, and 1 mm-thick images were saved for lesion segmentation. A non-ionic iodized contrast agent (iodipamide, 370 mg I ml−1 Bracco) was injected into a double-headed syringe at a rate of 3.5–4.0 ml s−1 and then rinsed with 20 ml of normal saline at a dose of 2.0 ml kg−1 of body weight. Images of the early arterial phase (EAP) (20–22 s), late arterial phase (LAP) (34–37 s), portal venous phase (PVP) (60 s) and equilibrium phase (EP) (300 s) were obtained.
2.3. Lesion segmentation and radiomics analysis
MaZda 4.6 software was used to calculate the texture features (Szczypinski et al 2009) (URL: www.eletel.p.lodz.pl/programy/mazda/). This software was developed within the European Cooperation In The Field Of Scientific And Technical Research project B11andhas been used in several research areas for all texture calculations (Jiang et al 2019). Lesions were evaluated on 1 mm thick images using the irregular shape of the region of interest (ROI). The size range of tumor ROIs was 11 mm2–68 mm2.Consistent quantitative measurements were performed by two abdominal radiologists with 12 and 8 years of experience. The primary radiologist selected the largest section of the lesion, manually drawing the ROI diagram (figure 1), and then the experienced senior radiologist confirmed the ROI setting, taking the lead when the two radiologists disagreed. We minimized the effects of contrast and brightness changes; otherwise, the true texture of the image would be blurred. To reduce the impact of contrast and brightness changes, we normalized the image gray intensity to m−3d and m + 3d (m, mean gray value; d, mean standard deviation) (He et al 2019).
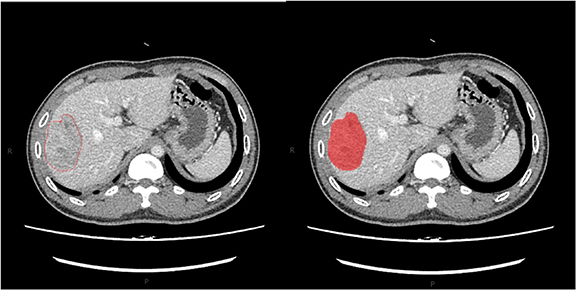
Figure 1. The region of interest (ROI) of the tumor was drawn in red on MaZda (a free software for texture analysis).
Download figure:
Standard image High-resolution imageTexture is a repeated pattern of the local variation in image intensity that is characterized by the spatial distribution of the intensity levels in adjacent regions. Texture features are derived from the gray-level histogram and the gray-level co-occurrence matrix (GLCM) (Chang et al, 2017, Ryu et al
2014). The sequential forward selection algorithm was used as the selection method for logistic regression feature parameters. The purpose of feature selection is to find the optimal feature subset, eliminate irrelevant or redundant features, reduce the number of features, and improve the model accuracy. Suppose that given a feature set F
=
 (
(
 1
1
 ,
,
 1,......
 ,
,
 n), the target function of the model is J (·), the subset S is screened from the feature set F by feature selection, and there is J(S) > J(T) for any subset T. In the sequence forward selection algorithm, the feature subset X starts from the empty set, and the first feature that makes the target function J optimal is first found from all features through five-fold cross-validation. Thereafter, only one feature
  from the unselected feature set is selected each time to add to the feature subset X to make J optimal. This process is repeated until J reaches the optimal result. Thirteen texture features with the highest discriminating ability were identified as follows: average brightness, variance, skewness, kurtosis, percentile (50% was selected), angular second moment (ASM), correlation, contrast, sum of squares (SumOfSqs),sum of variance, inverse difference moment (IDM), sum average, and entropy. After CT image preprocessing and intensity rescaling (0–255), 13 texture features were calculated from the PVP of all the patients.
2.4. Immunohistochemical staining and analysis
Histological evaluation was performed in all HCC patients after partial hepatectomy. After surgery, the specimens were fixed in a 10% formaldehyde solution and embedded in paraffin. Four-micron-thick serial sections were cut from the paraffin-embedded blocks and immunohistochemically analyzed for the expression of Ki-67 according to the manufacturer's instructions. Ki-67 IHC was performed by using a commercially available mouse monoclonal antibody against human Ki-67. The results of Ki-67 IHC were classified as continuous data from 0% to 100%, and the scores were as follows: 0, negative for tumor cells; 1, single positive tumor cells (< 10%); 2, moderate percentage of positive tumor cells (10%–50%); 3, high percentage of positive tumor cells (50%–90%); and 4, very high percentage of positive tumor cells (> 90%). The specimens were retrospectively evaluated by a pathologist who was blinded to the clinicopathological features and CT data. Immunoreactive cells from 1000 malignant cells were used to determine the percentile of Ki-67-positive tumor cells and to score the region with the largest number of positive nuclei (hot spots) in the tumor.
2.5. Statistical analysis
Statistical analysis was performed using SPSS 26.0 for Windows (SPSS, Armonk, NY, USA) and MedCalc software (www.medcalc.org/). The differences between CT scan models were examined by independent sample Kruskal–Wallis tests. The Wilcoxon rank-sum test was used to compare the differences between the low Ki-67 and high Ki-67 groups. A simple logistic regression model was used to evaluate the associations between texture features and high Ki-67 based on the P value and odds ratio (OR) with a 95% level of confidence and to calculate the combined predictor based on B values. Spearman correlation analysis was used to evaluate the correlations between Ki-67 and radiomics features. Receiver operating characteristic (ROC) analysis was performed on important parameters to assess the ability of radiomics characteristics to distinguish the high Ki-67 group from the low Ki-67 group using MedCalc software. In the corresponding region, the specificity, sensitivity and 95% confidence interval (95% CI) were calculated for the area under the curve (AUC).
3. Results
3.1. Ki-67 and CT features
The patients were divided into two groups according to their Ki-67 scores: patients with scores of 0 and 1 were classified as the low Ki-67 group (figure 2(A)) and those with scores of 2, 3, and 4 were classified as the high Ki-67 group (figure 2(B)). As indicators such as the mean and variance do not have a normal distribution, all results were expressed as the median and P25 ∼ P75. The low Ki-67 group had a total of 20 lesions, and the high Ki-67 group had 54 lesions. The clinical characteristics of the patients are shown in table 1. An overview of the case selection process is shown in figure 3.
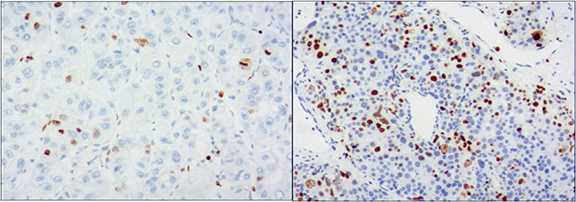
Figure 2. Immunohistochemical staining showed low expression of Ki-67 (<10%, (A)) and high expression of Ki-67(>10%, (B)) (×100).
Download figure:
Standard image High-resolution image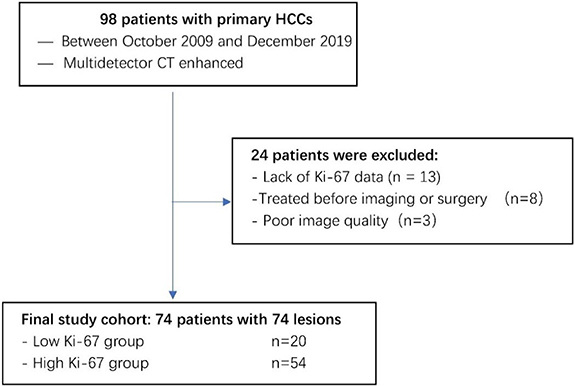
Figure 3. Flowchart illustrating subject selection.
Download figure:
Standard image High-resolution image3.2. Correlations between radiomics features and Ki-67
There were no statistically significant differences in the radiomics features between different CT scanning models(all P-values > 0.1; table 2). In contrast, correlation and IDM were significantly different between the low and high Ki-67 groups (all P-values < 0.001; figures 4(A), (B), and (C). However, there were no significant differences in ASM, SumOfSqs, sum average, sum variance or entropy between the two groups (P > 0.05; table 2). Contrast, correlation, and IDM were entered into the multivariable logistic regression analysis. Finally, contrast (OR = 0.957; 95% CI: 0.926–0.990; P = 0.01) and correlation(OR = 2.5*105; 95% CI: 7.560–8.9*109; P = 0.019) were considered independent risk factors for combined model building with logistic regression (table 3). Combined predictor = contrast-283.340*correlation. In contrast, ASM (r = − 0.285, P = 0.014), contrast (r = − 0.449, P < 0.001), correlation (r = 0.552, P < 0.001), IDM (r = 0.458, P < 0.001), and entropy (r = 0.285, P = 0.014) strongly correlated with the Ki-67 scores (table 4). Overall, higher ASM and contrast were associated with low Ki-67 scores, while correlation, IDM and entropy increased with high Ki-67 scores.
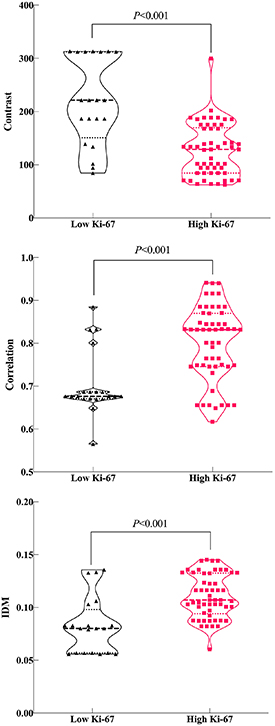
Figure 4. Violin plot of the contrast (A), correlation (B), and inverse difference moment (IDM) (C) features.
Download figure:
Standard image High-resolution imageTable 2. Parameters with significant differences in the wilcoxon rank-sum test and independent sample Kruskal–Wallis test.
| Parameters | Low Ki-67 | High Ki-67 | Z | P | P(CT)* | ||||
|---|---|---|---|---|---|---|---|---|---|
| Median | Min | Max | Median | Min | Max | ||||
| Mean | 127.633 | 99.6 | 150.106 | 125.852 | 101.91 | 221.996 | −0.451 | 0.652 | 0.346 |
| Variance | 365.555 | 225.577 | 1419.069 | 423.448 | 121.508 | 1015.069 | −0.201 | 0.84 | 0.777 |
| Skewness | −0.153 | −0.694 | 0.482 | −0.182 | −0.761 | 0.472 | −0.353 | 0.724 | 0.291 |
| Kurtosis | −0.231 | −0.536 | 1.699 | −0.255 | −0.778 | 1.8 | 0.75 | 0.453 | 0.54 |
| Perc.50% | 132.25 | 100 | 152 | 127.92 | 102 | 223 | −0.196 | 0.845 | 0.546 |
| ASM | 0.002 | 0.001 | 0.002 | 0.001 | 0 | 0.003 | −1.82 | 0.069 | 0.609 |
| Contrast | 221.439 | 84.388 | 313.16 | 128.888 | 62.57 | 299.67 | −4.245 | <0.001 | 0.772 |
| Correlation | 0.678 | 0.565 | 0.885 | 0.832 | 0.617 | 0.941 C | 3.642 | <0.001 | 0.338 |
| SumOfSqs | 352.967 | 225.391 | 491.889 | 374.485 | 101.289 | 1000.26 | −0.621 | 0.535 | 0.891 |
| SumAverg | 296.828 | 198.859 | 380.434 | 252.121 | 202.971 | 445.903 | −0.877 | 0.381 | 0.191 |
| SumVarnc | 1203.667 | 807.394 | 1615.402 | 1328.878 | 335.378 | 3833.14 | 0.146 | 0.884 | 0.891 |
| IDM | 0.081 | 0.056 | 0.136 | 0.107 | 0.06 | 0.145 | 4.067 | <0.001 | 0.477 |
| Entropy | 3.223 | 2.753 | 3.466 | 3.226 | 2.401 | 3.537 | 0.798 | 0.425 | 0.906 |
Perc.50% = percentage 50%ASM = angular second momentSumOfSqs = sum of squaresSumAverg = sum averageSumVarnc = sum varianceIDM = inverse difference momentStatistically significant (P < 0.050)* Differences between CT scan models
Table 3. Multivariable odds ratios for the associations between CT texture parameters and high Ki-67.
| 95% C.I. for OR | |||||||
|---|---|---|---|---|---|---|---|
| B | S.E | Wald | P | OR | Lower | Upper | |
| Contrast | −0.044 | 0.017 | 6.572 | 0.01 | 0.957 | 0.926 | 0.99 |
| Correlation | 12.467 | 5.329 | 5.474 | 0.019 | 259 646.7 | 7.56 | 8 917 378 309 |
| IDM | −89.966 | 48.593 | 3.428 | 0.064 | 0 | 0 | 195.421 |
| Constant | 7.582 | 6.991 | 1.176 | 0.278 | 1962.772 | ||
Table 4. Correlations of Ki-67 scores and CT texture parameters.
| Ki-67 level | Correlation coefficient | P |
|---|---|---|
| Mean | −0.094 | 0.425 |
| Variance | −0.072 | 0.54 |
| Skewness | −0.028 | 0.815 |
| Kurtosis | 0.142 | 0.228 |
| Perc.50% | −0.071 | 0.549 |
| ASM | −0.285 | 0.014 |
| Contrast | −0.449 | <0.001 |
| Correlation | 0.552 | <0.001 |
| SumOfSqs | 0.076 | 0.518 |
| SumAverg | −0.046 | 0.695 |
| SumVarnc | 0.189 | 0.107 |
| IDM | 0.458 | <0.001 |
| Entropy | 0.285 | 0.014 |
Perc.50% = percentage 50%ASM = angular second momentIDM = inverse difference momentStatistically significant (p < 0.05)
3.3. Prediction of Ki-67 status
The diagnostic efficacy of these important parameters (contrast, correlation, and combined predictor) was further evaluated by ROC analyses to identify the high Ki-67 group (table 5, figure 5). These three texture parameters were predictive of Ki-67 status (P < 0.001), with AUCs ranging from 0.777 to 0.836. The combined predictor had the highest AUC for discriminating low Ki-67 from high Ki-67, with the cut-off at −31.16, a sensitivity of 96.30%, and a specificity of 75.00%. We also compared the ROC curves in pairs and observed no statistically significant differences between them.

Figure 5. ROC curves ofthe texture features of HCC using the high Ki-67 or low Ki-67 groups.
Download figure:
Standard image High-resolution image
Table 5. Differentiation performance of texture parameters assessed by receiver operating characteristic analysis.
| Parameters | Contrast | Correlation | Combined predictor |
|---|---|---|---|
| AUC | 0.823 | 0.777 | 0.836 |
| Standard Error | 0.063 | 0.061 | 0.0688 |
| 95% Confidence | 0.716,0.902 | 0.665,0.865 | 0.732,0.912 |
| z statistic | 5.086 | 4.522 | 4.885 |
| P (Area = 0.5) | <0.001 | <0.001 | <0.001 |
| Youden index J | 0.639 | 0.652 | 0.713 |
| Sensitivity (%) | 88.890 | 85.190 | 96.30 |
| Specificity (%) | 75.000 | 80.00 | 75.00 |
| Cutoff value | 186.026 | 0.688 | −31.16 |
IDM = inverse difference momentAUC = area under the curveStatistically significant (P < 0.05)
4. Discussion
The thickness of image acquisition and reconstruction will affect the stability of the results of radiomics (Incoronato et al 2017). In this study, there were no significant differences between different CT models after a 1 mm layer thickness was adopted, and the images were standardized (P > 0.1). Previous studies have shown that there is a certain correlation between the expression of Ki-67 and image performance (Huang et al 2015, Luo et al 2015, Hu et al 2017, Juan et al 2018, Zhang et al 2020). At present, there is no unified standard for the high and low expression groups of Ki-67.In some studies, 10% was used as the cut-off value of Ki-67 expression (Meng et al 2016, Hu et al 2017, Li et al 2019, Zhang et al 2020), but in others, 14% (Fan et al 2018, Juan et al 2018) or 20% Holli-Helenius et al (2017) was used, and we used 10% as the cut-off value.
In this study, we analyzed the relationships between radiomics features and Ki-67 expression, used radiomics features to identify the expression of low Ki-67 and high Ki-67 in HCC, and characterized five grayscale histograms and eight texture features for each lesion. The result shows that correlation, contrast, and IDM values were significantly different between the low Ki-67 group and the high Ki-67 group (P < 0.001). Contrast and correlation were considered independent risk factors for combined model building with logistic regression. Spearman correlation analysis found that ASM and contrast were negatively correlated with the Ki-67 scores, while correlation, IDM, and entropy were positively correlated with the Ki-67 scores (P < 0.05). In the ROC analyses, correlation, contrast, and the combined predictor also had a high ability to identify Ki-67 expression, but no significant differences were found between them. Correlation is a measure of the linear grayscale correlation between adjacent pixels Yang et al (2012), and it reflects the relevance of grayscale in the image texture Herlidou-Même et al (2003, Yang et al 2012, Zhao et al 2014). The correlation of the low Ki-67 group was lower than that of the high Ki-67 group. Because Ki-67 is used as a marker for cellular proliferation, the high Ki-67 group tended to have a higher cell density and less necrosis than the low Ki-67 group. This finding may suggest that the density difference between the lesion and the surrounding liver tissue is small in the low Ki-67 group. Contrast is a texture feature that is related to the image sharpness and groove depth (Juan et al 2018). The contrast of the low Ki-67 group was higher than that of the high Ki-67 group. This indicates that the low Ki-67 group has deeper grooves and clearer images, which could be attributed to the relatively loose cell structure and reduced invasion of the surrounding structure found in the low Ki-67 group.
This work demonstrates that Ki-67 status can be predicted through radiomics analysis features. Although some important findings have been revealed, there are also some limitations. First, this study was a single-center retrospective analysis with a small sample size; multicenter prospective studies are needed to validate the results in a larger population in the future. Second, the use of contrast agents may affect radiological properties, and standardization may not be sufficient to overcome this effect. Third, the CT models in this study were different, which may affect the results, but we standardized the image processing to minimize the impact. In the future, we will design prospective studies and adopt unified CT models and scanning parameters to minimize the error. In addition, other predictive biomarkers can be added to improve the accuracy of the model.
In summary, our study suggests that the radiomics characteristics of CT have potential as biomarkers for predicting Ki-67 status in patients with HCC. These findings suggest that the radiomics features of CT might be used as a noninvasive measure of cellular proliferation in HCC. We hope that in the future, these features will be an ideal noninvasive tool to obtain information about tumor progression and the response to anticancer therapies.
Funding
This work was supported by the Science Foundation of Guangzhou First People's Hospital (M2019013), Guangzhou Science and Technology Project of Health (20201A011013) and Guangzhou Planned Project of Science and Technology(201904010422).
Competing interests
The authors declare that they have no competing interests.