
Abstract
In the framework of RBE modelling for hadron therapy, the BIANCA biophysical model was extended to O-ions and was used to construct a radiobiological database describing the survival of V79 cells as a function of ion type (1 ⩽ Z ⩽ 8) and energy. This database allowed performing RBE predictions in very good agreement with experimental data. A method was then developed to construct analogous databases for different cell lines, starting from the V79 database as a reference.
Following interface to the FLUKA Monte Carlo radiation transport code, BIANCA was then applied for the first time to predict cell survival in a typical patient treatment scenario, consisting of two opposing fields of range-equivalent protons or C-ions. The model predictions were found to be in good agreement with CHO cell survival data obtained at the Heidelberg ion-beam therapy (HIT) centre, as well as predictions performed by the local effect model (version LEM IV).
This work shows that BIANCA can be used to predict cell survival and RBE not only for V79 and AG01522 cells, as shown previously, but also, in principle, for any cell line of interest. Furthermore, following interface to a transport code like FLUKA, BIANCA can provide predictions of 3D biological dose distributions for hadron therapy treatments, thus laying the foundations for future applications in clinics.
Export citation and abstract BibTeX RIS

Original content from this work may be used under the terms of the Creative Commons Attribution 3.0 licence. Any further distribution of this work must maintain attribution to the author(s) and the title of the work, journal citation and DOI.
1. Introduction
By the end of 2017, almost 200 000 cancer patients have been treated with particle therapy; about 170 500 of them have been irradiated with protons, whereas about 25 700 have been irradiated with C-ions (www.ptcog.ch). More than 90 hadron therapy facilities are currently in operation around the world; while most of them make use of protons, 13 use carbon ions.
With respect to conventional radiotherapy, charged particles offer the advantage of dose localization in the spread-out Bragg peak (SOBP). Furthermore, heavy ions like carbon have a higher biological effectiveness, which makes them particularly suitable for treating radio-resistant tumours. This higher effectiveness is mainly related to a higher level of DNA damage clustering, which makes the damage more difficult to be repaired by the cell (e.g. Karger and Peschke (2017) and Schuemann et al (2019)). More specifically, a survey on the spectrum of possible DSB types (Schipler and Iliakis 2013) concluded that the various repair pathways can are likely to fail in case of DSB clusters, which undermine local chromatin stability leading to inaccurate rejoining, possibly via non-homologous end-joining (NHEJ). DSB complexity is therefore considered as a key determinant of the risk for repair errors, which lead to adverse biological effects like e.g. chromosome aberrations and cell death.
In radiobiology, the biological effectiveness of a given ion is generally expressed in terms of RBE (relative biological effectiveness), which is defined as the ratio between the photon and the ion dose to obtain the same biological effect; in many cases, in vitro cell survival is the considered effect.
However, RBE is a complex quantity that depends on both physical and biological parameters. Since these variations are much more pronounced for C-ions than for protons, a constant RBE value of 1.1 is currently adopted in proton therapy (e.g. Paganetti et al (2002)), whereas more detailed RBE models are required for carbon and possibly other heavy ions of interest like He- and O-ions (Tommasino et al 2015, Testa et al 2018). It is well known that the RBE increases with the radiation linear energy transfer (LET) up to a certain maximum value, which implies that the RBE in the SOBP is higher than in the entrance channel. Furthermore, the RBE also depends on dose: since the 'shoulder' shown by photon survival curves is much more pronounced with respect to ions, the RBE tends to increase with increasing cell survival, i.e. with decreasing dose. Concerning the dependence of RBE on biological factors, the most important parameter is the intrinsic radiosensitivity of the cell/tissue under consideration: in general, more radioresistant cells, which are characterized by a lower α/β ratio, tend to show higher RBE values in comparison to more radiosensitive cells, which are featured by a higher α/β ratio.
Due to the aforementioned dependencies, the RBE of carbon ions cannot be described by a single factor, and requires the development of appropriate models (Carante and Ballarini 2017). In the European centres, including HIT (Heidelberg Ion-beam Therapy centre) in Germany and CNAO (Centro Nazionale di Adroterapia Oncologica) in Italy, the local effect model (LEM) is applied in clinics for the planning of cancer treatment by ion beams. Detailed descriptions of the different model versions can be found in the literature (e.g. Scholz et al (1997), Elsässer and Scholz (2007), Elsässer et al (2008) and Friedrich et al (2012)). Herein it is sufficient to report that LEM I, which is the version used in clinics, assumes that the damage in a small sub-volume of the cell nucleus is determined by the energy deposition in that sub-volume, independently of the radiation quality. As a consequence, cell death induced by ion irradiation can be predicted based on photon cell survival, which is the main input information for this model together with the radial dose distribution and the cell nucleus size. Since LEM was first applied to skull-base tumours, late reactions of the central nervous system were considered as the most important endpoint, and the α/β ratio was set to 2 Gy. With few exceptions, up to now this 2 Gy value has been used also for other tumour sites, as well as for the healthy tissues. On the other hand, a phenomenological model was first developed and used at NIRS in Japan (Kanai et al 1997). The basic idea of this 'mixed beam' model consists of determining the LET-dependence of the α and β parameters in mono-energetic ion beams in vitro. These values are then used to calculate the corresponding parameters αmix and βmix for a LET spectrum at a given depth within a SOBP, based on the Theory of Dual Radiation Action developed by Zaider and Rossi (1980). Subsequently, the microdosimetric kinetic model (MKM) has been also introduced in clinical environments (Inaniwa et al 2010, 2015). In the MKM, which follows microdosimetric principles, Hawkins (1994, 2003) assumed that the cell nucleus is partitioned into small 'domains', and that the number of lethal events in a domain depends on the specific energy in a linear-quadratic fashion.
In this work, the most recent version of a biophysical model developed in Pavia, called BIANCA (Carante et al 2018), was extended to O-ions and was then systematically tested against experimental data on the LET-dependence of RBE for V79 cells irradiated by different ion types, with Z values in the range 1–8. This allowed us to construct a radiobiological database describing the survival of V79 cells, considered as a reference cell line. Starting from this reference database, a method was then developed to perform full predictions of RBE for, in principle, any cell line of interest. Afterwards, BIANCA was interfaced to the FLUKA Monte Carlo radiation transport code (Ferrari et al 2005, Bohlen et al 2014, Battistoni et al 2016, Kozlowska et al 2019), which is currently used at HIT and at CNAO for treatment planning verification and re-calculation. Thanks to this approach, for the first time BIANCA was applied to predict cell survival following a two-port irradiation mimicking a clinically relevant treatment scenario, both with carbon ions and with protons. The model predictions were then compared with experimental data obtained at HIT and reported in Elsässer et al (2010).
2. Methods
The BIANCA model, which is implemented in the form of a Monte Carlo simulation code, relies on the following basic assumptions: (i) ionizing radiation can induce DNA 'critical lesions' (CLs), where by definition each CL disrupts the continuity of the chromatin fibre producing two main independent chromosome fragments; (ii) distance-dependent mis-rejoining of fragments, or fragment un-rejoining, gives rise to chromosome aberrations; (iii) certain aberration types (i.e. dicentrics, rings and large deletions, where 'large' means larger than a few Mbp, see below) lead to clonogenic cell death.
A detailed discussion on these assumptions can be found elsewhere (Ballarini and Carante 2016, Carante and Ballarini 2016), and only a few key issues will be reported herein. Although the aforementioned critical lesions are likely to be DSB clusters (Ballarini et al 2015) and they have been called 'cluster lesions' in previous publications, their features are still unclear. Therefore, no a priori definition is provided for such critical lesions, and the CL yield (expressed as the mean number of CLs per Gy and per cell, which can be converted into CLs per unit length of particle track in case of ion irradiation) is an adjustable parameter. Its value mainly depends on radiation quality (i.e. particle type and energy), but it is also modulated by the target cell features. Indeed, the value of the CL parameter, rather than relating to the number of initially induced DNA (cluster) damages, also incorporates further biological factors such as the specific cell repair proficiency. The CL yield therefore represents the number of initial damages that, following both the initial damage severity and the subsequent biological factors, break the chromosome in two large independent fragments that participate in the formation of chromosome aberrations, which in turn can lead to cell death. As will be clarified below, 'large' means visible in metaphase. In general, the CL yield tends to increase with the radiation LET (except at very high LET values) and with the cell radiosensitivity. Concerning the distance-dependence of chromosome fragment end-joining, a step function (where the threshold distance d has been fixed to the mean distance between two adjacent chromosome territories) has been shown to work well if the main purpose is to model cell death (Ballarini et al 2014, Carante et al 2015, 2018, 2019, Carante and Ballarini 2016), although some recent works have suggested that a (negative) exponential function works better if the purpose is to predict different aberration categories, in particular to distinguish between inter- and intra-arm exchanges (Tello et al 2017, 2018). When using the step function, each chromosome fragment is assumed to have a certain probability, f , to remain un-rejoined even if there are possible 'partners' within the threshold distance d. The value of f is assumed to be dependent on the cell-line but independent of radiation quality, and f is the second, and last, adjustable parameter. Finally, the assumed relationship between cell death and chromosome aberrations is derived from experimental observations indicating a one-to-one relationship between the logarithm of the surviving fraction and the mean number of dicentrics, rings and deletions visible in metaphase (e.g. Carrano (1973) and Cornforth and Bedford (1987)).
As described in previous works (e.g. Carante and Ballarini (2016), Carante and Ballarini (2017) and Carante et al (2018)), the main input data for running a simulation for chromosome aberrations and cell survival consist of the radiation type (photons, light ions or heavy ions), absorbed dose and CL yield, as well as the cell nucleus shape (which can be spherical or cylindrical) and size. For each cell irradiated with a given photon dose, an actual number of CLs is extracted from a Poisson distribution, and these CLs are uniformly distributed in the cell nucleus. On the contrary, for each cell irradiated with a given dose of an ion type of given LET, an actual number of primary ions traversing the cell nucleus is extracted from a Poisson distribution, and for each primary ion an actual number of CLs is also extracted from a Poisson distribution. In case of irradiation with protons or He-ions these CLs are then (uniformly) distributed along the primary-ion trajectory, whereas for heavy ions like C and O each CL has a 50% probability of being induced at a certain radial distance from the primary ion, to take into account the effects of the so-called 'delta rays'. Afterwards, the chromosomes and chromosome-arms hit by each CL are identified, the process of chromosome fragment end-joining (or un-rejoining) is simulated, and the scoring of different aberration categories is reproduced. Finally, the cell is counted as a surviving cell if it does not contain any 'lethal aberration' (i.e. dicentric, ring or large deletion), otherwise it is counted as a dead cell. The process is repeated until the required statistical significance is obtained, and the repetition for different dose values provides simulated dose-response curves for chromosome aberrations and cell survival. Further details can be found in the previous works quoted above.
3. Results and discussion
3.1. Extension to O-ions
Up to now, the BIANCA model (version BIANCA II) has been applied to monochromatic beams of protons, C-ions and He ions, finding good agreement with experimental survival curves for V79 and AG01522 cells (e.g. Carante et al (2018)). In this work the approach was extended to O-ions, which are also of interest for hadron therapy (Tommasino et al 2015), and simulated survival curves were compared with V79 data taken from the literature. The value of the unrejoining fraction, f , was left unchanged with respect to the 0.08 value already used for protons, He-ions and C-ions. Thus, the CL yield was the only adjustable parameter. Figure 1 shows the results obtained for five O-ion beams, having LET values of 18, 46, 238, 276 and 754 keV μm−1; the experimental data were taken from Stoll et al (1995). Since the data were derived from single experiments and thus do not have any associated uncertainty, a quantitative evaluation of the agreement is not feasible. However, the simulations are in line with the data for all considered LET values. Concerning the simulation outputs, here and in the following figures the associated errors, which were always within 5%, were not reported because they would be too small to be clearly visible.
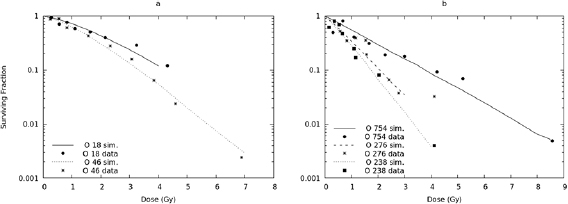
Figure 1. Survival of V79 cells exposed to O-ion beams of 18 keV μm−1, 46 keV μm−1 (panel (a)), 238 keV μm−1, 276 keV μm−1 and 754 keV μm−1 (panel (b)). The lines are simulation outcomes, the points are experimental data taken from Stoll et al (1995).
Download figure:
Standard image High-resolution imageThe mean number of CLs per unit track length, expressed as CL μm−1, was found to increase with LET, reflecting the increasing energy-deposition clustering. However, the mean number of CLs per unit dose and DNA mass, expressed as CL · Gy−1 · cell−1, showed a peak at 238 keV μm−1 and then decreased, reflecting the behaviour of the RBE (see below). This difference in the LET-dependence between CL μm−1 and CL · Gy−1 · cell−1, which has been observed also for C-ions (Carante et al 2018), can be explained by considering the following relationship:

where L is the LET in keV μm−1 and V is the cell nucleus volume in μm3. At very high LET, where we found that the yield of CL · μm−1 increases in a sub-linear fashion, the yield of CL · Gy−1 · cell−1 starts decreasing due to the presence of the L−1 term.
The yield of CLs found in this work for O-ions was very similar to that found in Carante et al (2018) for C-ions with the same LET, suggesting that these two ion types have a similar LET-dependence. More specifically, at 18 keV μm−1 the CL yield (expressed as mean number of CLs per μm) was 0.009 for O-ions and .007 for C-ions; at 46 keV μm−1 it was 0.031 for O-ions and 0.034 for C-ions; at 238 keV μm−1 it was 0.389 for O-ions and 0.343 for C-ions; at 276 keV μm−1 it was 0.384 for O-ions and 0.385 for C-ions; finally, at 754 keV μm−1 it was 0.678 for O-ions and 0.657 for C-ions. The consequences of this issue will be discussed in section 3.2.
3.2. RBE calculation and prediction for different ion types
After adjusting the CL yield for survival curves obtained at different LET values of a given ion type, one can fit the LET-dependence of the CL yield for that ion type. Then, by taking the CL yield from the fit, it is possible to perform a full prediction of cell survival at any LET value. This is important in view of RBE calculations, for which the cell survival dose-response must be known for as many LET values as possible and for each involved particle.
Therefore, based on previous simulations on V79 cells exposed to protons, He-ions and C-ions of different LET values (Carante et al 2018), survival curves were predicted at many different LET values for these three ion types. More specifically, 12 survival curves were produced for protons (LET range: 2.5–30 keV μm−1), 18 curves for He-ions (range: 5–90 keV μm−1), and 29 curves for C-ions (range: 10–500 keV μm−1).
Each of these (predicted) survival curves was then fitted by the 'usual' linear-quadratic expression S(D) = exp(−αD − βD2). The linear and quadratic coefficients derived from these fits allowed calculating RBE values for different ions at different LET values, according to the following expression (e.g. Mairani et al (2010)):

where αX and βX are the photon coefficients, αi and βi are the ion coefficients (at a given LET), and S is the considered survival level.
In figure 2, panel (a), the lines represent the RBE at 10% survival calculated for protons and He-ions. The RBE values calculated for protons were compared with experimental data taken from Belli et al (1998) (LET values: 7.7, 11.0, 20.0 and 30.5 keV μm−1) and Folkard et al (1996) (LET values: 10.1, 17.8 and 27.6 keV μm−1), whereas those for He-ions were compared with 3He data taken from Furusawa et al (2000) (20 points in the LET range 18.6–90.8 keV μm−1), as well as a 7Li point at 60 keV μm−1 taken from Pathak et al (2007). The model calculations were in good agreement with the data, showing that BIANCA can be used for RBE predictions for V79 cells exposed to protons or He-ions. In particular for protons, for which experimental errors are available, all the simulation outcomes were within 3σ with respect to the data. Concerning the discrepancy between simulations and data, only for the point at 7.7 keV μm−1 the discrepancy was 19.8%, whereas for the other points it was less than 15%. The fact that the 7Li point is higher than the He value at the same LET can be explained by considering that, in the 7Li experiment, 60Co gamma-rays were used as a reference radiation instead of x-rays. This suggests that the BIANCA predictions for He-ions may also be applied to ions with Z = 3, although further comparisons are desirable.
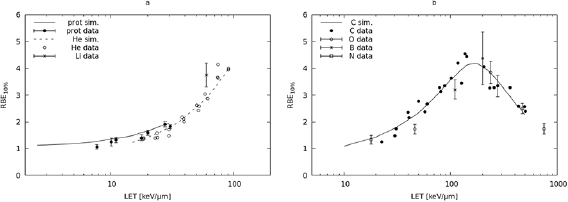
Figure 2. (a) The lines represent the RBE at 10% survival calculated for V79 cells exposed to protons (solid line) and He-ions (dashed line); the points are V79 experimental data for protons (full circles, taken from Folkard et al (1996) and Belli et al (1998)) and He-ions (empty circles, from Furusawa et al (2000)), as well as a Li-ion point at 60 keV μm−1 (taken from Pathak et al (2007)). (b) The line represents the RBE at 10% survival calculated for V79 cells exposed to C-ions; the points are V79 experimental data for C-ions (full circles, taken from Furusawa et al (2000)), as well as O-ions (empty circles, from Stoll et al (1995)), B-ions (asterisks, from Cox et al (1977)) and N-ions (empty square, Cox et al (1977)). The error bars, where available, represent one s.d.
Download figure:
Standard image High-resolution imageConcerning heavier ions, the 10% RBE predictions for carbon were compared with C-ion data taken from Furusawa et al (2000) (24 points in the LET range 22.5–502.0 keV μm−1), as well as five O-ion points taken from Stoll et al (1995) (LET range: 18–754 keV μm−1), two boron points taken from Cox et al (1977) (LET: 110 and 200 keV μm−1), and one nitrogen point also taken from Cox et al (1977) (LET: 470 keV μm−1). As shown in figure 2, panel (b), also for these ion types the model calculations were in good agreement with the data. In particular for B-, O- and N-ions, for which the errors were available, the (reduced) chi-square was 1.5. Except for 46 keV μm−1 O-ions, for which the discrepancy between simulations and data was 30%, for the other points it was ⩽15%. This shows that BIANCA can be used for RBE predictions for V79 cells exposed to C-ions, and suggests that the C-ion predictions may also be applied to ions with Z = 5, Z = 7 and Z = 8.
The comparisons performed at 10% survival were repeated at 50% survival. The results obtained are reported in figure 3 (panel (a) for light ions and panel (b) for heavy ions). Concerning light ions, the proton results were compared with data taken from Folkard et al (1996) and Belli et al (1998), whereas the He-ion results were compared with 3He data taken from Furusawa et al (2000), as well as a 7Li point taken from Pathak et al (2007). Except for an underestimation of proton effectiveness around 30 keV μm−1, which will be discussed below, the light-ion calculations were in good agreement with the data. In particular for the first five proton points the (reduced) chi-square was 1.6, and the maximum discrepancy between simulations and data was 13%. This showed that BIANCA can predict the 50% survival RBE for V79 cells exposed to protons or He-ions, and possibly ions with Z = 3.

Figure 3. (a) The lines represent the RBE at 50% survival calculated for V79 cells exposed to protons (solid line) and He-ions (dashed line); the points are V79 experimental data for protons (full circles, taken from Folkard et al (1996) and Belli et al (1998)) and He-ions (empty circles, from Furusawa et al (2000)), as well as a Li-ion point at 60 keV μm−1 (taken from Pathak et al (2007)). (b) The line represents the RBE at 50% survival calculated for V79 cells exposed to C-ions. The points are V79 experimental data for C-ions (full circles, taken from Furusawa et al (2000)), as well as O-ions (empty circles, from Stoll et al (1995)), B-ions (asterisks, from Cox et al (1977)) and N-ions (empy square, Cox et al (1977)). The error bars, where available, represent one s.d.
Download figure:
Standard image High-resolution imageAn underestimation of the effectiveness of higher LET protons was expected, since for these particles the model tends to overestimate the surviving fraction at low doses; as discussed previously (Carante et al 2018), this is possibly related to the choice of the function that describes the chromosome fragment rejoining probability. This also explains why this RBE underestimation was not found for 10% survival RBE, which involves higher doses. In any case, it should be taken into account that these LET values are very unlikely to play a relevant role in proton therapy, not even in the SOBP distal region. For instance, for the proton beam used at INFN-LNS in Catania (Italy) to treat ocular tumours, the (average) LET in the most distal SOBP region, just before the dose fall-off, is 21.7 keV μm−1 (Chaudhary et al 2014) Even lower values, below 15 keV μm−1, are reported in Giovannini et al (2016) for two examples of cranial irradiation.
Concerning heavy ions, the C-ion predictions for RBE at 50% survival were compared with C-ion data taken from Furusawa et al (2000), as well as five O-ion points taken from Stoll et al (1995), two Boron points taken from Cox et al (1977), and one N point taken from Cox et al (1977). For B-, O- and N-ions, for which the errors were available, the (reduced) chi-square was 1.8, and all simulation outcomes were within 3 σ with respect to the data. Concerning the discrepancy between simulations and data, except for 18 keV μm−1 O-ions, for which the discrepancy was 27%, for the other points it was ⩽19%. The good agreement between simulations and data showed that BIANCA can be used for predicting the 50% survival RBE for V79 cells exposed to C-ions, and suggested that the C-ion predictions may also be applied to ions with Z = 5 and Z = 8, as well as Z = 7 that is expected to have an intermediate behaviour between Z = 6 and Z = 8.
3.3. Full prediction of cell survival in a clinical irradiation scenario
According to the model features, in principle the CL yield for a given radiation quality (i.e. particle type and energy) should be adjusted separately for each considered cell line, since the CL yield depends not only on radiation quality, but also on the target cell features. However, recently we have developed a formula to fully predict the ion-survival of the cell line of interest based on the ion-survival of a reference cell line, as well as the photon response of both (Carante et al 2018). More specifically, the CL yield to predict the survival of the cell line of interest following exposure to a given radiation quality (i.e. a given ion type and energy) can be derived as follows:

Here, (CL/μm)ref is the CL yield used for the reference cell line exposed to the same radiation quality, (CL · Gy−1 · cell−1) and (CL · Gy−1 · cell−1)ref are the CL yields used to simulate photon exposure for the cell line of interest and the reference cell line, respectively, and finally Vref and V is the nucleus volume used for the reference cell line and the cell line of interest, respectively. In a previous work (Carante et al 2018), this approach has been successfully applied to AG01522 and U87 cells exposed to proton beams of different LET.
In the present work we adopted the same approach for CHO cells irradiated at HIT by two opposing fields of protons or C-ions mimicking a typical patient treatment scenario, as described in Elsässer et al (2010). In that study the cells were grown on several plastic slices that, immediately before irradiation, were inserted into an acrylic glass container (5 × 10 × 16 cm3), allowing for a 5 mm spatial resolution along the beam direction. The cells were then irradiated by two opposing beams with energy in the range 90–120 MeV/u (protons) or 175–230 MeV/u (carbon), delivering 1.5 Gy in the entrance channel (for both protons and carbon) and 5.3 Gy (protons) or 3.9 Gy (carbon) in the center of the target region. The irradiations were planned by the treatment planning software TRiP98 (Kramer and Scholz 2000) and optimized by LEM to achieve a homogeneous cell survival level in the target, simulating a 4 cm target located between 6 and 10 cm water-equivalent depth. Further details can be found in Elsässer et al (2010), which also reports the cell survival predictions performed by the LEM model.
As a first step, to fix the model parameters for photons, the photon CHO survival curve reported in Elsässer et al (2010) (α = 0.105 Gy−1 and β = 0.025 Gy−2) was reproduced by BIANCA, using a CL yield of 1.2 CL · Gy−1 · cell−1 and an un-rejoining parameter f = 0.08. The 1.2 value was inserted in equation (3) to derive the CL yields for simulating the survival of CHO cells exposed to different ion types and energies; the same nucleus volume was used for CHO and V79 cells. Afterwards, these CL yields were used as code input values to produce CHO survival curves for many different (monochromatic) beams (12 proton beams having LET in the range 2.5–30.0 keV μm−1, 18 He-ion beams with LET in the range 5–90 keV μm−1, and 29 C-ion beams with LET in the range 10–500 keV μm−1). Each of these survival curves was then fitted by a function of the form S(D) = exp(−αD − βD2), which allowed constructing a table consisting of the linear and quadratic coefficients for different ion types and LET values, analogous to the V79 table described in section 3.2. As mentioned in section 3.2, as a practical solution, for Z = 3 we used the coefficients derived for He ions, whereas for Z = 4 or Z = 5 or Z = 7, 8 we used the coefficients derived for C-ions.
Afterwards, this table was read by the FLUKA radiation transport code. The FLUKA development version 2018.1 was used. The settings corresponding to the SDUM option PRECISIOn in the DEFAULTS card were implemented. For carbon ions, the external event generator relativistic quantum molecular dynamic (rQMD-2.4) (Sorge et al 1989) was linked to assure accurate modelling of nucleus-nucleus collisions above 125 MeV/u. Moreover, coalescence and evaporation of heavy ions were activated by means of two PHYSICS cards. The nominal beam energies available at HIT (e.g. Parodi et al (2012)) for carbon ions in the range 175–230 MeV/u, and for protons in the range 90–120 MeV/u (as in the experiment reported in Elsässer et al (2010)) were used in FLUKA to model the irradiation field. The weights for each single Bragg peak contributing to the 4 cm extended SOBP were calculated by means of an in-house written routine. Two opposing fields were used like in the reference experiment. Simulations were performed on a water target, and the necessary information (particle type and energy, and absorbed dose) were calculated by FLUKA on a voxel-by-voxel basis. More specifically, whenever according to FLUKA a certain amount of energy was deposited in a target voxel by a given particle type of given energy (and thus given LET), FLUKA read the corresponding alpha and beta coefficients from the table produced by BIANCA. Afterwards, to account for the effects of mixed fields, the mean value of alpha and the mean value of beta in that voxel were calculated according to the theory of dual radiation action (Zaider and Rossi 1980) as described in Mairani et al (2010), i.e.:

Here, Di is the absorbed dose due to the ith particle according to FLUKA, αi and βi are the corresponding radiobiological coefficients provided by BIANCA, and α and β are their mean values. After calculating α and β as described above, the corresponding survival level, the RBE-weighted dose and the RBE were calculated as follows:


where αX and βX are the photon parameters provided by BIANCA.
The results obtained for carbon are reported in figure 4 (panel (a)), where the solid line represents the prediction performed by BIANCA interfaced to FLUKA, the points are the experimental data taken from Elsässer et al (2010) by using a software available online called WebPlotDigitizer (https://automeris.io/WebPlotDigitizer), and the dashed line is the prediction performed by LEM (version LEM IV) integrated into TRiP98, which was also taken from Elsässer et al (2010) by means of WebPlotDigitizer. The predictions of the two models (BIANCA and LEM) are rather similar and are both in good agreement with the data. In particular, the (reduced) chi-square for the BIANCA simulations was 2.2, and the discrepancy between BIANCA and the data was ⩽17%.

Figure 4. Surviving fraction for CHO cells in a typical two-port irradiation with carbon ions (panel (a)) and protons (panel (b)). The solid lines represent the predictions performed by BIANCA interfaced to FLUKA, the points are experimental data taken from Elsässer et al (2010), and the dashed lines, also taken from Elsässer et al (2010), represent the prediction performed by LEM integrated into TRiP98.
Download figure:
Standard image High-resolution image
This suggests that also BIANCA, following interface to a radiation transport code like FLUKA, can be used to predict cell survival along C-ion hadron therapy beams in a clinical scenario. Panel b reports the same kind of results for protons. Although BIANCA tends to predict a lower survival—and thus a higher biological effectiveness—with respect to LEM, especially in the entrance channel, both models are consistent with the data.
Overall, the good agreement with the CHO data suggests that the method described in this section can be applied, in principle, to any cell line. This would allow performing ad hoc RBE predictions specific for the cell type of interest.
4. Conclusions
Following a systematic benchmarking of the BIANCA model against in vitro cell survival data, we constructed a radiobiological database describing the survival of V79 cells as a function of ion type and energy, which allowed obtaining RBE predictions in very good agreement with experimental RBE-LET relationships. A method was then developed that, starting from the V79 database as a reference, allows constructing analogous databases for different cell lines. For the first time, following interface to the FLUKA transport code, BIANCA was then applied to predict cell survival in a typical patient treatment scenario, consisting of two opposing fields of range-equivalent protons or C-ions. The model predictions were found to be in good agreement with CHO survival data obtained at HIT, as well as predictions performed by the local effect model.
This work showed that BIANCA can be used for cell survival and RBE predictions not only for V79 and AG01522 cells but also, in principle, for any cell line of interest, which allows for ad hoc RBE calculations for a specific tissue type. Furthermore, BIANCA was able to predict cell survival for two dose distributions (one for protons and one for C-ions) mimicking a clinically relevant treatment scenario, which represents a starting basis for future applications in clinics.
Concerning possible future developments, a work is already in progress to benchmark the model against in vivo data for chordoma, which are the data on which the clinical version of LEM is based. Another on-going project is the construction of a radiobiological database specific for normal tissues based on dicentric aberrations in blood lymphocytes, which are widely considered as indicators of normal tissue damage (Durante et al 2000, Ballarini and Ottolenghi 2005).
Acknowledgments
This work was supported by the Italian National Institute of Nuclear Physics (project 'MC-INFN'). GA wishes to thank the European Union's Horizon 2020 research and innovation programme under the Marie Sklodowska-Curie grant agreement No 675265 OMA—optimisation of medical accelerators—for funding her research project.