
Abstract
Approximately 50% of all colorectal cancer (CRC) patients will develop metastasis to the liver. 90Y selective internal radiation therapy (SIRT) is an established treatment for metastatic CRC. There is still a fundamental lack of understanding regarding the radiobiology underlying the dose response. This study was designed to determine the radiosensitivity of two CRC cell lines (DLD-1 and HT-29) to 90Y β− radiation exposure, and thus the relative effectiveness of 90Y SIRT in relation to external beam radiotherapy (EBRT).
A 90Y-source dish was sandwiched between culture dishes to irradiate DLD-1 or HT-29 cells for a period of 6 d. Cell survival was determined by clonogenic assay. Dose absorbed per 90Y disintegration was calculated using the PENELOPE Monte Carlo code. PENELOPE simulations were benchmarked against relative dose measurements using EBT3 GAFchromic™ film. Statistical regression based on the linear-quadratic model was used to determine the radiosensitivity parameters  and
and  using R. These results were compared to radiosensitivity parameters determined for 6 MV clinical x-rays and 137Cs γ-ray exposure. Equivalent dose of EBRT in 2 Gy (
 ) and 10 Gy (
 ) fractions were derived for 90Y dose.
HT-29 cells were more radioresistant than DLD-1 for all treatment modalities. Radiosensitivity parameters determined for 6 MV x-rays and 137Cs γ-ray were equivalent for both cell lines. The  ratio for 90Y β−-particle exposure was over an order of magnitude higher than the other two modalities due to protraction of dose delivery. Consequently, an 90Y SIRT absorbed dose of 60 Gy equates to an
  of 28.7 and 54.5 Gy and an
  of 17.6 and 19.3 Gy for DLD-1 and HT-29 cell lines, respectively.
We derived radiosensitivity parameters for two CRC cell lines exposed to 90Y β−-particles, 6 MV x-rays, and 137Cs γ-ray irradiation. These radiobiological parameters are critical to understanding the dose response of CRC lesions and ultimately informs the efficacy of 90Y SIRT relative to other radiation therapy modalities.
Export citation and abstract BibTeX RIS

Original content from this work may be used under the terms of the Creative Commons Attribution 3.0 licence. Any further distribution of this work must maintain attribution to the author(s) and the title of the work, journal citation and DOI.
Introduction
The success of external beam radiotherapy (EBRT) can partly be attributed to a fundamental understanding of the underlying radiobiology and how this explains the dose response. The evolution of targeted radionuclide therapy (TRT), however, is marked by a recognised deficiency in dose quantification and sound radiobiological understanding. In addition, dosimetry and treatment planning are mostly standardised for EBRT, which is not the situation for TRT (Lassmann et al 2011, Gill et al 2017). In the case of 90Y-based selective internal radiation therapy (90Y SIRT), a liver-directed treatment for palliative control of inoperable or chemorefractory tumours (van den Hoven et al 2016), doses are usually prescribed using tables or the Body Surface Area method to determine the amount of activity (MBq) to administer (Vauthey et al 2002). Absorbed doses reported in literature can vary from 50 up to 200 Gy (Strigari et al 2010, Cremonesi et al 2014, van den Hoven et al 2016). Consequently, there is a general acknowledgement that patient-specific dosimetry needs to be performed to optimise treatment, especially since a dose effect has been established for 90Y SIRT (Strigari et al 2010, Cremonesi et al 2014, van den Hoven et al 2016). Given the recent multicentre phase III trial showing that 90Y SIRT provides better tumour control within the liver when used in conjunction with chemotherapy than chemotherapy alone (Wasan et al 2017), this treatment option could be extended if dosimetric and radiobiological considerations are taken into account in treatment planning.
While there has been a concerted effort to integrate dosimetry into the clinic (Giammarile et al 2011), this has not been extended to the incorporation of radiobiological parameters specific for 90Y SIRT. Radiobiological modelling based on the linear-quadratic model (LQM) requires detailed knowledge of 90Y-specific radiobiological parameters ( and
and  ) (Cremonesi et al 2008). Yet, radiobiological parameters used for 90Y SIRT dosimetry planning are usually taken from EBRT studies (Chiesa et al 2015). These extrapolated parameters might not be representative of 90Y SIRT as they do not account for the intrinsic cellular response to 90Y β−-particles. Furthermore, the protraction of dose delivery for 90Y SIRT adds another level of complexity. This effect is encapsulated by the Lea–Catcheside model of sublethal-damage repair (Dale 2018) and has previously been used to describe the in vitro cellular response to protracted photon exposure (Solanki et al 2017). However, studies using 90Y are needed to answer fundamental questions regarding differences in the radiobiological response to 90Y β−-particles and photons of clinically relevant energy.
Recently, Gholami and colleagues (Gholami et al 2018) compared cell-kill responses between 90Y and EBRT. Using a colorimetric cell viability assay (MTS), they concluded that 90Y is less potent than EBRT, as ≈56 Gy 90Y dose cumulated after 8 d was found to be radiobiologically equivalent to a single fraction of ≈8 Gy EBRT. It is plausible to consider the cumulated dose after 90Y exposure as a large number of infinitesimally small doses delivered per fraction. It is thus possible to relate the biological effect of 90Y and EBRT by using the radiobiological measure, biological effective dose (BED), which allows inter-comparison between different fractionation schedules or treatment modalities to achieve a given biological effect (Dale et al 1996). This concept is only valid though for tissue characterised by a specific  ratio. Thus, to enable the incorporation of radiobiological parameters such as BED into clinical dosimetry planning of 90Y SIRT, accurate measurements of the
  and
and  parameters are required to establish equivalence to that of EBRT.
In the present study, we determined the radiobiological parameters,  and
and  for colorectal cancer (CRC) cell lines by means of the clonogenic assay. CRC cells were exposed to three radiation sources, namely 90Y β−-particles (933 keV mean energy and LET range of 0.07–2 keV μm−1), 6 MV x-rays (LET = 0.2 keV μm−1) delivered via a clinical linear accelerator (LINAC), and 137Cs (662 keV γ-ray, LET = 0.8 keV μm−1). Additionally, we investigated the relationship between EBRT and 90Y dose through the concept of BED and establishing equivalent EBRT dose of 2 Gy (
 ) and 10 Gy (
 ) fractions.
Materials and methods
Cell culture
Two CRC cell lines, namely DLD-1 and HT-29, were obtained from American Type Culture Collection. The cells were cultured in Dulbecco's modified Eagle's medium (Gibco, Thermo Fisher Scientific, UK), supplemented with 10% foetal calf serum (Merck, UK), and penicillin/ streptomycin/glutamine solution at 100 units ml−1, 100 μg ml−1 and 0.29 mg ml−1, respectively (Gibco, Thermo Fisher Scientific, UK) and were incubated at 37 °C in 5% CO2.
90Y formulations
In this study, 90Y either as 90Y-DOTATATE or 90YCl3 was placed in a separate dish to irradiate cells via the long range β− emissions of 90Y. Since there was no cellular internalisation of 90Y, the use of two 90Y formulations was not expected to yield different radiobiological effects. 90Y-DOTATATE was provided by the radiopharmacy at the Churchill Hospital, Oxford, at 0.05 MBq μl−1. 90YCl3 was purchased from Perkin Elmer (Massachusetts, USA) at 9–10 MBq μl−1.
Clonogenic assays
Colony formation and counting
For all experiments, irradiated cells formed colonies in 6-well plates for 7 d (DLD-1) and 9 d (HT-29). Colonies (⩾50 cells) were then fixed and stained with methylene blue in 50% ethanol and counted using an automated colony counter (GelCount™, Oxford Optronix Ltd, UK). All experiments were repeated in triplicate.
90Y β−-particles
Stacks of dishes were constructed as shown in figure 1(A). This geometry, adapted from Howell et al (1991), allowed the simultaneous irradiation of multiple dishes resulting in different cumulative doses at different dishes within a stack. In addition, it circumvented the problem of cellular internalisation of 90Y. Cells were plated at 4000–20 000 cells/dish in 1.5 ml medium on the polymer coverslip of ibidi® low 35 mm μ-dishes so that the cells remained within the central area (diameter of 21 mm) while 90Y sources were mixed with phosphate buffered saline (PBS) in 1.5 ml of solution in a Greiner® 35 mm dish. The use of different dish types for cells and for 90Y was to minimise the difference between doses at the centre and the edge of dish thus assuring a near-uniform dose distribution over the irradiated cells (see supplemental figure 2 (stacks.iop.org/PMB/64/135018/mmedia)). Cell stacks were placed inside a custom-made container (figure 1(B)) and exposed for 6 d inside an incubator with 0, 10, 15, and 20 MBq of 90Y diluted from stock. After the exposure period, the cells were replated at 3000–5000 cells/well in 1.5 ml of medium in three wells on 6-well plates. The cumulated doses delivered ranged from 0–32 Gy. Radiation dose was delivered at variable average dose rates ranging from 0–0.0037 Gy min−1.
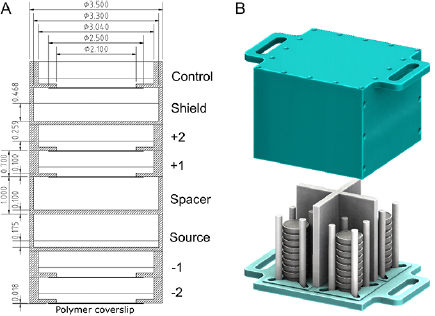
Figure 1. (A) A schematic of a stack of culture dishes used for irradiating plated cells (cell treatment dishes labelled as ' +1', ' +2', ' −1', ' −2' and 'control') with 90Y ('source' dish). The first dish above the source dish was an empty dish ('spacer') used to achieve the desired dose in +1 and +2 treatment dishes. PBS (1.5 ml) or culture medium (1.5 ml) was added to the source dish and cell-containing dishes, respectively. The 'shield' dish was filled with 4 ml of PBS to shield the control dish. A Greiner® 35 mm dish was used for the source, spacer, and shield dishes while an ibidi® low 35 mm μ-dish was used for cell dishes. All dimensions shown are in cm. (B) Up to four stacks are positioned inside a custom-made experimental container, before being placed inside an incubator. See supplemental figure 1 for a detailed description of the container.
Download figure:
Standard image High-resolution image137Cs γ-ray
Cells were plated at 1000–40 000 cells/well in three wells on 6-well plates and irradiated 4 h after plating with a caesium irradiator (IBL637, CIS Bio international, France) at doses ranging from 0–10 Gy. Radiation dose was delivered at 0.77 Gy min−1.
LINAC 6 MV x-rays
The cells were plated at 1000–10 000 cells/well in three wells on 6-well plates 4 h prior to the treatment delivery. A Varian Clinac 2100 series was used to deliver 0–10 Gy at 6.6 Gy min−1 using a 15 × 15 cm2 field size. The gantry was positioned at 180° such that the beam first passed bottom-up through the couch, followed by 1.5 cm of solid water so that the dose maximum was at the cell level, and finally 2 cm of solid water to capture the backscatter dose.
Monte Carlo (MC) modelling
The dose absorbed per 90Y disintegration,  (cGy MBq−1 d−1), in a cell monolayer 15 μm in height (water density, ρ = 1.0 g cm−3 was assumed) contiguous with the bottom of each ibidi® dish placed at different positions above or below the source dish (figure 1(A)) was calculated by the MC method using the PENELOPE code (Salvat et al 2011). The average cell height was measured using confocal microscopy (supplemental table 1). Polystyrene (ρ = 1.06 g cm−3) was assumed for both Greiner® and ibidi® dishes and air of 95% humidity at 37 °C and 5% CO2 (ρ = 1.276 × 10⁻³ g cm−3) was used for air inside each dish. PBS and 90Y solution were assumed as water. The β− spectrum of 90Y was taken from medical internal radiation dose (MIRD) tabulation (Eckerman and Endo 2008). A total of 108 primaries were simulated in each run. All primaries and secondaries were followed until their energies reached <1 keV and their remaining energies were assumed to be deposited locally.
Up to a third of the initial medium volume in each dish was lost by the end of the exposure period due to evaporation. For the source dish and all treatment dishes, two S-values were calculated based on the measured medium volume at the beginning ( ) and conclusion (
 ) of the exposure period. S-values in between
  and
and  were interpolated linearly. As a result, the MIRD formulation (Goddu et al 1997) was modified to account for the evaporation effect in each dish and the final equation used for dose calculation is (see supplemental material for derivation, equations (S1)–(S3)):

where  is the dose absorbed for cells exposed to 90Y for duration
  with an initial activity of
  and
and  is the physical decay constant of 90Y (
 and physical half-life
  h).
h).
90Y dose calibration
A series of calibration experiments was performed to quantify the 90Y distribution. Radiochromic films (8.2 × 9.7 mm; GAFchromic™ EBT3 film: Ashland Inc., Covington, KY) were exposed to 6 MV x-rays to doses ranging from 0.5–10 Gy in accordance with the AAPM TG-61 protocol (Ma et al 2001). For 90Y exposure, the EBT3 films were placed centrally in the treatment dishes (i.e. numbered dishes in figure 1(A)), and exposed for 14–19 h. Exposures were done with the films in situ in dry conditions, due to the solubility of the films, and not submerged in medium to replicate the conditions of cell exposure. Experiments were performed in duplicate for both 90Y-DOTATATE and 90YCl3. EBT3 films exposed to 6 MV x-rays and 90Y were scanned 24 h after irradiation, using an Epson Expression 10000 XL colour scanner in transmission mode. A calibration curve relating the dose reading to x-ray dose was derived from the 6 MV LINAC data and this was used to inform the dose achieved from the 90Y exposure (Technical-Report 2010). A MC simulation (figure 2(B)) emulating the geometry previously described (figure 1(A)) was used to calculate the dose to the EBT3 film. Absolute dose measurements were determined by benchmarking the EBT3 film determined doses across all treatment dishes against the PENELOPE simulation (figure 2(A)). For the MC simulation, the material composition and density of the EBT3 film was based on previously reported values (Fiorini et al 2014). The absolute doses were background-subtracted based on the measured dose for the control dish.

Figure 2. (A) Comparison of the measured dose distribution in 'dry' conditions determined using EBT3 film with MC simulations. Error bars represent the standard deviations calculated from the two experiments for each type of radiopharmaceutical. Measured dose distributions for 90YCl3 (in red) and 90Y-DOTATATE (in blue) closely agreed with MC simulated dose distributions when non-uniform 90Y source distributions were assumed. Two simulated dose distributions are shown. The first assumes exposure to 5.5 MBq of 90Y for 18.6 h exposure with a concentration gradient in the bottom 75% of the source solution (in cyan, labelled as '< 75% MC'). The second assumes exposure to 2.5 MBq of 90Y for 13.8 h with a concentration gradient in the bottom 25% of the source solution (in purple, labelled as '< 25% MC'). (B) Schematic diagram of the stack geometry used for calibration. In the expanded circular view, two coloured horizontal lines represent the aforementioned 90Y concentration gradients used in the simulations.
Download figure:
Standard image High-resolution imageRadiobiological modelling
We can relate different fractionation schemes in terms of the LQM by using the BED concept (Dale 1996). For a fractionated EBRT treatment of  Gy per fraction (not accounting for repopulation), BED is given by:

where  is the number of fractions and
  is an inverse measure of tissue sensitivity to changes in fractionation or dose rate. However, for the protracted dose delivery of 90Y SIRT, sublethal damage repair can take place during the irradiation period, making the treatment less effective. Furthermore, radiation of different linear energy transfer (LET) may yield different relative biological effectiveness (RBE). A modified BED equation that accounts for LET and dose-rate effects can be used for 90Y radiation (Dale and Jones 1999):

where  is the cumulative dose of 90Y radiation,
  is the maximum (or intrinsic) RBE at zero dose, and
  is the Lea–Catcheside dose-protraction factor.
  can be estimated for a fully-decayed radiation source as:

where  and
and  are the sublethal damage repair half-time and radionuclide decay half-life, respectively. For a finite exposure,
  can be determined from supplemental equation (S4). This modified BED formalism assumes that the intrinsic quadratic component (
 ) remains unchanged between modalities and the dose-rate effect is encapsulated by the
  factor resulting in a lower magnitude of the second term of equation (3). To compare relative efficacy of different fractionation schedules and different radiation modalities, it is useful to invoke the concept of equivalent dose in fractionated EBRT (EQD) (Fowler 2009). EQD for 90Y physical dose,
  , absorbed during a SIRT treatment is (see supplemental equation (S5) for derivation):
Statistics
The  values were estimated by fitting a linear mixed-effects model by restricted maximum likelihood. Parameters
  and
and  were estimated from the surviving fraction (SF),
 . A random intercept was included for sets of replicates to consider the dependence between replicates. The model was fitted to data for each cell line separately. Approximate standard errors of
  were calculated as
  . Wald tests were used to assess whether the estimated
  and
and  were significantly different from zero. The R software package (version 3.3.3, R Core Team (2017)) and package nlme (Pinheiro et al 2017) were used for statistical analysis.
Results
Dosimetry
PENELOPE simulations were performed for four hypothetical 90Y concentration gradients where 90Y was assumed to be uniformly distributed in the bottom 25%, 50%, 75%, and 100% of the source solution. EBT3 film measured and MC simulated relative doses were compared (supplemental figure 3). Results show that the dishes were asymmetrically affected by the dose gradient, based on whether the dishes were above or below the source. Furthermore, the −1 and −2 dishes were much more sensitive to the dose gradient, whereas relative doses determined from MC simulation and EBT3 film measurements were consistent for the +1 and +2 dishes (i.e. all dose points are superimposed on the graph). The comparison suggests that the 90Y activity was concentrated at the bottom 75% and 25% of the source solution for 90Y-DOTATATE and 90YCl3, respectively. Figure 2 shows that there was good agreement (<10% difference) between the measured absolute dose from calibration experiments compared with MC simulated results when these non-uniform 90Y source distributions were assumed. The non-uniformity of the 90Y source may be attributed to the chemical interactions between the free 90Y3+ ions and the PBS used to dilute the 90Y activity. This is supported by the fact that free 90Y in 90YCl3 exhibited more extreme non-uniformity in distribution than chelated 90Y in 90Y-DOTATATE and that precipitation was observed visible when cold YCl3 and PBS were mixed at high concentration. These experimentally determined source distributions were included in the subsequent dose calculations for clonogenic experiments. Table 1 compares the cell monolayer  -values calculated for 90YCl3 and 90Y-DOTATATE assuming a gradient distribution of 90Y in the bottom 25% and 75% of the source dishes, respectively.
Table 1. Comparison of MC calculated  -values for the 15 μm-thick cell monolayer in each treatment dish exposed to either 90YCl3 or 90Y-DOTATATE.
| Dish position |  -value (cGy MBq−1 d−1) -value (cGy MBq−1 d−1) |
|
|---|---|---|
| 90YCl3 | 90Y-DOTATATE | |
| +2 | 6.26 | 8.40 |
| +1 | 37.9 | 47.3 |
| −1 | 31.4 | 24.3 |
| −2 | 3.01 | 2.06 |
Clonogenic assays
Figure 3 compares the experimental surviving fractions for DLD-1 and HT-29 cells exposed to 90Y β−-particles, clinical 6 MV x-rays, and 137Cs γ-ray. The HT-29 cell line was more radioresistant towards all radiation sources compared with DLD-1 within the dose range considered and this was consistent with previously published results for 137Cs γ-ray irradiation (Gao et al 2009). 6 MV x-rays and 137Cs γ-ray induced an almost identical radiobiological response from both cell lines but HT-29 was slightly more sensitive to 137Cs γ-ray at high doses. Table 2 summarises the fitted  ,
,  and
and  values for the survival curves. For 90Y β−-particles, the measured
  parameter encapsulates repair that took place during the 6 d exposure period. The
  and
and  parameters for EBRT derived from our methods were consistent with previously reported values (Miura et al 2012, Gholami et al 2018). It is noteworthy that the estimated
  parameter for HT-29 exposed to 90Y β−-particles was slightly higher than other modalities, though the 95% confidence intervals (CIs) for the estimated
  for 6 MV x-rays and 137Cs γ-ray are overlapped significantly with the 95% CI of the estimated
  for 90Y β−-particles. In contrast, DLD-1 exposed to 90Y β−-particles exhibited less than half of the linear-term radiosensitivity towards 6 MV x-rays and 137Cs γ-ray.
  values for 90Y were very small due to the protracted dose delivery and this led to considerably larger
  ratios.
Table 2. Comparison of  ,
,  , and
, and  -values derived from LQM fitting of the survival curves for DLD-1 and HT-29 cells exposed to either 6 MV x-rays (LINAC), 137Cs γ-ray or 90Y β−-particles. The range shown within brackets represents the 95% CIs of the estimated parameter.
| Cell line | Radiation source | α (Gy−1) |  (Gy−2) (Gy−2) |
 (Gy) (Gy) |
|---|---|---|---|---|
| DLD-1 | LINAC | 0.273 | 0.0189 | 14.4 |
| (0.187–0.359) | (0.009 70–0.0282) | (3.15–25.7) | ||
| 137Cs | 0.264 | 0.0153 | 17.3 | |
| (0.198–0.330) | (0.008 33–0.0222) | (5.37–29.1) | ||
| 90Y | 0.106 | 0.00109 | 97.0 | |
| (0.075–0.137) | (−0.000 122–0.00230) | (36.8–231) | ||
| 90Y |
0.129 | 0 | N/A | |
| (0.114–0.144) | ||||
| HT-29 | LINAC | 0.050 | 0.0276 | 1.81 |
| (0.008–0.092) | (0.0230–0.0323) | (0.0247–3.60) | ||
| 137Cs | 0.056 | 0.0367 | 1.54 | |
| (0.003 43–0.109) | (0.0304–0.0429) | (−0.122–3.19) | ||
| 90Y | 0.090 | 0.000141 | 637 | |
| (0.063–0.116) | (−0.000 969–0.00125) | (−4517–5792) | ||
| 90Y |
0.0897 | 0 | N/A | |
| (0.0792–0.100) |
aAdditional fit using only the linear  component since
  from the standard LQM is consistent with zero.
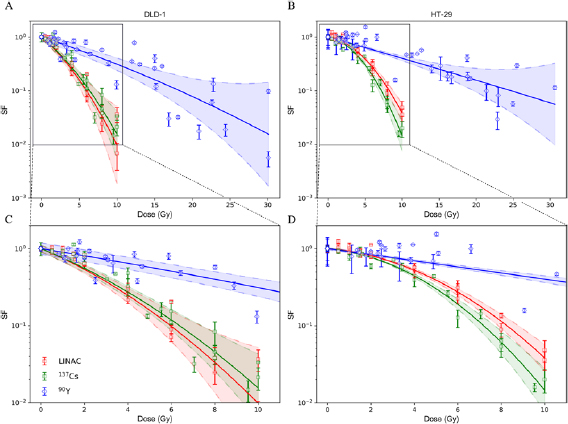
Figure 3. Experimental surviving fractions of (A) DLD-1 and (B) HT-29 cells irradiated by LINAC (red), 137Cs (green), and 90Y (blue). Surviving fraction based on the  and
and  values estimated from fitting a linear mixed-effects model by restricted maximum likelihood are shown (solid lines). The shaded area represents the 95% confidence interval (CI) of the fit. Each data point with its associated error bar is the mean ± standard deviation derived from three biological repeats in a single replicate. Figures (C) and (D) show the close-up in the first 10 Gy.
Download figure:
Standard image High-resolution imageRadiobiological parameters,  and
and  , used in the derivation of equation (3) for
  -ratios provided in table 2, are summarised in table 3. If we adopt the premise that the β parameter for 90Y is equal to that of EBRT by incorporating the dose protraction factor G, we can determine
  for a fully-decayed source by solving
  for
for  (see
(see  in equation S4 in supplemental material) and applying the derived
  to equation (4).
Table 3. Comparison of 90Y SIRT radiobiological modelling parameters derived for each cell line from LQM fitted parameters in table 2. The repair half-time  was determined using supplemental equation (S4).
  was estimated based on the derived
  and equation (4). The last column shows the
  for indefinite exposure. The range shown within brackets represents the 95% CI of the estimated parameter.
| Cell line |  ( ( ) ) |
 ( ( ) ) |
 (h) (h) |
 |
 (Gy) (Gy) |
|---|---|---|---|---|---|
| DLD-1 | 0.388 | 0.0577 | 2.51 | 0.0377 | 148 |
| (0.221–0.555) | (−0.0123–0.1277) | (−0.67–5.69) | (−0.0102–0.0856) | (−56.3–353) | |
| HT-29 | 1.800 | 0.0051 | 0.21 | 0.0033 | 979 |
| (0.198–3.402) | (−0.0351–0.0453) | (−1.48–1.90) | (−0.0230–0.0296) | (−6911–8861) |
Radiobiological modelling
Figure 4 shows  (top panel) and
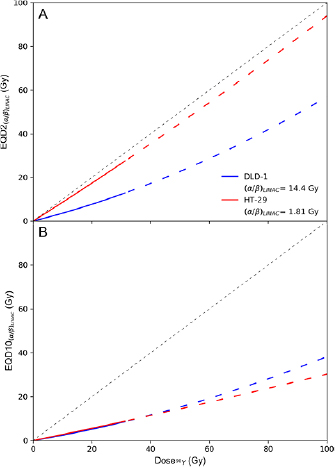
  (bottom panel) of 90Y physical dose calculated using equation (5) and the radiosensitivity parameters presented in table 2. Physical dose of 90Y was extrapolated to 100 Gy assuming an increased initial dose rate is not expected to significantly modify the intrinsic radiosensitivity of DLD-1 and HT-29 towards 90Y β− radiation. This assumption is supported by a previous study of DLD-1 and HT-29 that showed the
  terms were almost equivalent following exposure to 0.25 and 42 Gy h−1 of 137Cs irradiation (Williams et al 2008). The figure shows 90Y SIRT would be less effective than EBRT delivered in 2 Gy fractions for treating the DLD-1 cell line because it exhibits a high
  ratio when exposed to LINAC x- or 137Cs γ-radiation and a low
  value when exposed to 90Y β− radiation. Extrapolating from the fit parameters, it requires ≈100 Gy of 90Y dose to achieve the same biological cell-killing effect as an EBRT of 30 fractions of 2 Gy. In contrast, HT-29 would respond to each Gy of 90Y similarly to each Gy of EBRT delivered in 2 Gy fractions. However, EBRT delivered in 10 Gy fractions was more potent in treating either cell line than 90Y SIRT. It is noteworthy that the accuracy of the predicted EQD is affected by the uncertainties of the estimated radiobiologic parameters (supplemental figure 4).
Figure 4. (A) Equivalent EBRT dose in 2 Gy fractions,  , as a function of 90Y absorbed dose (unfractionated and fully-decayed) for DLD-1 (blue) and HT-29 (red) cell lines. (B) Equivalent EBRT dose in 10 Gy fractions,
  . For 90Y dose greater than 32 Gy, EQD is plotted as a dashed line to indicate that these values were extrapolated from measurements acquired at lower doses (<32 Gy).
Download figure:
Standard image High-resolution image
Discussion
With the increased use of TRT such as 90Y SIRT for liver cancer, there is a pressing need to incorporate radiobiologic information into the decision-making process to optimise dose given during multiple administrations or to combine 90Y SIRT with EBRT, specifically, stereotactic ablative radiotherapy (SABR) for curative intent. Here, the survival of DLD-1 and HT-29 CRC cells after exposure to 90Y β−-particles, 6 MV x-rays, and 137Cs γ-ray were determined by clonogenic assay. Radiosensitivity parameters,  and
and  derived from the fitted survival curves were then used to calculate the equivalent dose in fractionated EBRT for 90Y SIRT.
The experimental setup shown in figure 1 was designed to simulate the mechanism of dose delivery by 90Y SIRT, where 90Y-loaded microspheres are permanently trapped at the arteriolar end of the capillary bed and not internalised into cancer cells. This setup physically isolated the 90Y from the cells, which contrasts with the recent investigation by Gholami et al (2018), where cells were mixed with 90YCl3 in a 96-well plate. Using the MTS assay, they determined metabolic viability curves for three CRC cell lines (HT-29, HCT-116 and SW-48), exposed to 90Y β−-particles and 6 MV x-rays. The respective  and
and  parameters of HT-29 derived from the metabolic viability curves were 0.0842 Gy−1 and 0.0239 Gy−2 for EBRT and 0.0145 Gy−1 and 0.0005 Gy−2 for 90YCl3. Although the MTS assay measures metabolic viability rather than reproductive cell death, the
  and
and  parameters for EBRT agree within the 95% CI of our estimated values. However, results for 90Y diverge. Gholami et al found that ≈56 Gy of 90Y dose (cumulated after 8 d) is necessary to decrease metabolic viability to achieve the same cell kill as a single fraction of 8 Gy EBRT. Our results from clonogenic survival suggest a much lower 90Y dose (cumulated after 6 d) of 20.7 Gy for DLD-1 and 23.6 Gy for HT-29 is necessary. For indefinite exposure, these values are 22.9 and 23.8 Gy, respectively. This discrepancy could be due to the differences in the two assays or the assumption that 90Y did not internalise into the cells and was uniformly distributed throughout the well adopted in Gholami's study. In contrast, our results show that 90Y was not uniformly distributed inside a tissue culture-treated dish and this differential distribution of 90Y could affect dose calculations if not corrected.
The protracted dose delivery of 90Y significantly increased clonogenic survival compared to acute exposure from either LINAC x- or 137Cs γ-irradiation. Although the dose rate of the LINAC was nine times higher than that of the 137Cs irradiator, the radiobiologic responses of DLD-1 and HT-29 towards these modalities were very similar, as both radiation dose deliveries were completed within minutes before damage repair could reduce cell death (Howard et al 2017). In contrast to the linear component, the experimental  was extremely small for 90Y β− radiation and was not significantly different from zero by a Wald test (p > 0.05, DLD-1: 0.001 09 (95% CI, −0.000 122–0.002 30) and HT-29: 0.000 141 (95% CI, −0.000 969–0.001 25)), i.e. not contributing statistically significantly to the fitting of the data within the LQM. The highly suppressed
  was consistent with the predicted
  factor for 6 d exposure (<0.06 for an assumed
  of 0–5 h) (Dale 1996). The very small quadratic term of the LQM for a low-dose-rate radiation treatment is a well known issue and a simplified version of BED where
  , which neglects dose-rate effects, has been used in the literature (Chiesa et al 2015). As expected, this
  assumption does not appreciably alter the value of
  since the CI for
  in each cell line contains zero (table 2).
Furthermore by adopting the assumptions that  and
and  (Dale and Jones 1999), we are able to perform additional radiobiological modelling (table 3). Using these assumptions, we were able to extract a physiologically meaningful
  of 2.5 h for the DLD-1 cell line and an
  of 0.4. Interestingly, the HT-29 cell line was seemingly more sensitive to 90Y than either LINAC or 137Cs, with an
  , although the 95% CIs of their
  -values overlap significantly. Data for HT-29 from Gholami et al (2018) suggest an
  of 0.172, but this value is outside the lower CI for HT-29 in the current study. For
  , the 95% CIs contain negative values for both cell lines and the repair half-time
  was only 12 min for HT-29, which was not expected as physiological repair half-times are generally longer. A short
  could indicate either the experimental uncertainties are so large that it is not possible to extract a suppressed
  parameter with high accuracy and thus a physiologically meaningful repair time or the assumption that 'the β-values are equivalent by incorporating the dose protraction factor
  ' is not valid here. If the latter is correct then, for the HT-29 cell line, we cannot assume that there is a relationship between the radiobiological parameters of 90Y and EBRT. It is worthwhile to point out that the latter assumes not only that the
  values are related through RBEmax but that the
  values are independent of LET. There are other RBE models that predicted a dependence of the
  value on LET (Stewart et al 2018). However, these dependencies were seen mainly in proton and heavier ions at LET values exceeding those of the currently used radiation modalities, that is for LET >4 keV μm−1.
These assumptions need to be tested in other CRC cell lines to determine whether the radiobiology of these cell lines are indeed distinct from that of EBRT. Survival parameters from Gholami et al (2018) suggest  values of 1.04, 1.08, and 1.06 h for HCT-116, SW-48, and HT-29 cell lines, respectively. Although acquired through different methods, these values are consistent with each other and lie within the 95% CI of the parameters extracted from this study. Substituting out
  with our predicted
  , determined from
  using equation (4), further supressed the
  s for 90Y and results in a very high
  ratio. Unless there is a significant biological effect resulting from the cellular internalisation of 90Y, the
  and
and  parameters derived in this work would still apply to other targeted radionuclide therapies, such as peptide receptor radionuclide therapy using 90Y-DOTATATE.
 and
and  were derived to quantify the relative effectiveness of 90Y SIRT compared to EBRT. In the last decade, SABR has been utilised for treating liver metastases of CRC origin (Comito et al 2015). Figure 4 shows that SABR with 10 Gy fractions could be more effective than both standard EBRT delivered in 2 Gy fractions and 90Y SIRT in treating such disease. However, 90Y SIRT could be an attractive alternative to standard EBRT as it has comparable efficacy while sparing healthy tissue due to protraction in dose delivery.
Conclusions
In this manuscript, we report a comprehensive study in which the radiosensitivity parameters of two CRC cell lines, DLD-1 and HT-29, to 90Y β−-particles in comparison to that of EBRT (6 MV x-rays and γ-ray from a 137Cs irradiator) were explored. Using statistical regression of the clonogenic survival data within the LQM framework, we conclude that the  values of cells exposed to 90Y were significantly different from those exposed to either LINAC or 137Cs, whereas the β values were not significantly different from zero. In addition, we provide a framework that relates the physical dose required for 90Y to yield an equivalent EBRT biological response based on the concept of BED. Accounting for these differences in radiosensitivity enables researchers and clinicians to calculate equivalent doses (EQD) in a combined therapy (90Y SIRT and EBRT) setting.
Acknowledgments
The authors are grateful to the reviewers who contributed thorough and insightful feedback and to the following collaborators:
John Prentice and Kyle Hallett at the University of Oxford, Department of Oncology, Mechanical Workshop for development of the experimental container. Martin Gill at the University of Oxford, Department of Oncology for microscopy. Pharmacists of the Radiopharmacy at The Churchill Hospital, Oxford, UK for supplying 90Y-DOTATATE. Physicists of the Radiotherapy Unit at The Churchill Hospital for helping with the use of LINAC resources.
Disclosure
This work was supported by grants from Cancer Research UK (CRUK, Grant No. C5255/A15935) and the Medical Research Council (MRC, Grant No. MC_PC_12004).