

Abstract
Cardiac positron emission tomography (PET) imaging suffers from image blurring due to the constant motion of the heart that can impact interpretation. Hybrid PET/magnetic resonance (MR) has the potential to use radiation-free MR imaging to correct for the effects of cardio-respiratory motion in the PET data, improving qualitative and quantitative PET imaging in the heart. The purpose of this study was (i) to implement a MR image-based motion-corrected PET/MR method and (ii) to perform a proof-of-concept study of quantitative myocardial PET data in patients.
The proposed method takes reconstructions of respiratory and cardiac gated PET data and applies spatial transformations to a single reference frame before averaging to form a single motion-corrected PET (MC-PET) image. Motion vector fields (MVFs) describing the transformations were derived from affine or non-rigid registration of respiratory and cardiac gated MR data.
Eight patients with suspected cardiac sarcoidosis underwent cardiac PET/MR imaging after injection of 5 MBq kg−1 of 18F-fluorodeoxyglucose (18F-FDG). Myocardial regions affected by motion were identified by expert readers within which target-to-background ratios (TBR) and contrast-to-noise ratios (CNR) were measured on non-MC-non-gated, MC-PET, and double respiratory and cardiac gated PET images. Paired t-tests were used to determine statistical differences in quantitative uptake-measures between the different types of PET images.
MC-PET images showed less blurring compared to non-MC-non-gated PET and tracer activity qualitatively aligned better with the underlying myocardial anatomy when fused with MR. TBR and CNR were significantly greater for MC-PET (2.8 ± 0.9; 21 ± 22) compared to non-MC-non-gated PET (2.4 ± 0.9, p = 0.0001; 15 ± 13, p = 0.02), while TBR was lower and CNR greater compared to double-gated PET (3.2 ± 0.9, p = 0.04; 6 ± 3, p = 0.004).
This study demonstrated in a patient cohort that motion-corrected (MC) cardiac PET/MR is feasible using a retrospective MR image-based method and that improvement in TBR and CNR are achievable. MC PET/MR holds promise for improving interpretation and quantification in cardiac PET imaging.
Export citation and abstract BibTeX RIS
List of abbreviations
| CNR | Contrast-to-noise ratio |
| ECG | Echocardiogram |
| FDG | Fluorodeoxyglucose |
| FOV | Field of view |
| GBCA | Gadolinium-based contrast agent |
| LGE | Late gadolinium enhanced |
| MC | Motion correction/motion-corrected |
| MCIR | Motion-corrected image reconstruction |
| MPI | Myocardial perfusion imaging |
| MR | Magnetic resonance |
| MVF | Motion vector field |
| PET | Positron emission tomography |
| ROI | Region of interest |
| RTA | Reconstruct-transform-average |
| SUV | Standard uptake value |
| TBR | Target-to-background ratio |
| TE | MR echo-time |
| TR | MR repetition-time |
Introduction
Positron emission tomography (PET) has many cardiac applications, primarily in myocardial perfusion imaging (MPI) and the assessment of myocardial viability in ischemic disease (Sarikaya 2015). More recently, PET has been used to monitor inflammatory conditions such as cardiac myocarditis and sarcoidosis (Shah et al 2011, Abgral et al 2016, Dweck et al 2018) as well as emerging applications like identifying inflammation in the vasculature (Dunphy et al 2005, Wykrzykowska et al 2009, Rogers et al 2010) and calcification in the coronary arteries (Dweck et al 2012b, Joshi et al 2014, Irkle et al 2015) and aortic valve (Dweck et al 2012a, Chin et al 2015, Jenkins et al 2015).
The heart is in almost constant motion from both respiration and cardiac contraction. This motion has a deleterious effect on PET data which is typically acquired over many minutes. On visual assessment, blurring reduces the ability to resolve small anatomical structures such as the coronary arteries or focal abnormal regions in the myocardium, and can generate false myocardial perfusion deficits (Ouyang et al 2013). Quantitatively, motion leads to local dispersion of activity and under/over-estimation of hot/cold spots in the PET image, which can affect the ability to discriminate abnormal from healthy uptake based on predetermined activity thresholds and to quantify changes over time. Moreover, for many applications such as multi-parametric analysis, dynamic PET imaging, and partial volume error correction, success may not be possible without correcting for these sources of motion.
Gating PET data to more quiescent physiological states is possible (for example, end-diastole, comprising one third of the cardiac cycle), but this approach discards the majority of PET counts acquired and reduces signal-to-noise ratio (SNR). This can be compensated for by a longer acquisition (in this case three times longer) or a higher administered dose (again, three times), neither of which are attractive for routine clinical imaging. Alternatively, correction for motion would enable all acquired data to be used in the final image. Some investigators have demonstrated PET-driven correction for motion in the heart (Gigengack et al 2012), coronary arteries (Slomka et al 2015) and aortic valve (Doris et al 2017). However, this approach is demanding as it requires sufficiently intense uptake in the region of interest to extract motion information.
Hybrid PET/MR is a recently-available technology that allows simultaneous acquisition of MR and PET data. Anatomical MR imaging can therefore potentially be used to directly track or model the respiratory and cardiac motion occurring during collection of PET data. Such a paradigm is limited in PET/CT by the rapid accrual of radiation exposure associated with CT imaging over time. Whilst the potential for motion-corrected (MC) cardiac PET/MR has been discussed for some time (Ouyang et al 2013, Catana 2015, Munoz et al 2016, Rakvongthai and El Fakhri 2017, Cal-González et al 2017, Guo et al 2018), its translation to clinical imaging has gone largely unrealized until recently (Kolbitsch et al 2017, Munoz et al 2018, Petibon et al 2017, Küstner et al 2017, Munoz et al 2018). This study explores the feasibility of estimating cardio-respiratory motion models from MR and the subsequent integration of this information into a PET motion correction protocol using a retrospective image-based reconstruct-transform-average (RTA) approach. Moreover, we apply this technique in a realistic patient group and assess its impact on quantification of tracer uptake in the myocardium.
Sarcoidosis is a multisystem condition characterized by granuloma formation, inflammation, and sometimes fibrosis. Cardiac involvement is the most frequent cause of death (Iannuzzi et al 2007, Birnie et al 2016). Recent studies have shown elevation of 18F-fluorodexyglucose (18F-FDG) uptake in the myocardium of patients with cardiac sarcoidosis (Dweck et al 2018). Cardiac sarcoidosis typically shows a patchy appearance of uptake in the myocardium. The often small, low intensity, possibly isolated hot-spots of uptake are prone to blurring due to cardiac motion and may cause false negative interpretation. This patient group is one in which MC PET/MR may have a significant diagnostic impact.
Methods
RTA approach
The overall approach to motion correction taken here is described in figure 1. The RTA approach (Picard and Thompson 1997, Klein et al 1997) is centered on three components: (1) Measure the physiological phase of respiratory and cardiac motion at all times during the acquisition of PET data. (2) Bin all PET data into distinct cardio-respiratory phases. Thus, for N respiratory phases and M cardiac phases, there are N × M distinct bins of data. Binned data is then reconstructed to form an image for each physiological phase. (3) Model the physiological motion between each of the phases and a single reference phase. Motion vector fields (MVFs) describing the transformations between phases can then be applied to the individually reconstructed PET images to form a single MC image at the reference phase. To study the feasibility of MC PET/MR, the RTA method was initially selected due to the simpler implementation of the methodology compared to more sophisticated approaches that incorporate MVFs into the iterative PET reconstruction (Qiao et al 2006, Li et al 2006, Lamare et al 2007, Karakatsanis et al 2016). These latter methods are known to have more optimal noise characteristics (Polycarpou et al 2012, Fayad et al 2015) however they may also be prone to distributing errors in MVFs throughout the data.
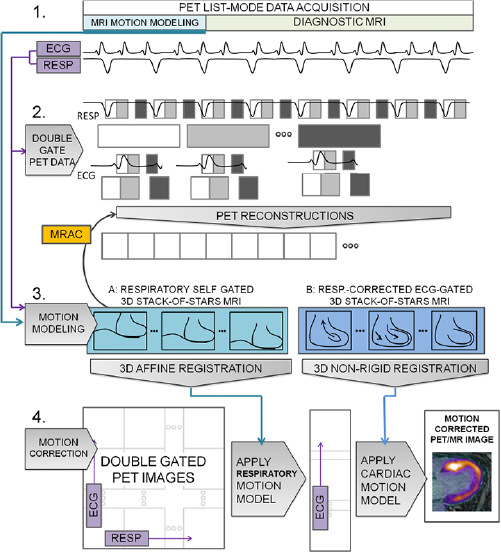
Figure 1. The method for RTA motion correction. In step 1, list-mode PET data are acquired simultaneously with MR image-based motion modeling, and diagnostic MR image data. Physiological phase is also monitored throughout. In step 2, PET data are double-gated using the acquired physiological phase information, first into respiratory bins; subsequently, each respiratory bin is divided further into bins according to cardiac phase resulting in N (respiratory) × M (cardiac) phase bins. PET images for each bin are then reconstructed. MR-based attenuation correction (MRAC) data are derived from the motion modeling image data. The appropriate respiratory motion models from step 3 are applied to the MRAC data for the PET reconstruction for each respective bin. In step 3, MVF models are calculated. Using the physiological phase information to analogously gate MR data, images representing respiratory and cardiac phases are produced. Affine and non-rigid registration is applied to subsequent physiological phase images to estimate MVFs for respiratory and cardiac motion models, respectively. In step 4, the NxM double-gated PET images are first spatially transformed by the appropriate respiratory and cardiac transforms into a single reference frame. Then, they are averaged in the final step to produce a motion-corrected PET/MR image.
Download figure:
Standard image High-resolution imagePhysiological binning
Cardiac phase was determined by comparing data-acquisition times with conventional ECG triggering. Respiratory phase was determined directly from the PET data count rate based on the observation that 18F-FDG distributes extensively in the lung and liver resulting in a count rate that varies with the volume of the liver in the field of view (FOV) of the PET detectors. Count rate was summed over all detectors in 200 ms bins and traced over time. This provided sufficient count-statistics and time resolution to determine respiratory phase. Decay of the count rate due to renal extraction of the tracer was corrected by applying a sliding window normalization factor to each bin-value calculated from the sum of the following 50 bins, equivalent to 10 s of data. Finally, the trace was smoothed by a sliding window averaging kernel of five bins, equivalent to 1 s of data.
PET data were assigned into three (M = 3) cardiac gates that nominally encompassed systole, the filling phase of early diastole, and the diastasis and late filling phases of late-diastole. Informing the initial choice of number-of-bins were the competing effects of sufficient data to form physiologically gated images and sufficient bins to capture the expected motion. For this study, the minimal number-of-bins to capture the nominal motion was selected. The average R–R interval was determined on a patient-by-patient basis and windows of one third of this interval were applied after each ECG trigger event. In the presence of variable beat interval, the last bin has a variable width. Respiratory phase was assigned by dividing the respiratory trace amplitude between the 5th and 95th percentiles into four (N = 4) even windows. Four phases were chosen to encompass inhalation, expiration, and two intermediate phases. The outlying events were included in the first and last respiratory bins, respectively.
MR-based motion modeling
In order to obtain separate 3D images representing different respiratory and cardiac phases to describe physiological motion, it is necessary to acquire image data over many physiological cycles. MR data were acquired during free breathing over several minutes after which each acquired k-space line was binned according to its physiological phase. A gradient-echo MR sequence with radial, stack-of-stars, k-space coverage was used to provide robustness to residual displacements within the physiologically binned data. Moreover, a golden-angle k-space sampling pattern was used to provide additional robustness to the resulting un-even distribution into physiological bins. The sequence used (work-in-progress 793F) was provided as a research tool by Siemens Healthineers (Erlangen, Germany).
Modeling for respiratory and cardiac motion was achieved by two separate MR acquisitions with coverage and spatial resolution requirements chosen a priori to be suitable for the respiratory and cardiac motions expected to influence PET data. For the larger-scale displacements due to respiratory motion, spatial resolution was set at 3 mm to be slightly smaller than the expected PET data resolution. For the more complex motion of the heart, the spatial resolution was set to be 1.4 mm, sufficient to capture the smallest features that may be of interest including the coronary arteries. For respiratory modeling the coronal volume was placed over the whole chest and abdomen to fully encompass the attenuating tissue for attenuation correction. The sequence parameters were: 500 × 500 mm2 FOV, 72–88 slices covering the whole body with 5/8 partial-Fourier Cartesian slice-encoding, 3 mm isotropic resolution, repetition-time/echo-time (TR/TE) = 4.5/2.45 ms, in-phase TE, 9° flip angle, 1600 radial views, acquisition time 6–7 min. For cardiac modeling additional coverage of the chest and abdomen was not required. In order to save scan time, the coronal volume was placed to cover only the heart. Anticipating the complex motion in the heart, it was postulated a priori that contrast-enhanced images that provided differentiation between the blood pool and myocardium as well as the coronary arteries would benefit the estimation of cardiac motion. A 30 ml dose of a high-relaxivity gadolinium-based contrast agent (GBCA) (Multihance, Bracco, Milan) was infused at 0.3 ml s−1 beginning 60 s prior to the MR data-acquisition to achieve contrast-enhanced images in a similar manner to MR angiographic methods (Liu et al 2008). The sequence parameters were: 400 × 400 mm2 FOV, 88 slices, 18.2% slice over-sampling, 1.4 mm isotropic resolution, TR/TE 3.96/1.76 ms, 5/8 slice partial-Fourier, 73 lines per shot, flip angle 13°, fat saturation preparation, 1792 radial views, acquisition time 9–10 min. The total acquisition time for motion modeling was 15–17 min.
Cardiac phase was determined by comparing MR data-acquisition times with conventional ECG triggering. Respiratory binning of k-space data was achieved using a self-gating approach. The respiratory self-gating trace was formed from the magnitude of the center of k-space, which was included in each acquired shot of data. A single shot contained all the partitions of any one radial spoke and was acquired with a temporal resolution of 203–248 ms or 289 ms for respiratory and cardiac motion acquisitions. This was deemed sufficient to sample a typical resting respiratory period of 3–5 s. The magnitude of the center of k-space is a measure of the volume of liver in the FOV and reflects respiratory phase as described for the PET count rate. This trace was then smoothed by a sliding window spanning five points or between 1015 ms and 1445 ms. Finally, a principal component analysis on the group of respiratory traces from each of the receiver channels used for signal reception was performed and the principal component selected as the final MR-based respiratory trace. Each data-bin contained an equal amount of data to ensure adequate sampling for each respiratory phase image.
After binning into N × M bins the data become approximately an order of magnitude under-sampled which may lead to conspicuous image artifacts. To limit the degree of under-sampling, binning over only either the respiratory or cardiac phases was performed at once. For respiratory modeling, it was assumed that cardiac motion did not significantly affect the boundaries of the heart, liver and lungs. For cardiac modeling, simple respiratory motion compensation for the principal head-to-foot motion of the heart was performed for data in each cardiac bin. A signal-phase ramp in k-space was applied in the head-to-foot direction to transform all data to the end-expiration physiological phase. The amplitude of the signal-phase ramp was determined from a semi-automated routine to determine the position of the diaphragm at each respiratory phase. A pencil beam navigator was manually drawn over the diaphragm before the location of the diaphragm edge was determined automatically; the difference in location with respect to the end-expiration location was used to scale the phase ramp. A scaling factor of 0.6 was also applied as is often done for MR respiratory navigators for cardiac imaging to translate displacement of the diaphragm to displacement of the heart.
After binning into physiological phases, data becomes distributed pseudo-randomly over radial spokes and partitions for each phase. The corresponding k-space trajectory is then calculated based on the known golden-angle schedule of the acquisition for each k-space line and reconstructed using open-source radial image reconstruction tools written in Matlab (Mathworks, Natick, MA) (Fessler).
MVF estimation
MVFs between physiological phase images were calculated by applying an affine or non-rigid registration algorithm to map each physiological frame to a reference frame. Respiratory and cardiac MVFs were determined separately by applying the registration to the respiratory and cardiac MR acquisition data respectively. The target reference phases were end-expiration and late-diastole. An open-source non-rigid registration tool was used (Buerger et al 2011). The hierarchical adaptive local affine registration approximates non-rigid registration by applying simpler affine registrations to successively smaller sub-divisions of the FOV. In the first step, an affine registration is applied to the whole FOV. In the next step, the FOV is split into eight blocks and the affine registration applied to each block. For cardiac motion estimation, three steps were used; for respiratory motion estimation, only the first level affine registration was applied.
RTA PET reconstruction
PET image reconstruction of cardio-respiratory binned data employed a standard PET reconstruction employing an iterative ordinary Poisson ordered-subsets expectation-maximization algorithm with 21 subsets and 3 iterations incorporating point-spread-function resolution modeling (Aklan et al 2016), a 344 × 344 × 127 matrix and a 2 mm full-width-at-half-maximum Gaussian post-reconstruction filter. Reconstruction was performed off-line using tools equivalent to those on the scanner, provided for research purposes by Siemens Healthineers (Knoxville, TN). Attenuation maps, measured in the end-expiration phase (see PET/MR Imaging below), were transformed using measured respiratory MVFs to each corresponding respiratory phase. On the assumption that cardiac motion occurs primarily within the soft tissue outline of the heart, no adjustment for cardiac motion was made for the attenuation maps. Once reconstructed, PET images for each cardiac phase were first transformed to the end-expiration phase using the MVFs derived for respiratory correction and summed leaving M cardiac phase images. Secondly, all summed cardiac phase images were transformed to late-diastole using the cardiac MVFs. The late-diastolic phase was chosen to match MR data that are typically acquired in late-diastole, however, it is equivalent to choose systole as the reference frame where the myocardium is thicker. Final summation resulted in a single end-respiration-late-diastolic frame incorporating all acquired PET data.
Patient population
Patients with suspected cardiac sarcoidosis were recruited for 18F-FDG-PET/MR imaging to assess active inflammation of sarcoidosis in the myocardium as part of a larger study in our institution. Exclusion criteria included MR-incompatible implants, insulin-dependent diabetes, claustrophobia, or pregnancy/breastfeeding. Our Institutional Review Board approved this study and all patients gave written informed consent. Patients with increased myocardial uptake (SUV > 5 in any hotspot) were then selected to assess the impact of motion correction on the observed signal.
PET/MR imaging
All imaging was performed on a hybrid PET/MR system (Biograph™ mMR, Siemens Healthineers, Erlangen, Germany) running VB20P software. The body transmission coil, a flexible 6-channel body arrayed-receiver and a 6-channel spine arrayed-receiver mounted in the scanner table were used to acquire MR data. For attenuation correction of PET data, only the transmit-coil and spine-array were included in the attenuation map. Using a method described previously (Robson et al 2017), attenuation correction for the body in the PET reconstruction was estimated using the radial gradient-echo image used for respiratory motion modeling. All data were used to produce a motion-averaged image. This was taken to correspond to the reference end-expiration phase on the assumption that end-expiration is the most likely phase of the respiratory cycle. This image was then segmented into two components: (i) soft tissue and fat (both components assigned linear attenuation coefficient 0.1 cm−1) and (ii) lung and background air (both components assigned linear attenuation coefficient 0 cm−1).
Patients were required to have fasted for at least 6 h and have serum blood glucose levels <200 mg dl−1 prior to injection with 5 MBq kg−1 of 18F-FDG. In this study, PET data acquired between 30 and 90 min post injection were analyzed. PET data were recorded in list-mode format.
In addition to motion modeling, a diagnostic cardiac MR protocol was acquired.
Quantitative assessment of myocardial 18F-FDG activity
Two observers (one with clinical expertise, MGT) inspected the non-MC non-gated PET images and identified areas that were affected by motion based on a blurred appearance compared to neighboring regions of myocardial uptake and/or an apparent loss of signal in non-MC non-gated images in comparison to the MC images (figure 2). Regions-of-interest (ROIs) were drawn manually over these areas on the non-MC non-gated PET images, the MC-PET images and the double respiratory (end-expiration) and cardiac (late-diastolic) gated PET images. Mean standard uptake values (SUVmean) were recorded. Target-to-background ratio (TBR) was calculated by dividing SUV values with the mean blood pool activity (SUVmean) from an ROI in the right atrium, or ventricle delineated in the same image. Contrast-to-noise ratio (CNR) was found by subtracting the background blood pool activity (SUVmean) from the myocardial activity before dividing by the standard deviation (SD) of the SUV values in the blood pool ROI. A single-sided paired t-test was performed between TBR values, and CNR values, from the different types of PET images. A value of p < 0.05 was considered significant. In a second assessment, six American Heart Association (AHA) segments were drawn manually in a mid-ventricular short axis slice for each patient. SUVs were recorded similarly on each type of PET image, and TBRs and CNRs calculated. A paired t-test was again used to evaluate differences between types of PET images.

Figure 2. Identifying regions affected by motion. Regions affected by motion in the myocardium were identified by areas of blurring and signal loss in the non-motion corrected (MC) non-gated PET images compared to the MC-PET images, as in the antero-lateral wall in this example (solid line). Background regions-of-interest were drawn in the blood pool in the right or left ventricle (dashed line).
Download figure:
Standard image High-resolution imageResults
Eight patients with myocardial SUV greater than 5 were included in this study. Patients (four female) had an average age of 60 ± 10 years, a heart rate of 62 ± 9 beats min−1, and received 349 ± 33 MBq of 18F-FDG.
PET data gating
Successful self-gating of PET data is demonstrated in figure 3. The self-gating trace is shown alongside PET frames at inspiration and expiration that show the different position of the diaphragm at each physiological phase.

Figure 3. Respiratory self-gating of PET data. PET counts plotted over time (a) used to provide successful respiratory self-gating to bin all PET data into separate reconstructed PET images (b) at inspiration and expiration. Horizontal line shows difference in position of the diaphragm in each physiological state.
Download figure:
Standard image High-resolution imageThe correspondence between the separate self-gating of PET data and MR data is demonstrated in figure 4. The two estimates of respiratory displacement show reasonable correspondence in respiratory phase used to gate the raw data respectively. However discrepancies in the amplitude and overall waveform of the signal remain. The Pearson correlation coefficient between PET- and MR-derived self-gating signals across all patients was 0.11.

Figure 4. Correspondence of respiratory self-gating of MR and PET data. Separate self-gating of PET and MR data show reasonable correspondence as demonstrated over 3 min of simultaneous acquisition. The Pearson correlation coefficient between PET- and MR-derived respiratory self-gating signals for this patient was 0.41.
Download figure:
Standard image High-resolution imageMotion modeling
The efficacy of the MR-based motion modeling approach is demonstrated in figures 5 and 6. The four respiratory frames reconstructed by self-gated radial stack-of-stars MR are shown in figure 5. The level of the diaphragm can be seen to differ at inspiration and expiration as expected. MVFs derived by affine registration between frames, when applied to each frame, produce deformed images that align with the expiration reference frame. The fidelity of the transformation is shown by low residual errors in the difference images between the reference and transformed frames. Cardiac frames at systole and late-diastole are shown in figure 6. Morphological differences are evident, including the size of the ventricle, width of the aortic outflow tract, location of the papillary muscle, and shape of the right ventricular wall. The systolic frame, when transformed to the reference late-diastolic frame by non-rigid registration, shows good agreement with the reference. Difference images show structured spatial mismatch errors are resolved after transformation.

Figure 5. Respiratory motion modeling based on MR data. Top row (a) shows two sagittal slices through the acquired 3D volume (through the dome of the liver and through the heart) gated into four respiratory frames by the MR-derived self-gated trace (e). Horizontal lines show the displacement of the diaphragm and heart during the respiratory cycle. Second row (b) shows each frame after deformation by the affine registration routine to match the reference end-expiration position of each slice respectively (frame 4 is the same reference frame in (a) and (b)). Third row (c) shows the difference between each frame in (a) and the reference frame, frame 4; and fourth row (d) shows the difference between the deformed frames in (b) and the reference frame, frame 4. Together, these rows show the successful operation of the MVFs to transform respiratory frames to one reference position.
Download figure:
Standard image High-resolution image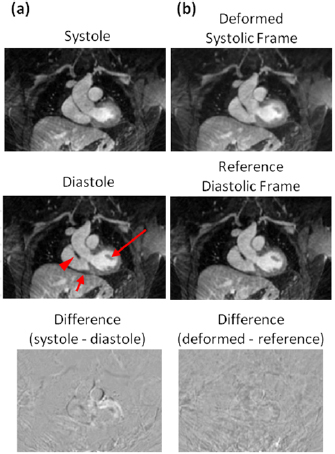
Figure 6. Cardiac motion modeling based on MR data. Systolic and late-diastolic frames (a) after respiratory motion correction and gating based on recorded ECG triggers show morphological differences in the size of the ventricle, width of the aortic outflow tract, location of the papillary muscle (long arrow) and shape of the right ventricle wall (short arrow). In (b), the systolic frame after being deformed to the target reference late-diastolic frame shows morphological features matching those in the reference, including thickness of the right ventricle wall with the outflow tract (arrowhead). The difference image between systolic and late-diastolic frames shows clear structure (a); whereas this has been minimized in the difference between deformed frame and reference frame (b).
Download figure:
Standard image High-resolution imageEffect of motion correction on PET data
MC and non-MC non-gated PET images showed qualitative differences upon inspection of tracer uptake in the myocardium (figures 2 and 7). Areas affected by motion were easily identified, appearing blurred and wider than other areas of the myocardium. Among those areas, 20 areas were identified for analysis and occurred mostly in the anterior and lateral walls of the myocardium (table 1). After motion correction, areas affected by motion were noticeably more focal and qualitatively aligned better with the underlying anatomy of the myocardium when fused with MR images that were acquired in the reference end-expiration late-diastolic phase (figure 7). Double-gated images showed a similar pattern of more focal tracer distribution but were limited by an overall reduction in SNR (figure 7). PET/MR images before and after motion correction for all eight patients are shown in figure 8.
Table 1. Areas in the myocardium affected by motion.
| Region | Frequency |
|---|---|
| Lateral wall | 7 |
| Anterior wall | 7 |
| Septal wall | 2 |
| Inferior wall | 3 |
| Right ventricle wall | 1 |
| Total | 20 |
| Basal | 7 |
| Mid-heart | 8 |
| Apical | 5 |
| Total | 20 |
The 20 areas analyzed are categorized circumferentially and longitudinally by region. Frequency is the number of times each analyzed area was categorized as the given region.

Figure 7. Motion-corrected cardiac PET/MR in vivo. Non-motion corrected (MC) non-gated, MC, and double-gated PET images showing uptake of 18F-FDG tracer in the myocardium in a patient. 18F-FDG-PET is also fused with 3D respiratory-navigated, ECG-triggered MR image of the heart. Non-MC non-gated PET data show regions affected by motion that can be identified by a smooth, broader and lower intensity signal compared to equivalent areas of the myocardium as in the lateral wall, especially at the base, in this example (arrowheads). MC-PET images show recovery of signal in these regions. After MC, tracer uptake is qualitatively much better aligned with underlying anatomy (arrow). Double-gated images also show signal recovery in areas affected by motion at the expense of lower overall SNR.
Download figure:
Standard image High-resolution image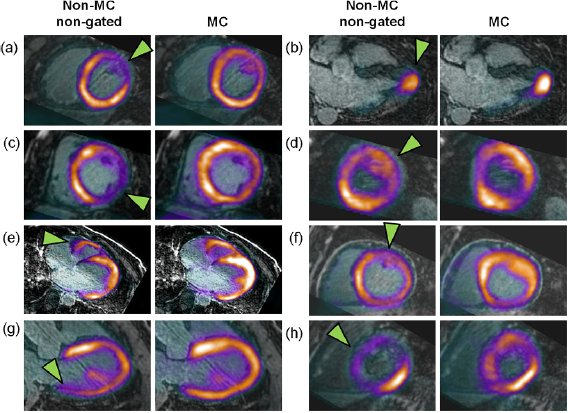
Figure 8. Motion-corrected PET/MR. Fused non-MC non-gated PET/MR images and MC-PET/MR images in all eight patients (a)–(h) showing regions most affected by motion (arrowheads).
Download figure:
Standard image High-resolution imageQuantitative assessment of myocardial 18F-FDG activity
Quantitative analysis for regions affected by motion is summarized in table 2. TBR values in the non-MC non-gated images, MC-PET images, and double-gated PET images were 2.4 ± 0.9, 2.8 ± 0.9, and 3.2 ± 0.9, respectively. Physiological variation across the patient group gave an average SD of 0.9. Using the paired analysis, TBR values in the MC-PET images were significantly increased compared to non-MC non-gated images (p = 0.0001). They were also marginally significantly lower than in double-gated PET images (p = 0.04) (figure 9). CNR values for MC-PET images were significantly higher (21 ± 22) compared to both non-MC non-gated (15 ± 13, p = 0.02) and double-gated PET images (6 ± 3, p = 0.004). Results for the AHA-segment analysis were less conclusive (figure 10). TBR values in the non-MC non-gated images, MC-PET images and double-gated PET images were 2.5 ± 1.5, 2.4 ± 1.3, and 2.8 ± 1.9, respectively, with no significant difference found between the non-MC non-gated and MC-PET images (p = 0.23). TBR was significantly higher for double-gated PET images compared to MC-PET images (p < 0.001). CNR values for MC-PET images were again significantly higher (13 ± 10) compared to both non-MC non-gated (10 ± 8, p = 0.007) and double-gated PET images (5 ± 4, p < 0.001)
Table 2. Quantitative analysis of PET images in areas affected motion.
| ROI | TBR | CNR | ||||
|---|---|---|---|---|---|---|
| NON-MC NON-gated | MC | Double-gated | NON-MC NON-gated | MC | Double-gated | |
| 1 | 1.57 | 1.68 | 1.81 | 8 | 10 | 3 |
| 2 | 1.64 | 1.78 | 1.98 | 9 | 11 | 3 |
| 3 | 1.85 | 1.98 | 2.29 | 12 | 14 | 4 |
| 4 | 1.98 | 2.40 | 2.59 | 10 | 15 | 5 |
| 5 | 2.60 | 2.57 | 2.82 | 16 | 17 | 5 |
| 6 | 3.31 | 3.05 | 3.48 | 23 | 22 | 7 |
| 7 | 1.97 | 2.61 | 2.21 | 12 | 17 | 4 |
| 8 | 2.91 | 3.65 | 5.26 | 23 | 28 | 9 |
| 9 | 2.88 | 3.40 | 4.24 | 22 | 25 | 7 |
| 10 | 2.99 | 3.51 | 3.48 | 24 | 26 | 5 |
| 11 | 1.90 | 2.32 | 3.96 | 9 | 12 | 12 |
| 12 | 2.30 | 2.67 | 3.16 | 14 | 16 | 8 |
| 13 | 1.69 | 1.81 | 3.18 | 7 | 8 | 9 |
| 14 | 1.34 | 2.70 | 2.48 | 1 | 17 | 3 |
| 15 | 2.34 | 2.61 | 3.42 | 4 | 16 | 4 |
| 16 | 2.09 | 3.10 | 3.46 | 3 | 22 | 4 |
| 17 | 4.74 | 5.61 | 2.96 | 60 | 80 | 7 |
| 18 | 1.53 | 1.83 | 2.71 | 5 | 5 | 6 |
| 19 | 3.26 | 3.26 | 3.87 | 20 | 14 | 10 |
| 20 | 3.67 | 3.91 | 4.55 | 23 | 18 | 12 |
| Mean | 2.43 | 2.82 | 3.20 | 15 | 21 | 6 |
| SD | 0.86 | 0.93 | 0.89 | 13 | 22 | 3 |
| p-value | 0.0001 |
0.04 |
0.02 |
0.004 |
||
Quantitative TBR and CNR values are given for each myocardial region for different PET image types: MC, non-MC non-gated, and double-gated images. Mean and SD values are also given; significance p-values for a paired t-test are given between anon-MC non-gated and MC; and bMC and double-gated.

Figure 9. Quantitative analysis of motion-corrected PET/MR in a patient cohort in myocardial regions affected by motion. Quantitative analysis of (a) TBR and (b) CNR in regions affected by motion shows a significant increase (paired t-test) of TBR in motion-corrected (MC) and double-gated PET images compared to non-MC non-gated PET images. CNR was significantly higher in MC-PET images compared to both non-MC non-gated images and double-gated images.
Download figure:
Standard image High-resolution image
Figure 10. Quantitative analysis of motion-corrected PET/MR in a patient cohort in standard AHA segments. Quantitative analysis of (a) TBR and (b) CNR in six mid-ventricular AHA segments shows a significant increase (paired t-test) of CNR in MC PET images compared to non-MC non-gated and double-gated PET images. TBR was not significantly different in MC-PET images compared to non-MC non-gated images.
Download figure:
Standard image High-resolution image
Discussion
Whilst the potential for MC cardiac PET/MR has been discussed for some time its translation to clinical imaging has gone largely unrealized until recently.
Other investigators have demonstrated similar approaches to MC cardiac PET/MR in silico (Wang et al 2017) and in vivo (Kolbitsch et al 2017, Munoz et al 2018, Petibon et al 2017, Küstner et al 2017, Munoz et al 2018), showing results consistent with those demonstrated here. Kolbitsch et al independently developed a similar approach to that presented here, using radial MR imaging to estimate cardio-respiratory motion, and primarily tested their approach in animal models (Kolbitsch et al 2017). The results in animals showed improvement in myocardial wall thickness and CNR measurements; the single patient in that study yielded noisier images compared to the animal model. Petibon et al used a tagging-MR method in animal models (Petibon et al 2017) showing an increase in myocardium to blood ratio. Munoz et al used a respiratory correction scheme to improve cardiac PET in a group of oncology patients (Munoz et al 2018) and cardiovascular disease patients (Munoz et al 2018), whilst Kustner et al demonstrated respiratory and cardiac motion estimation and evaluated liver and lung lesions (Küstner et al 2017).
In this study, novel application of motion correction techniques has demonstrated the feasibility of using MR to estimate motion models for cardio-respiratory motion and subsequent motion correction of cardiac PET data. Moreover, we have demonstrated this in a realistic patient group, and established a quantitative improvement in TBR and CNR compared to non-gated images. To the best of our knowledge this is the first study to demonstrate such results in a group of patients.
The primary limitation of this study was the selection of RTA (Picard and Thompson 1997, Klein et al 1997) over a MC image reconstruction (MCIR) PET reconstruction (Qiao et al 2006, Li et al 2006, Lamare et al 2007, Karakatsanis et al 2016) that includes motion models within the PET reconstruction and is known to improve the noise characteristics of the final image compared to RTA (Polycarpou et al 2012, Fayad et al 2015). RTA was chosen due to its relative ease of implementation for these initial studies and secondly to prevent possible confounding propagation of registration errors in the iterative PET image reconstruction. The extent of the improvement between RTA and MCIR will be the subject of further work. A second limitation is the qualitative method for selecting regions for TBR and CNR analysis. This method, based on identifying myocardial regions affected by motion, was chosen to focus on regions where motion induces blurring and a loss in TBR in order to statistically test whether motion correction improves TBR. In this study we included a secondary analysis based on standard AHA segments in the mid-ventricle as an alternative. The secondary analysis did not show a significant difference in TBR between MC-PET and non-MC non-gated PET images which we attribute to the fact that this method inherently includes regions not significantly affected by motion that do not show a substantial change in TBR after motion correction. Inclusion of these regions in the analysis therefore limited the statistical test. A more objective approach that is also able to account for regions in which signal pile-up is corrected after motion correction (leading to reduced TBR after motion correction) is now required to assess MC-PET/MR more rigorously. Similarly, the regional approach has led to multiple regions in a single patient being used. This potentially introduced bias to the analysis, however, in this initial study, accounting for such bias is not likely to alter the primary finding that cardiac MC PET/MR increases quantitative TBR and CNR measurements. Of potential significance but beyond the scope of this work is the potential for noise conditioning from any of the steps in the motion correction process. This may impact CNR values, driven by changes in noise values rather than changes in contrast, but would not affect TBR values. This suggests that qualitative metrics and multiple quantitative metrics should be considered in evaluating the benefits of motion correction.
In addition, there are a number of methodological limitations in the individual elements of the overall motion correction method. In this work we sought to correct for the principal first-order effects of cardio-respiratory motion and made a number of reasonable assumptions and estimations. Improvements in each element of the overall method will be possible which we anticipate will further increase the improvements in MC-PET images found in this study. We now discuss some of these methodological limitations. Firstly are the a priori selections for the number of respiratory and cardiac phases and the parameters for the affine and non-rigid registrations. While these were based on simple and reasonable assumptions, it was outside of the scope of this study to explore multiple approaches and their impact on the results. Optimizing the number of physiological phases used and the registration parameters will improve the motion models used and ultimately the quantitative TBR and CNR measurements in the MC-PET images. Imperfect motion models may explain double-gated PET images exhibiting higher TBR than MC-PET images in this study. Parameter optimization will be the subject of further work. In this initial study we used two separate acquisitions to acquire respiratory and cardiac motion due to the different spatial resolution requirements of each motion and the use of GBCA to increase contrast of cardiac anatomy. In future studies it may be possible to perform motion modeling in a single acquisition, increasing the efficiency of MR data-acquisition. Similarly, we did not implement advanced methods to accelerate image acquisition and improve reconstruction from highly under-sampled data such as compressed sensing. Such methods will not only speed up acquisition of motion models it will allow more physiological phase images to be used, which may increase the impact of motion correction. The methods used to extract MVFs is also an area for further study (Feng et al 2018). In this work we have used separate respiratory self-gating for PET and MR data. This was chosen in order to allow PET data acquired during other diagnostic MR to be used in the MC-PET data. The correspondence between the self-gating of PET and MR data was acceptable in this study however improvements are possible. Despite the low correlation coefficient between PET- and MR-derived respiratory self-gating signals, this method produced robust gated images in the appropriate physiological phases, as shown in figures 3 and 5. Optimization of the correspondence between self-gating signals will ensure the MR motion states used to derive MVFs correspond directly to the PET data being corrected. However, using the RTA approach provides some robustness to residual discrepancies between the motion states used to estimate MVFs (MR data) and the motion states being corrected (PET data) by retrospectively applying the estimated spatial transformations in the image domain. Moreover, using a common source for respiratory self-gating, such as a respiratory belt or camera technology, may improve the correspondence of MVFs for MR and PET data and may improve the recovery of TBR by MC-PET images compared to double-gated PET images. More generally, the methods used for respiratory motion self-gating may be improved in further work. For PET-based self-gating, utilizing the distribution of the tracer in the liver may not be adequate for more specific tracers. For MR-based self-gating, our method of using a principal component analysis of the MR signals in all receiver coil elements to extract the dominant respiratory motion of the liver may be improved by eliminating coils not close to the diaphragm, where motion of the heart may predominate. In addition, in this study we did not evaluate the separate incremental improvements from respiratory and cardiac motion correction. This will be an important factor in optimizing the overall approach to motion-corrected PET/MR in future work. Also of interest in further development would be the comparison of MR-driven motion modeling to PET-driven motion modeling, and investigation of hybrid approaches, for example the use of MR-based modeling to drive respiratory correction and PET-based modeling of cardiac motion. This may be useful in applications such as MPI where there is abundant PET signal but may falter for more specific tracers that are not widely distributed through the moving organs. Finally, a number of assumptions were made about the primary motions to be corrected in the modeling: that cardiac motion had minimal impact on the distribution of attenuating tissues in the MRAC maps; that head-foot motion compensation was sufficient in the cardiac motion modeling step; and that the motion-averaged position during free breathing MR was representative of the reference end-expiration physiological frame. Fully accounting for all these effects may provide additional improvements in the final motion correction.
The results obtained in this study demonstrate that MC PET/MR methods hold considerable promise for reducing motion artifact and improving the accuracy of interpretation and quantification, thereby improving PET imaging in the heart. Although the differences between MC and non-gated PET images were relatively small in this study, MC cardiac PET/MR may have a clinical impact in interpretation of more subtle features such as the patchy appearance of focal inflammation in cardiac sarcoidosis and myocarditis, as well as in evaluating subtle perfusion deficits or providing quantitative measurements in MPI (Petibon et al 2017, Guo et al 2018). In addition, the more accurate TBR measurements possible with motion correction may have significant benefits in longitudinal clinical studies or in a research setting where accurate quantification plays a role in evaluating imaging results. Motion correction will be crucial for imaging disease activity in coronary arteries where the small highly mobile structure is especially prone to signal diminution due to motion. Moreover, motion correction is a pre-requisite step for further developments in PET imaging such as partial volume correction and dynamic analysis. The encouraging results of this study in vivo warrant continued investigation of MC-PET/MR techniques. Finally, further patient studies are now needed to establish the clinical benefits of MC-PET/MR.
Conclusion
MC cardiac PET/MR with MR-based motion modeling using a golden-angle radial stack-of-stars trajectory is feasible. This study has demonstrated that motion-corrected PET/MR improves the visual appearance of 18F-FDG uptake in areas of the myocardium affected by motion and increases the TBR and CNR in these areas. This study has provided the first verification of the quantitative advantage of MC cardiac PET/MR in a realistic patient group. Further technical development of the methodology is now warranted and additional patient studies are now required to assess its clinical impact.
Acknowledgments
This work was supported by National Institutes of Health grant R01 HL071021.