
Abstract
The non-invasive quantification of human tissue fat fraction using easily scalable and accessible imaging technologies is crucial for the diagnosis of many diseases including liver steatosis. Here, we propose a non-invasive quantification of fat content using a highly accessible ultrasonic imaging technology. Ultrasonic echoes backscattered from human liver tissues are recombined to synthetize echoes of a virtual point-like reflector within the organs. This virtual point-like reflector is an ultrasonic analogue of artificial stars generated by laser beams in the field of astronomy, which are used to estimate the aberrations induced in the propagation medium. Here, the ultrasonic echoes from the point-like reflector provide an estimate of the Green's function relating the ultrasonic array and the reflector location and consequently represent a measurement of the aberrations induced along the ultrasonic beam travel path. Maximizing the spatial coherence of echoes backscattered from this targeted region provides an estimate of the acoustic sound speed while iteratively making the reflector more echogenic. The acoustic sound speed is dependent of the organ fat content, and we derive and cross-validate a theoretical equation relating acoustic sound speed and fat content both in phantom experiments and humans. An ultrasound-based fat fraction was found to be highly correlated with the oil paraffin concentration (R2 = 0.985) in phantoms and well correlated with the gold standard magnetic resonance imaging proton density fat fraction measurements (R2 = 0.73) in patients.
Export citation and abstract BibTeX RIS

Original content from this work may be used under the terms of the Creative Commons Attribution 3.0 licence. Any further distribution of this work must maintain attribution to the author(s) and the title of the work, journal citation and DOI.
1. Introduction
Hepatic steatosis is the most common manifestation of non-alcoholic fatty liver disease (NAFLD) and refers to the accumulation of fat within hepatocytes. In the fast growing population of patients with metabolic risk factors, the diagnosis of hepatic steatosis is extremely important as it guides patient management (Younossi et al 2016). In the last decade, ultrasound imaging has been proven to be highly reliable in estimating liver tissue stiffness, which is strongly correlated with liver fibrosis. Several non-invasive approaches, such as transient elastography (Sandrin et al 2003, Castera et al 2005), shear wave elastography (Bavu et al 2011, Ferraioli et al 2014, Deffieux et al 2015, Tapper and Loomba 2018) and acoustic radiation force impulse (Palmeri et al 2008), are able to provide an accurate staging of liver fibrosis. However, they are not sufficient for a quantitative diagnosis of NAFLD. Magnetic resonance imaging proton density fat fraction (MRI-PDFF) has been shown to outperform liver biopsy regarding the ability to quantify fat content and thus liver steatosis (Fishbein et al 2005, Bohte et al 2011). However, this is counterbalanced with its low accessibility and high cost. One other approach, electrical impedance tomography, was presented to detect the liver lipid content and presented promising results in rabbits (Luo et al 2018). Regarding ultrasound imaging, Deffieux et al investigated a potential link between shear wave viscosity and liver steatosis (Deffieux et al 2015); however, clinical results demonstrated a predominant correlation between shear wave viscosity and fibrosis.
Basic liver steatosis assessment based on the assumption that the liver appears brighter on conventional ultrasound scanner has been shown to have poor sensitivity, especially for low-grade steatosis, and to have high operator dependence (Mehta et al 2008, Dasarathy et al 2009). Researchers also investigated the hepatic attenuation rate from ultrasound hepatic and right kidney images (Xia et al 2012). However, such qualitative approaches are difficult to standardize among different constructors.
Suzuki et al demonstrated that the ultrasonic attenuation is dependent on fat infiltration of the liver (Suzuki et al 1992). Sasso et al used these findings to develop an attenuation parameter based on the ultrasonic properties of the radiofrequency backpropagated signal, called the controlled attenuation parameter (CAP) (Sasso et al 2010). Using the Fibroscan® device, ultrasonic attenuation (CAP) was qualitatively estimated in different patient populations and showed a good correlation with steatosis grading (Karlas et al 2017). Although ultrasonic attenuation is not an intrinsic property of the medium (because it originates from both ultrasonic diffraction and absorption), CAP provides an efficient grading of steatosis severity. Recently, Han et al also measured the attenuation coefficient and backscatter coefficient in human liver with an ultrasound scanner (Han et al 2018). For ultrasound-based sound speed measurement, Jaeger and Frenz (2015) proposed to measure the changing local phase of beamformed echoes when changing the transmit beam steering angle.
However, to date, current ultrasonic techniques do not allow for fat liver quantification. In such an attempt, Imbault et al proposed an ultrasonic method based on sound speed estimation (SSE) in the liver (Imbault et al 2017). This approach estimates the sound speed value by maximizing the spatial coherence of backscattered signals coming from a virtual focal spot. Similarly to the process of laser guide beams generating artificial stars in astronomy (Fugate et al 1991), we use this ultrasonic point-like reflector both to correct the aberrations induced by organ heterogeneities on the ultrasonic beam and to estimate the acoustic sound speed while making this ultrasonic star iteratively brighter. The sound speed mean value is assessed by maximizing the spatial coherence on backscattered echoes coming from the targeted region. Contrary to the speed of light, which is known to be constant in space, the sound speed in organs depends on the material properties, including, but not limited to, the fat content. Thus, acoustic SSE could provide information on the fat content.
This SSE method was tested during a preliminary clinical study on 20 patients, and SSE was shown to provide a high correlation (R2 = 0.69) between acoustic sound speed and fat content estimated by MRI-PDFF (Imbault et al 2017). It was also tested on two cohorts of 50 patients (Dioguardi Burgio et al 2018), and this quantitative method was able to grade hepatic steatosis in a continuous scale using SSE.
Here, we further demonstrate a direct and theoretical relationship between the acoustic sound speed and the fat fraction, and we corroborate these findings with phantom experiments and with a clinical investigation. This theoretical relationship gives access to the liver fat fraction using SSE. The proposed theory is confirmed by experimental results derived from phantoms characterized by various fat contents, as well as in vivo in a cohort of 100 patients combining MRI-PDFF and ultrasonic SSE.
2. Theoretical link between ultrasonic sound speed and fat fraction
In a homogeneous medium (HM), the relationship between the local acoustic sound speed ( ), bulk modulus (
 ) and density (
 ) is given by the Newton–Laplace equation:

When liver becomes steatotic, it progressively transforms into a biphasic medium made of a mix of liver tissue and fat cells (figure 1). As acoustic sound speeds in fat and hepatic parenchyma are strongly different (respectively 1450 m s−1 and 1600 m s−1), the average sound speed in the liver is related to the corresponding fat fraction  .
.

Figure 1. Fatty liver modelled as a biphasic medium. On the left is a human fatty liver histological section. On the right is a diagram presenting how a fatty liver can be seen as a biphasic medium.  and
and  characterize the liver cells;
  and
and  characterize the fat cells.
Download figure:
Standard image High-resolution imageAs the size of fat heterogeneities can be considered as smaller than the ultrasonic wavelength (typically 650 µm at conventional 2.5 MHz frequency), it is possible to consider this biphasic fat + tissue medium as a homogeneous effective medium for acoustic parameters. Consequently, we can derive a similar relation for the sound speed  in such a biphasic medium, here characterized by its fat fraction
  , with homogenized (effective) density
  and bulk modulus
  . The effective density is, by definition, the density of the biphasic medium (the ratio between its mass and its volume), which can be written as:

where  is the fat fraction in the liver and
  and
and  are respectively the densities of the fat and liver (see figure 1). Similarly, the effective bulk modulus
  is related to fat and liver bulk moduli according to Wood (1930):

where  is the fat fraction in the liver and
  and
and  are respectively the fat and the liver bulk moduli (see figure 1). An analogy with springs makes it easy to understand why we used the inverse bulk modulus. From the point of view of the propagating ultrasonic wave, the biphasic medium is similar to a succession of springs in series, with a bulk modulus
  or
or  , depending on the traversed medium. Inverse bulk moduli are summed to obtain the equivalent inverse bulk modulus.
Using the resulting effective density and bulk modulus, the theoretical acoustic sound speed in the medium can be expressed according to Wood's equation (Wood 1930):

where  is the unknown fat fraction in the liver,
  and
and  are respectively the fat and the liver bulk modulus, and
  and
and  are respectively the fat and liver density.
  ,
,  ,
,  and
and  are known physical values and define the extreme minimal and maximal acoustic speed values, respectively cf and cl. After developing the Wood's equation, we obtain the effective sound speed of the patient liver (
 ) as a function of the fat fraction (
 :
:

Inversely, the fat fraction  can be reversely linked to sound speed (
 ) using the following equation:
Finally, equation (6) can be rewritten under a simplified form:
Where  ,
,  and
and  are constant parameters defined by constant and fixed physical values:
Thus, in our investigations, the fat fraction measured by ultrasound  was obtained using the ultrasonic estimates of ceff in equation (5). This fat fraction was then compared to
  derived from the MRI measurements. Indeed, Idilman and colleagues previously identified (Idilman et al 2013) that the fat fraction obtained with histopathological analysis was approximately equivalent to twice the MRI-PDFF value. We therefore used
  as an estimate of the real fat fraction using MRI-PDFF.
The goal of our work was to verify the ability of ultrasound-based SSE to provide fat fraction  quantification based on the theoretical equation (6) both in phantom experiments and in vivo investigations.
3. Methods
3.1. Ultrasound acquisitions
Acquisitions were performed using an ultrafast research scanner with fully programmable and dedicated sequences (Aixplorer, SuperSonic Imagine, Aix en Provence, France). The experimental setup was composed of an ultrasonic array made of 192 piezoelectric elements (abdominal curved probe XC 6-1, Supersonic Imagine, Aix-en-Provence, France).
Ultrasonic sequences correspond to ultrafast transmission of Hadamard encoding signals as described in Imbault et al (2017). An ultrafast sequence consisted of the repetition of the transmission of 128 waveforms using 128 central elements of the probe. In reception, all 192 elements of the probe were used. Spatiotemporal encoding allowed virtual focusing in post-treatment by recombining the radio frequency (RF) data from the different transmissions. The total acquisition lasts 2 s and post-treatment for SSE calculation is performed in 4 min.
3.2. Signal processing for ultrasonic star formation and SSE
The estimation of the acoustic sound speed in the liver is based on the estimation of the spatial coherence function of backscattered RF signals coming from a chosen focal region. As there is no focus performed in transmit, the focusing process is performed by a synthetic summation of backscattered signals coming from different tilted plane waves transmission. This consists of a virtual transmit focusing using coherent compounding of Hadamard transmitted signals. This virtual transmit focusing is performed using time delay laws for different choices of acoustic sound speeds ranging from 1450 m s−1 (pure fat) to 1650 m s−1. Because the scatterers in the focal spot are a random distribution of scatterers that are much smaller than the wavelength (Rayleigh Scatterers), the spatial coherence function of the backscattered signals is a triangle function in application of the Van Cittert Zernike theorem (Mallart and Fink 1994). The area under the curve becomes maximal when the acoustic sound speed chosen for the beamforming process corresponds to the acoustic sound speed of the medium (see figure 2).

Figure 2. Description of the post processing method based on iterative adaptive focusing and acoustic SSE. (a) estimation and correction of average acoustic sound speed by optimizing the spatial coherence of backscattered echoes independently for multiple focuses, (b) steering of received focus beams towards a single spot, (c) virtual point source generation using rephasing and coherent summation of signals, (d) aberration correction using adapted time delays.
Download figure:
Standard image High-resolution imageNevertheless, the application of the Van Cittert Zernike requires a narrow focal spot to provide an optimal estimation of the acoustic sound speed. This is the case in phantom experiments as this medium can be considered to be homogeneous. In clinical investigations, this assumption is valid in a large subset of the patient population but becomes invalid in difficult patients where the intercostal space introduces aberrations along the travel path (Flax and O'Donnell 1988). For this reason, an adaptive focusing technique based on virtual time reversal focusing is introduced to iteratively correct the aberrations induced by near field layers (Montaldo et al 2011).
The whole process is based on the iterative succession of optimal acoustic SSEs using the area under the curve of the spatial coherence function of backscattered signals (Dahl et al 2011, Lediju et al 2011) and adaptive focusing corrections to progressively narrow the ultrasonic beam (see figure 2(c)). For a detailed description of the algorithm, the reader is invited to refer to Imbault et al (2017).
3.3. Phantom experiments
Fourteen agar-gelatin phantoms were made with different percentages of oil ranging from 0% to 100% (see table 1). Measurements of the acoustic sound speed were performed at a temperature of 13 °C using the ultrasound acquisition described in Imbault et al (2017) and with the ultrasonic probe placed directly on top of the phantom. During the ultrasound acquisition, the probe was held by an articulated arm. Raw data were then processed using MATLAB software (The MathWorks, Inc., Natick, Massachusetts, United States) to calculate SSE in the agar-gelatin phantoms considered as a HM.
Table 1. (N = 14) Agar-gelatin-oil phantoms content with increasing fat fraction and the corresponding estimation of its acoustic sound speed.
| Oil percentage | 0% | 5% | 10% | 15% | 20% | 25% | 30% | 35% | 40% | 45% | 50% | 55% | 60% | 100% |
| Paraffin oil [g] | 0 | 50 | 100 | 150 | 200 | 250 | 300 | 350 | 400 | 450 | 500 | 550 | 600 | 500 |
| Detergent [g] | 0 | 10 | 20 | 30 | 40 | 50 | 60 | 70 | 80 | 90 | 100 | 110 | 120 | 100 |
| Gelatin [g] | 70 | 65.8 | 61.6 | 57.4 | 53.2 | 49 | 44.8 | 40.6 | 36.4 | 32.2 | 28 | 23.8 | 19.2 | 0 |
| Alcohol [g] | 140 | 131.6 | 123.2 | 114.8 | 106.4 | 98 | 89.6 | 81.2 | 72.8 | 64.4 | 56 | 47.6 | 39.2 | 0 |
| Agar [g] | 20 | 18.8 | 17.6 | 16.4 | 15.2 | 14 | 12.8 | 11.6 | 10.4 | 9.2 | 8 | 6.8 | 5.6 | 5 |
| Water [g] | 770 | 723.8 | 677.8 | 631.4 | 585.2 | 539 | 492.8 | 446.6 | 400.4 | 354.2 | 308 | 261.8 | 215.4 | 0 |
| SSE [m s−1] @13 °C | 1579 | 1570 | 1560 | 1546 | 1537 | 1537 | 1532 | 1525 | 1522 | 1519 | 1512 | 1510 | 1505 | 1483 |
| Std [m s−1] | 2.0 | 3.0 | 3.2 | 3.1 | 1.9 | 4.1 | 1.8 | 3.9 | 2.4 | 3.0 | 3.5 | 4.2 | 3.7 | 2.4 |
Model phantoms were used to pattern the evolution of the fat percentage in liver. A first phantom was made out of gelatin, water, isopropyl alcohol, agar, neutral detergent and paraffin oil. This gave an echogenic reference phantom for the non-fat phase. To mimic fat in liver, paraffin oil and detergent with a mass ratio of 0.2 were added to the recipe. Fourteen phantoms of different fat fractions were so used in the experiments. The proportions for each phantom, from 0% to 100% fat fractions, are displayed in table 1.
3.4. Patient selection and clinical validation
The objective of the clinical study was to assess the feasibility and reliability of ultrasonic SSE to quantify liver fat fraction. Estimations were compared with the MRI-PDFF measurements considered as the gold standard. For this purpose, a clinical investigation was performed between January 2016 and March 2016 on 100 patients in the Radiology Department at Beaujon Hospital (Clichy, France). The study was approved by the local institutional review board and ethics committee (Comité de Protection des Personnes 'Ile-de-France VI—Pitié Salpêtrière' session on 25 June 2015) and strictly complied with the ethical principles for medical research involving human subjects of the World Medical Association Declaration of Helsinki. Written consent was obtained for all patients.
Patients with scheduled liver MRI were asked on the same day to undergo both a conventional ultrasound exam and the SSE ultrasonic sequence.
3.5. Ultrasound SSE and MRI-PDFF registration
Conventional US was first performed to position the abdominal curved probe (SC6-1) driven by an ultrafast scanner (Aixplorer®, Supersonic Imagine, France) in the right subcostal view and to ensure that the hepatic capsule was parallel to the US probe. The SSE ultrasonic sequence was then performed while avoiding the presence of large hepatic vessels or large US artifacts in the image (figure 3(a)). The 2 s ultrasound acquisition sequence was then performed during neutral respiratory apnea. The focal spot used to estimate the spatial coherence function was located at 60 mm depth, at the focal elevation depth of the SC6-1 probe. The spatial coherence function of backscattered signals coming from the focal spot was calculated for different values of the liver acoustic sound speed (figures 3(b) and (c)). The optimal sound speed corresponding to the maximal area under the curve of the spatial coherence function was then selected to perform the adaptive focusing procedure. The ultrasonic fat fraction was then deduced from the theoretical equation (7).
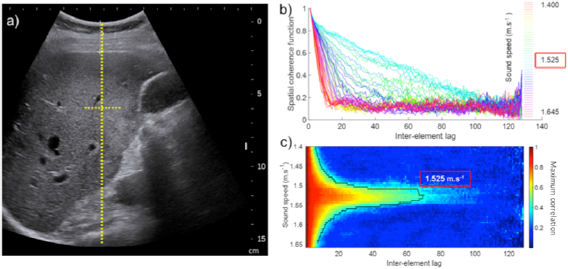
Figure 3. Example of in vivo acquisitions on a single patient: (a) ultrasound B mode image and focal spot located at the elevation focal depth z = 60 mm used for virtual transmit focusing, (b) spatial coherence function of backscattered signals from the focal spot estimated using different average sound speeds during the beamforming process of raw ultrasonic data. This shows the triangle shape of the coherence function at the optimal sound speed, (c) same as (b), in a 2D colormap representation highlighting the largest triangle shape obtained for the optimal selection of sound speed as predicted by the Van Cittert Zernike theorem. The blue curve is one ISO-value, i.e. a curve of constant maximum correlation value (0.3) for each sound speed. The sound speed characterizing the medium ensures the highest lag for a given maximum correlation.
Download figure:
Standard image High-resolution imageAn abdominal liver MRI session was performed on each patient on the same day (3 T Philips Ingenia, Eindhoven, Netherlands). Hepatic PDFF was obtained for each patient using a T1 weighted gradient echo dedicated sequence developed by the manufacturer (mDixon Quant—Philips Ingenia, Eindhoven, Netherlands). A large region of interest (ROI) free of large vessels and free of focal hepatic lesions was drawn by the radiologist in the right hepatic lobe. Our reference fat fraction was obtained using twice the MRI-PDFF (%), following Idilman et al (2013), to estimate the anatomopathologic fat fraction:  .
.
4. Results
Ultrafast acquisitions were performed in fourteen different phantoms with different fat contents. The SSE algorithm was performed using the backscattered echoes, and the results are presented in table 1. The estimation of the acoustic sound speed was found to be precise with a mean standard deviation of 3 m s−1 ± 0.8 m s−1. The acoustic sound speed was found to range between 1579 m s−1 ± 2 m s−1 and 1483 ± 2.4 m s−1. The extreme lowest SSE value in the 100% oil phantom in our study was found to nicely correspond to the sound speed in oil reported in the literature (Oliveira et al 2016) (respectively 1483 ± 2.4 m s−1 and 1485 m s−1 ± 5 m s−1). The extreme highest SSE value with 0% paraffin oil phantom in our study was also found to nicely correspond to the acoustic sound speed in agar-gelatin phantoms (without oil and with a 14% alcohol concentration) provided in the literature (Madsen et al 1981) (respectively 1579 m s−1 and 1575 m s−1).
The sound speed was also found to decrease following an inverse square root function. The theoretical prediction based on equation (5) was plotted on the same graph (figure 4(b)) using the known physical values from the literature for oil and gelatin components (respectively  = 900 kg m−3 and
  = 1000 kg m−3 for densities, as well as
  = 1.97 GPa (corresponding to the sound speed in fat cf = 1480 m s−1) and
  = 2.5 GPa (corresponding to sound speed in gelatin cl = 1585 m s−1) for bulk moduli. The agreement between the ultrasonic fat fraction and the oil percentage is presented in figure 4(c). The concordance between the ultrasonic fat fraction estimation and the true oil content was excellent. The Bland Altman analysis between the ultrasonic fat fraction and the oil concentration gives an arithmetic mean difference of 26.7% and a 95% confidence interval of the mean difference ranging between −3.23% and 56.61%.

Figure 4. Fat fraction quantification in agar-gelatin-paraffin phantom: (a) Microscopy images of phantom content for different paraffin-oil concentrations depicting the increasing number and concentration of fat bubbles. (b) Quantitative estimation of the acoustic sound speed in the successive phantoms with different oil concentrations. (c) Quantitative ultrasound fat fraction estimated in the 14 different phantoms based on the acoustic theory as a function of their paraffin oil concentration.
Download figure:
Standard image High-resolution imageThe method was then applied clinically for hepatic fat fraction estimation in a group of N = 100 patients with a mean age of 57 years (25 to 85 years old), a mean weight of 72.4 ± 14.7 kg and a mean body mass index (BMI) of 25.1 ± 5.5 kg m−2. Among the 100 patients, 12 had a BMI higher than 30 kg m−2, for 42 patients the BMI was between 25 and 30 kg m−2, and for 46 patients the BMI was under 25 kg m−2. According to their MRI-PDFF (%), patients from no steatosis (S0) to severe steatosis (S3) exhibited different fat contents, which increased with the steatosis grade. Among the 100 patients, 70 were grade S0, 23 were grade S1, one was grade S2, six were grade S3, and 28 had cirrhosis (stage 4 fibrosis).
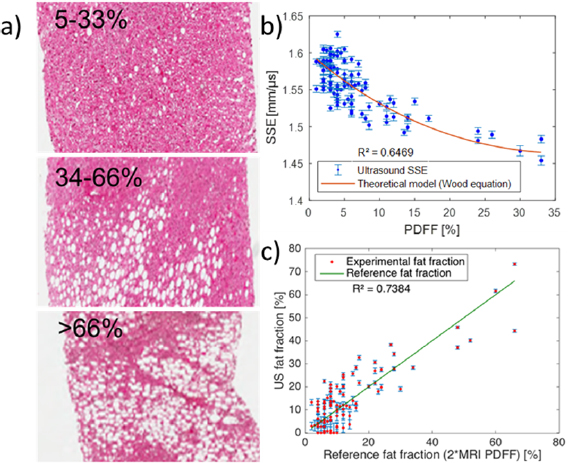
For the 100 patients, the estimated acoustic sound speeds ranged from 1450 m s−1 to 1625 m s−1. To illustrate the increasing number of hepatocytes with triglyceride accumulation along with steatosis grade and the accompanying range of sound speeds, one example with three different patient biopsies is presented in figure 5(a). For each patient, the relationship between SSE values obtained using ultrasound and the fat fraction obtained from MRI-PDFF was compared to the theoretical equation (5). The theoretical prediction based on equation (5) was plotted on the same graph (figure 5(b)) using known physical values from the literature for fat and healthy liver densities (respectively  = 800 kg m−3 and
  = 1000 kg m−3,
  corresponding to the smallest density value recorded for a fatty liver (Goumard et al 2014)). For non-fatty healthy liver, tissue density
  in the absence of fat corresponds to an upper limit density value recorded for healthy liver (Yu et al 2004, Goumard et al 2014).
  and
and  were chosen as
  = 1.97 GPa (corresponding to the sound speed in fat cf = 1480 m s−1) and
  = 2.5 GPa (corresponding to the mean sound speed for healthy livers cl = 1600 m s−1). Some patients (N = 6) exhibited acoustic sound speeds higher than 1600 m s−1, and consequently the ultrasonic fat fraction was set to zero.
Figure 5. Clinical quantification of fat fraction in patients using ultrasound. (a) Histology images of biopsied tissue from three different patients with mild (macroscopic steatosis in 5% to 33% of hepatocytes) to severe (macroscopic steatosis in more than 66% of hepatocytes) steatosis. One clearly notices the increasing number of hepatocytes with triglyceride accumulation. (b) Quantitative estimation of the acoustic sound speed in N = 100 patients. (c) Quantitative ultrasound fat fraction using adaptive SSE compared to the reference fat fraction (2 * MRI PDFF).
Download figure:
Standard image High-resolution image
Again, the measurements were found to be in good agreement (R2 = 0.65) with the theoretical curve (figure 5(b)). Using equation (7) applied to SSE estimates, the ultrasonic fat fraction was found to be in good agreement (R2 = 0.74) with the fat fraction deduced from MRI-PDFF (figure 5(c)). The Bland Altman analysis between ultrasonic fat fraction and the MRI fat fraction gives an arithmetic mean difference of ± 41.8% and a 95% confidence interval of the mean difference ranging between 22.9% and 60.6%.
5. Discussion
The modelling of human liver as a biphasic organ containing both tissue and small fat containers that are smaller than the acoustic wavelength enables us to consider liver material as an effective medium with acoustic properties that are related to the fat fraction. Based on Wood's equation, a direct theoretical relationship was proposed between the fat fraction and the acoustic sound speed. This theoretical relationship was validated both in phantoms and in clinical study.
The application of the Van Cittert–Zernike theorem applied to ultrasonic echoes backscattered from tissues enables us to estimate the acoustic sound speed of the medium. This approach is reliable in HM but is degraded in more complex media such as the human liver where sound speed heterogeneities in the intercostal space create ultrasonic aberrations and degrade the ultrasonic focusing quality, which is mandatory for optimal SSE. We proposed an adaptive SSE based on the iterative improvement of aberration correction to access SSE despite the presence of aberration layers. Here, we demonstrated that this acoustic SSE provides information on the fat fraction thanks to the acoustic wave theory. Importantly, this fat fraction estimation is based on the measurement of an intrinsic physical parameter of liver tissues and not on a tissue-related parameter such as attenuation or brightness.
Experiments performed in N = 14 agar-gelatin phantoms with increasing oil concentration were validated our approach. Further application of this method in the clinical practice on N = 100 patients proved the ability of ultrasound imaging to quantify the liver fat content. The ultrasonic fat fraction was found to be in good agreement with the fat fraction estimated from the gold standard MRI-PDFF. One should note that the performance of the SSE method is lower in vivo compared to phantom experiments. This reduced performance is due to the influence of the intercostal aberrating layers, which we do not perfectly correct. First, the deviation from the model observed in the patient cohort compared to the phantom can be partly explained by a local increase in superficial reflection. This may be solved by adding ultrasound gel or with transducer repositioning. As the SSE measurement is a research tool, SSE values were calculated off-site for this preliminary study. As a consequence, physicians who performed the US examination had no access to the data quality for estimating SSE during the clinical exam. Further technological implementation of this method will provide onsite control of signal quality allowing repeating acquisition in cases of poor signal quality. Second, the operator-dependent selection of the intercostal layer thickness used in the estimation of the liver sound speed can also lead to errors and could be automated in future studies.
These results represent a first proof of concept and will lead to further investigations on a larger cohort. There remain several limitations. Firstly, the selected patient population did not include very large BMI patients where we expect the estimation to be more difficult to perform. Furthermore, as our population was randomly sampled, only a few patients with severe steatosis were available in the study. Although cirrhosis strongly affects liver stiffness, it was not found to be a confounding factor in this preliminary study. Nevertheless, the precise influence of the different stages of fibrosis content in tissue on the final acoustic sound speed should be further studied in more detail.
The potential ability of ultrasound to not only stage but also quantify liver fat content could have important implications for the diagnosis of steatosis. These results present a first attempt to estimate a physical variable (acoustic sound speed) that is intrinsically linked to the fat content. Beyond this preliminary proof of concept, the SSE method should be further improved to upgrade the standard deviation of SSEs with respect to the physical theory if we wish to perform an accurate estimation compatible with a robust quantification of liver fat fraction. Achieving such fat fraction quantification using an imaging modality that is much more accessible than MRI for liver patient screening could represent an important step. The possibility of combining it with shear wave elastography for the non-invasive quantification of both liver fibrosis and steatosis with ultrasound is another advantage of this highly accessible modality.
Acknowledgments
This work was supported by the Agence Nationale de la Recherche under the program 'Future Investments' with the reference ANR-10-EQPX-15 and by LABEX WIFI (Laboratory of Excellence ANR-10-LABX-24) and the French Program 'Investments for the Future' under reference ANR-10- IDEX-0001-02 PSL*. This work was also supported by the European Research Council under the European Union's Seventh Framework Program (FP7/2007-2013)/ERC Advanced grant agreement no. 339244-FUSIMAGINE).