
Abstract
Until now, the dosimetry of carbon ions with ionization chambers has not reached the same level of accuracy as that of high-energy photons. This is mainly caused by the approximately threefold larger uncertainty of the kQ factor of ionization chambers, which, due to the lack of experimental data, is still derived by calculations. Measurements of absorbed dose to water, Dw, by means of water calorimetry have now been performed in the entrance channel of a scanned 6 cm × 6 cm radiation field of 429 MeV/u carbon ions, allowing the direct calibration of ionization chambers and thus the experimental determination of kQ. Within this work, values for kQ have been determined for the Farmer-type ionization chambers FC65-G and TM30013. A detailed investigation of the radiation field enabled the accurate determination of correction factors needed for both calorimetric and ionometric measurements. Finally, a relative standard measurement uncertainty of 0.8% (k = 1) could be achieved for the experimental kQ values.
For both chambers, the experimental kQ factors were found to be about 1% larger than those tabulated in the German DIN 6801-1 protocol, whereas compared to the theoretical values stated in the TRS-398 protocol, the experimental kQ value agrees within 0.4% for the TM30013 chamber but is about 1% lower in the case of the FC65-G chamber.
Export citation and abstract BibTeX RIS

Original content from this work may be used under the terms of the Creative Commons Attribution 3.0 licence. Any further distribution of this work must maintain attribution to the author(s) and the title of the work, journal citation and DOI.
1. Introduction
Radiation therapy with carbon ions began more than 20 years ago in the first clinical facility at the Heavy Ion Medical Accelerator (HIMAC) in Chiba, Japan. Although more than 19 000 (1994–2015) patients have been treated (PTCOG 2017), the dosimetry of ion beams to date has not reached the same level of accuracy as that of conventional high-energy photon or electron beams. While the standard measurement uncertainty assigned to the clinical reference dosimetry of high-energy photons by means of calibrated ionization chambers (ICs) is stated with about 1% in several national and international dosimetry protocols (Andreo et al 2006, Aalbers et al 2012, McEwen et al 2014), the corresponding uncertainty related to the dosimetry of ions is still higher by about a factor of two in the case of proton beams or a factor of three in the case of carbon beams (Andreo et al 2006).
This larger uncertainty is mainly caused by the uncertainty of the calculated kQ factor. This factor accounts for the different response of the IC exposed to the actual user beam quality Q compared to the reference beam quality Q0 used for calibration in terms of absorbed dose to water.
In general, the following expression as for example given in the International Code of Practice for the Dosimetry of External Radiotherapy Beams TRS-398 (Andreo et al 2006) can be used to calculate the kQ factor:

Here, sw,air is the water-to-air stopping power ratio, Wair is the mean energy expended in air per ion pair formed and p is the perturbation factor taking into account the departures from the ideal Bragg–Gray conditions. For ion beams, the overall uncertainty of calculated kQ factors is mainly determined by the uncertainties for the values of (sw,air)Q and (Wair)Q ranging both between 1% and 2% (Andreo et al 2006, DIN 2016, ICRU 2016). Based on appropriate absorbed dose standards, a direct measurement of kQ by calibrating the IC at the actual beam quality Q avoids the consideration of the different components in equation (1) and their uncertainties.
With respect to high-energy photon or electron radiation, numerous detailed investigations have yielded consistent data on experimental as well as calculated kQ factors with recently published standard uncertainties going down to about 0.4% (e.g. Cojocaru et al 2011, Muir et al 2011, Krauss and Kapsch 2014, Muir and Rogers 2014, Renaud et al 2015). For ion beams in general, however, there is still a lack of experimental data with low standard uncertainties. This is due to the fact that primary standards for the direct calibration of ICs in ion beams, and thus for the experimental determination of kQ, do not exist yet. Clearly, there is the need to broaden the data basis on kQ factors in ion beams and to consider these data in upcoming clinical dosimetry protocols.
Few experimental efforts to determine absorbed dose to water, Dw,Q, or kQ factors for ICs have been made so far in passively scattered and actively scanned proton beams using water calorimetry (e.g. Siebers et al 1995, Palmans et al 1996, Vatnitsky et al 1996, Brede et al 2006, Medin et al 2006, Medin 2010, Sarfehnia et al 2010, Renaud et al 2016). For example, experimental kQ factors for a NE 2571 IC with standard uncertainties between 0.7% and 1.3% have been determined in a scattered and in a scanned proton beam (Medin et al 2006, Medin 2010). Furthermore, Monte-Carlo calculated kQ factors for several ICs in monoenergetic proton beams were published very recently by Gomà et al (2016) showing agreement with the mentioned experimental values within about 1%. With respect to carbon ion beams, however, even less work has been performed so far. The most recent work was carried out by Sakama et al (2009) and Rossomme et al (2014), who both used graphite calorimetry for the absolute determination of absorbed dose to water, Dw,Q, and who concentrated on the experimental determination of the (Wair)Q value rather than the determination of kQ factors.
In the present work, water calorimetry is implemented in the entrance channel of a 429 MeV/u scanned carbon ion beam at the Heidelberg Ion-Beam Therapy Center (HIT). The aim of this work is to experimentally determine the kQ factor for two Farmer-type ICs and to significantly decrease the uncertainty of IC-based dosimetry of clinical ion beams. Therefore, the detailed characterization of the irradiation parameters and the resulting radiation field are of major importance as they strongly influence several calorimetric and ionometric correction factors and thus directly affect the overall achievable measurement uncertainty.
2. Material and methods
2.1. Beam delivery at HIT
All calorimetric and IC measurements were performed at HIT, which relies on the intensity-controlled raster scanning method (Haberer et al 1993). Due to the synchrotron-based beam delivery, the irradiation has a pulsed structure with beam-on and beam-off times, where new particles are accelerated to the requested energy, of both about 5 s.
The beam delivery is controlled by a beam application monitoring system (BAMS) by Siemens, which is based on the original design from the Helmholzzentrum für Schwerionenforschung GSI, Darmstadt, Germany (Haberer et al 1993, Kraft and Weber 2011). It features a redundant system of three identical large area ICs regulating the number of particles delivered per irradiation spot, which are framed by two multi-wire proportional chambers (MWPCs) controlling the beam position. The time-resolved measurements of the MWPCs as well as the ICs containing all the irradiation-relevant information such as e.g. beam position, beam width, irradiation duration, and number of delivered particles per spot are recorded for each irradiation within the irradiation records.
2.2. Irradiation parameters
For the kQ measurements, an irradiation plan has been used which nominally should ensure that the irradiation field dependent correction factors for the water calorimeter (e.g. heat conduction corrections) are as small as possible. In summary, a field size of about 5.8 cm × 5.8 cm (realized by 26 × 26 spots with 2.3 mm spacing on a rectangular grid) was chosen and optimized for homogeneity as well as reproducibility by performing a re-painting (figure 1). A pencil beam of about 5.5 mm full width at half maximum (FWHM) was selected, as the corresponding intensity distribution shows the best symmetry (figure 2) which is also beneficial in terms of heat conduction calculations (section 2.4.1). To enable a preferably short irradiation time, the highest clinically used particle flux of 8 × 10⁷ ions per second was chosen, resulting in an irradiation time per spot of about 32 ms and of about 95 s for the complete scan. In total, an absorbed dose to water of about 1.5 Gy was applied. In order to have a large distance between the calorimetric measurement position (at a nominal water depth of 50 mm) and the Bragg peak, an energy of 429 MeV/u was selected corresponding to a residual range Rres of 24.1 cm in water (Rres = Rp − d, with d being the measurement depth and Rp the practical range defined as the depth at which the absorbed dose beyond the Bragg peak decreases to 50% of its maximum value (Lühr et al 2011). The residual range is a measure of the radiation quality Q according to DIN 6801-1 (DIN 2016), while TRS 398 assumes Q to be energy-independent. As shown in figure 3, the corresponding depth dose distribution (ddd) is very flat around the calorimetric measurement position exhibiting a small relative dose gradient of −0.023% mm−1. As the precise knowledge of the irradiation parameters and the resulting dose distribution is essential for the evaluation of correction factors required for the Dw and subsequent kQ determination, corresponding measurements were directly performed at the measurement position of the water calorimeter and frequently repeated over the course of all kQ measurements. Hence, an experimental set-up was designed to mimic the real measurement conditions of the water calorimeter (including the phantom and the calorimetric detector) by means of a water-equivalent slab phantom (figure 4). The 2D IC array STARCHECK by PTW (Freiburg, Germany) consisting of 527 air-filled ICs (dimensions: 8 mm × 3 mm × 2.2 mm, max. spatial resolution: 3 mm) was used for the measurement of relative lateral dose profiles. To increase the spatial resolution, the STARCHECK array has been repositioned multiple times. Prior to its use at HIT, extensive measurements in the well-characterized 60Co irradiation field at PTB allowed a reduction of the relative absorbed dose to water calibration uncertainty for all of the array's chambers from 1% (as stated by the manufacturer) to 0.3%. Therefore, it is assumed that the relative response of the different detectors of the STARCHECK array is known within 0.3% also in the carbon beam. The long-term reproducibility of the beam delivery system has been monitored through frequent measurements with a thimble IC. The data showed that the beam delivery system at HIT in combination with the irradiation plan used enables very reproducible measurement conditions with a relative standard deviation of 0.3% found for the delivered dose at the central axis of the field over the course of all kQ measurements (7 months).

Figure 1. Spatial irradiation pattern consisting of 26 × 26 spots deposited on a rectangular grid with 2.3 mm spacing in both x and y direction. By irradiating the same raster pattern (i.e. again 26 × 26 spots) a second time but shifted by 1/2 × 2.3 mm in both x and y direction, the effective distance between adjacent raster spots is reduced to 1.6 mm.
Download figure:
Standard image High-resolution image
Figure 2. Left: result of a processed KODAK EDR2 (Extended Dose Range) film (Carestream Health Inc., Rochester, NY, USA) irradiated with a single carbon ion pencil beam behind the water-equivalent slap phantom. It was found that the relative dose profiles of the pencil beam (right image) can be well approximated by a superposition of two—in x- and y-direction–symmetric 2D Gaussian distributions with a mean ratio of 1.844 for the amplitudes and mean FWHMs of 4.31 mm (standard deviation: 0.06 mm) and 7.34 mm (standard deviation: 0.25 mm).
Download figure:
Standard image High-resolution image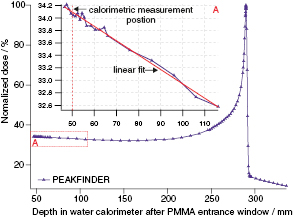
Figure 3. Depth dose distribution (ddd) measured behind the water-equivalent slab phantom using the PEAKFINDER water column by PTW (Freiburg, Germany). The zoomed insert emphasizes the flat ddd around the calorimetric measurement position at 50 mm depth showing a very small relative dose gradient of −0.023% mm−1.
Download figure:
Standard image High-resolution image
Figure 4. The figure shows the developed water-equivalent slab phantom mimicking the water calorimeter. In (a) the phantom is directly compared in size with the 'real' water calorimeter, while (b) schematically illustrates the exact composition of the phantom with all dimensions given as geometrical material thicknesses. In order to enable the combination of this slab phantom with different kinds of detectors (STARCHECK, PEAKFINDER, EDR2 film), the design of the phantom had to ensure 'dry' conditions at the effective measurement position of the water calorimeter. The very same materials as were used for the water calorimeter were also used for the slab phantom with the only exception of replacing liquid water by solid water (RW3, PTW, Germany) slabs of corresponding water-equivalent thickness (Jäkel et al 2001). With respect to the carbon ion energy used within this study, RW3 is in good agreement with water in terms of fragmentation processes (personal communication M Martisikova, DKFZ).
Download figure:
Standard image High-resolution image2.3. Set-up and operation of the water calorimeter
The PTB transportable water calorimeter is operated at a water temperature of 4 °C. Its design, temperature stabilization system and the detector measuring the radiation-induced temperature rise have been previously described in detail (e.g. Krauss et al 2012, Krauss 2006). Briefly, the radiation-induced temperature rise is measured by two calibrated thermistors each fused in the conically shaped tip of a glass pipette. The glass pipettes themselves are centrally arranged inside a water-filled (high-purity water saturated with hydrogen gas) thin-walled plane-parallel glass cylinder perpendicular to the cylinder axis, with the two thermistors facing each other having a distance of about 7 mm. The glass cylinder is positioned inside the water phantom with the cylinder axis oriented parallel to the beam direction. The measurement depth of the thermistors with respect to the beam entrance window of the water phantom is nominally set to 50 mm as schematically shown in figure 5. The spacing was frequently checked directly before and after each calorimetric beam time (BT). Small distance changes occurring due to a time-dependent bowing of the entrance window of the water phantom were found to be negligible.

Figure 5. Schematic illustration of the transportable PTB water calorimeter highlighting the materials passed by the radiation. The distances given refer to a nominal measuring depth of the thermistor probes of 50 mm with respect to the inner surface of the PMMA entrance window. The external air-filled large-area ionization chamber has been mounted in front of the water calorimeter to additionally monitor the beam stability during the irradiations. Please note that the schematic drawing is not true to scale for the sake of better illustration of thin materials.
Download figure:
Standard image High-resolution imageWithin this investigation, two calorimetric detectors (using the same type of glass cylinder and the same type of preparation) with slightly different spacings between the thermistors were used. Both detectors were employed in the primary standard water calorimeter at PTB in 60Co radiation in order to prove the response of the detectors just before and after their usage at HIT.
The resistance of each thermistor (about 10 kΩ at 4 °C) is independently determined within a separate 1.5 V DC-powered voltage divider circuit with the thermistor being one part of the voltage divider and a calibrated high-precision resistor with a well-known resistance value (nominally 20 kΩ) the second. This allows measuring the resistance of the thermistor with a resolution of better than 1 mΩ (Krauss and Kapsch 2014).
In total, three separate BTs were performed within a time period of 7 months, each comprising between 60 and 80 calorimetric measurements. Figure 6 shows a typical thermistor signal for a series of ten irradiations. For each irradiation, the separate measurement signals of both thermistors were analyzed by performing linear fits over the pre- and post-irradiation drift curves, extrapolating the fits to the mid-run position and taking the corresponding difference as the radiation-induced resistance change of the thermistor. Time intervals of 110 s for the pre- and post-irradiation drift curves, with the fit interval for the post-irradiation drift curve starting 10 s after the end of an irradiation, were applied (Krauss and Kapsch 2014). It was found that the standard uncertainty of the mean value for the relative resistance change during irradiation amounts to 0.15% for each calorimetric experiment.

Figure 6. (a) Typical calorimeter signal for 10 consecutive irradiations performed within one run with a break of about 3 min between two irradiations. After each run, the water calorimeter had to be reconditioned in order to remove radiation-induced temperature gradients in the water. The insert shows the enlarged temperature-dependent resistance change for one irradiation with the corresponding linear fits to the pre- and post-irradiation drift curves for the determination of ΔR. The step shown in the signal is due to the irradiation pattern (figure 1) consisting of two shifted rescans. The resulting ΔR/R values needed for the determination of Dw are shown in (b) for all 80 measurements performed with one of the two thermistors during the course of a calorimetric beam time.
Download figure:
Standard image High-resolution image2.4. Experimental determination of kQ factors
The basic definition of the kQ factor is given as the ratio of the chamber's absorbed dose to water calibration coefficients ND,w,Q at the radiation quality Q and ND,w,Co at the reference beam quality (here: 60Co):

The calibration coefficients ND,w,Co of the ICs used are traceable to PTB's primary standard water calorimeter operated in a 60Co beam under reference conditions (Krauss 2006). The calibration coefficients ND,w,Q with respect to the raster scanned carbon ion beam at HIT are determined by means of the transportable water calorimeter in a two-step procedure. First, the calorimeter is used to measure Dw,Q in a certain measurement depth z on the central axis of the irradiation field. Second, after heating the water to about 18 °C and replacing the calorimetric detector by an IC positioned with its reference point, Pref, at z, the reading MQ of the IC is directly measured in the water phantom of the calorimeter. Then, ND,w,Q is determined by the following equation:

Here, MQ is corrected for the influence quantities temperature and pressure, electrometer calibration, polarity effect and ion recombination. As the measurement of Dw,Q by means of water calorimetry is rather point-like, the volume correction factor kv is required to account for the volume-averaging effect of the IC to ensure comparable measurement conditions. kv depends on the lateral dose distribution and the volume of the IC.
It is important to note that the values of the experimentally determined kQ factors are not directly comparable with the theoretical kQ factors stated in TRS-398 (Andreo et al 2006) or DIN 6801-1 (DIN 2016), as the procedures described in the protocols regarding chamber positioning and consideration of the displacement effect differ from the above-mentioned experimental procedure. Following the protocols, Pref of the IC has to be positioned 0.75 · rcyl (rcyl: inner radius of the chamber in mm) deeper than z, while the common calibration procedure for the determination of ND,w,Co implies positioning Pref at z. Additionally, there is a difference between both protocols in the consideration of the displacement correction (as part of the perturbation factor  in equation (1)) for 60Co as reference beam quality. While in TRS-398 the displacement correction for 60Co is considered within the overall perturbation factor, DIN 6801-1 separately addresses this effect by introducing a further chamber-dependent correction factor kr. Thus, the experimental kQ values, referred to as
  in the following equations, have to be transformed into
  and
and  , respectively, in order to be comparable and applicable for reference dosimetry of ion beams according to DIN 6801-1 and TRS-398:


Here, δ12C is the relative depth dose gradient at z in the carbon ion field (figure 3) and kr is given by kr = (1 − 0.003 · rcyl)−1 and therefore amounts to kr = 1.0092 for both thimble ICs used (DIN 2016).
2.4.1. Calorimetric determination of Dw,Q in the carbon ion beam.
The principles of the calorimetric determination of Dw,Q have been described in full detail in e.g. Ross and Klassen (1996), Krauss (2006) and Seuntjens and Duane (2009). Briefly, the measured radiation-induced relative resistance change at the position of the thermistor of the calorimetric detector leads to a corresponding temperature rise ΔT which can be extracted by applying the thermistor's temperature calibration coefficient. Dw,Q at the central axis of the radiation field is then given by the following equation with cp being the specific heat capacity of water at a temperature of 4 °C and the k's being correction factors for several influence quantities:

As the calorimetric detector comprises two thermistors, Dw,Q has been obtained separately for each, taking into account position depend correction factors for each thermistor. The mean of both Dw,Q values has been taken as the final result of a calorimetric BT.
In the following, detailed information is given on the principal methods for the experimental and/or theoretical determination of the correction factors used in equation (6). Corresponding results for the main correction factors kl, kc and kP are presented in section 3.3.
The factor kh considers the correction for the so-called heat defect which is a possible deviation between the absorbed radiation energy and the energy which appears as heat. The heat defect is caused by chemical reactions triggered by the radiolysis of water together with potential additives or impurities in the water. For some aqueous systems, the heat defect can be calculated on the basis of a radiolysis model (e.g. Klassen and Ross 2002) allowing to compare the corresponding results on a relative basis with the results from water calorimeter experiments. For hydrogen-saturated water these calculations predict a stationary state for the products of the radiolysis after a small pre-irradiation dose, i.e. the heat defect is zero by definition. It was shown experimentally that this assumption of a zero heat defect is reasonable within a relative standard measurement uncertainty of 0.14% (Krauss 2006). Sassowsky and Pedroni (2005) performed model calculations of the radiolysis of water for radiation with higher linear energy transfer (LET). For the H2 system, they showed for proton radiation up to an LET of 25 keV µm−1 that the same stationary state with a zero heat defect occurs confirming the results obtained by Palmans et al (1996). As the radiolysis model for the H2 system predicts this stationary state for all irradiation conditions independent of the LET or type of the radiation, this result can also be taken to be valid for heavier ions within the investigated LET region. The carbon beam at HIT has a maximum LET of about 11.3 keV µm−1 at the calorimetric measurement position (section 3.2) and consequently, for the determination of Dw,Q by means of water calorimetry in the scanned carbon ion beam, the correction kh is taken to be 1.000 within a relative standard uncertainty of 0.14%. Before and after a detector was used in the carbon ion beam at HIT its response was proven in 60Co γ-radiation at PTB to be stable and to coincide with the expected response of a zero heat defect within 0.1%. This possible variation of the detector response has been considered also for the measurements in the carbon beam.
The factor kc corrects for the influence of heat transport effects on the determination of Dw and is typically investigated by heat transport calculations on the basis of the finite element method. In order to account for the heat conduction effects occurring during and after a calorimetric measurement, the real calorimetric measurement conditions need to be reproduced as precisely as possible within finite element calculations (here: COMSOL Multiphysics version 4.3a). For static irradiation fields this method is well established (e.g. Krauss 2006, Seuntjens and Duane 2009). However, for the raster scan pattern used in this investigation (figure 1) it was found to be not feasible to model the heat conduction effects of the entire irradiation field by computing the time-dependent temperature evolution of each of the 1352 raster spots with 32 ms irradiation time. Therefore, a computational model had to be developed which is based on the assumption that the total time-dependent temperature drift at a given measurement point can be calculated by the undisturbed superposition of the corresponding temperature drifts caused by each raster spot. Thus, the temperature evolution over a total time of 200 s of only a single pencil beam applied for 32 ms to the center of the water calorimeter was calculated within a rotational symmetric 2D model. The corresponding time and space dependent temperatures T(t, r) at the position z corresponding to the water depth of the calorimetric detector were recorded with 1 ms resolution in time and with 0.1 mm resolution in space for r = 0 to r = 60 mm. In principle, the temperatures T(t,r) are the same for each spot of the raster scan but a translation in space r and in time t according to the real spatial irradiation pattern and the real time structure used in the calorimetric measurement has to be considered. Then, the total temperature rise with respect to the measurement position of the thermistor probe can be simulated by superimposing the temperature drifts of each spot.
For the finite element calculations of the single pencil beam, the water phantom including the flat glass walls of the detector cylinder was approximated in a rotational symmetric 2D geometry model with the lateral dose distribution of the spot considered by a symmetric 2D Gaussian distribution (figure 2). The dose distribution in z-direction was taken from the measured ddd (figure 3).
Prior to its application, this kind of convolution model was validated in detail for different raster scan patterns comprising only a few pencil beams with different widths. By comparing the corresponding results with the results of full 3D heat conduction calculations, agreement within 0.2% was found. A very similar approach for the calculation of heat conduction effects in scanned ion beams as used here has been independently developed at the Dutch metrology institute VSL (Zavgorodnyaya 2015). It has been shown that this convolution model is suitable for both homogeneous and inhomogeneous irradiation fields realizing a fast and flexible method easily applicable to different scanning patterns.
The factor kl in equation (6) corrects the non-uniformity of the lateral dose distribution, which causes a difference between the value of Dw,Q measured off-axis with each thermistor of the calorimetric detector and the value of Dw,Q at the central axis of the radiation field. The position-dependent kl values can be evaluated either from the measured lateral dose profiles by interpolating the corresponding data to the individual thermistor position or from the calculated dose profiles using the modified raster spot positions and the measured pencil beam width (section 3.1).
The perturbation correction kP accounts for the change of the radiation field due to the presence of the calorimetric detector and has been determined experimentally by using a 'dummy detector' in combination with the thimble IC TM30013 (PTW). By turns, measurements have been performed with the IC placed inside the water phantom of the calorimeter with and without the surrounding 'dummy' glass cylinder. In total, 16 (11) measurements were performed without (with) the 'dummy detector'. Moreover, the radiation field perturbation factor has been verified via a Monte Carlo simulation (section 2.5) by comparing the dose deposition with and without the presence of the glass cylinder at the measurement position of the thermistor probes.
The correction kT accounts for the effect of the difference in the water temperature between the calorimetric measurements (4 °C) and the IC calibrations (about 18 °C). This correction must be applied to the calorimetrically determined value of Dw,Q in order to obtain its value at 18 °C. Depending on the difference in density between water of 4 °C and 18 °C and considering the very small depth dose gradient of −0.023% mm−1 at the measurement position of the water calorimeter, it was found that the kT values were generally very small. A value of kT = 0.9990 with a relative standard uncertainty of 0.01% was considered for the calorimetric Dw,Q determination.
A further correction ke was considered for the change in the thermistor's electrical power during an irradiation, as a change in the thermistor's electrical power also changes the difference between the thermistor temperature and the temperature of the surrounding water. Based on the set-up of the resistance measuring circuit as well as the thermal coupling between thermistor and water, ke was calculated to 1.0004.
2.4.2. IC measurements.
Within this investigation, ND,w,Q and thus the kQ factors for carbon ions have been determined for the two Farmer-type ICs FC65-G by IBA (Schwarzenbruck, Germany), and TM30013 by PTW (Freiburg, Germany) having a sensitive volume of 0.65 cm3 (height: 23 mm, diameter: 6.2 mm) and 0.60 cm3 (height: 23 mm, diameter: 6.1 mm), respectively. Prior to their use at HIT, ND,w,Co for both chambers has been determined in the 60Co reference field at PTB with a relative standard uncertainty of 0.25%.
The measurements with the thimble ICs at HIT were performed directly after the calorimetric measurements. After the water temperature in the phantom of the calorimeter had been increased to about 18 °C, the reference point of the IC was positioned at the same depth of water in the phantom of the calorimeter as the calorimetric detector during the calorimetric measurements. By using an ionometric measuring system developed by PTB, the IC charge, the water temperature inside the calorimeter phantom, and the ambient air pressure were recorded during the irradiation with a sample rate of 1 Hz, allowing continuous correction of the IC reading MQ for the influence of air temperature and pressure. Analogue to the analysis of the calorimetric measurement data, the integral radiation-induced charge has been determined by extrapolating the linear fits of the pre- and post-irradiation drift curves to the mid-run position. The chambers were operated at voltages of +300 V (FC65-G) and +400 V (TM30013), respectively. In total, 100 (90) measurements were performed with the FC65-G (TM30013) chamber over the course of all three BTs. The relative standard deviation of the measurements was found to be 0.3%, which is consistent with the observed long-term reproducibility of the irradiation conditions discussed in section 2.2. The required corrections for the saturation effect and for the polarity effect, ks and kp, were determined experimentally following the procedures described in DIN 6801-1.
The exact computation of the volume correction kv (equation (3)) would require both the knowledge of the dose response function of the IC, which is a measure of the chamber's ability for spatial resolution (Looe et al 2013, 2015), and the dose distribution itself. Extensive work has been recently carried out to measure dose response functions for commonly used ICs with respect to photon beams (e.g. Butler et al 2015, Ketelhut and Kapsch 2015 and references therein). However, this concept has not yet been transferred from the dosimetry of photon beams to the dosimetry of ion beams. On the other hand, it can be expected that in smoothly-varying dose distributions without steep dose gradients the method of simple spatial averaging over the cross-sectional area of the IC already provides a sound approximation for kv. Therefore, the lateral dose distribution has been numerically integrated over the cross-sectional area of the IC perpendicular to the beam axis without considering their real cylindrical form. The volume correction factor is then given by the ratio of the relative dose value at the position of the reference point of the chamber (located at the central axis) and the result of the integration. Thus, the method is based on the mean relative lateral dose distribution measured with the STARCHECK array with the corresponding vertical and horizontal profiles shown in figure 7. A second approach is based on the calculated 2D dose distribution using the modified raster spot positions derived from the original irradiation records (see section 3.1).
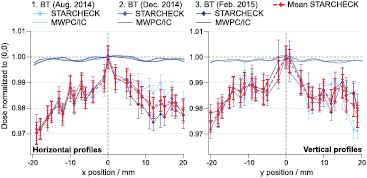
Figure 7. Mean lateral dose distributions normalized to the central beam as measured by means of the STARCHECK array behind the water equivalent slab phantom before each of the three beam times (BT). The standard uncertainties illustrated by the error bars comprise the calibration uncertainty of the array of 0.3% as well as the corresponding individual relative standard error of the mean, which was found to be on average below 0.3% for all repetitive measurements. Over the course of beam times (BT), the measured distributions in both horizontal and vertical direction agree well within their uncertainties demonstrating reproducible measurement conditions over time. The standard uncertainty of the resulting mean relative dose distributions (red curves) considers the measurement uncertainties of the beam time-specific lateral dose profiles as well as the standard deviation from beam time to beam time of 0.28%. In addition to the measured profiles, corresponding relative lateral dose distributions were calculated on the basis of the original irradiation records. In comparison to the measured data, the calculated profiles show almost homogeneous lateral dose distributions.
Download figure:
Standard image High-resolution image2.5. Monte Carlo simulations
Monte Carlo (MC) simulations have been performed using the FLUKA code version 2011.2c.0 (Ferrari et al 2005, Böhlen et al 2014) to provide more information about the 'quality' of the radiation by simulating the LET distribution of the particle spectrum at the actual measurement position as well as the contribution of the different particles to the total deposited dose. Furthermore, FLUKA has been used to calculate the perturbation correction kP of the calorimetric detector. The real measurement condition of the water calorimeter, i.e. all materials including Styrofoam insulation and its inhomogeneous composition, water phantom, and glass cylinder of the calorimetric detector, has been implemented in FLUKA and verified by comparing the simulated ddd with the corresponding measured ddd. The deviation between experimental and simulated data has shown to be in the order of 0.2pp (percentage points) in the entrance channel, maximal 2.0pp in the raising shoulder of the Bragg peak and about 0.4pp in the tail region. Since the calorimetric measurements are performed in the entrance channel of the ion beam with a very small gradient of the ddd, the impact of the differences seen in the raising area of the Bragg peak can be assumed to be minor. The distance between the water calorimeter surface and the synchrotron comprising the vacuum window and the BAMS of the beam nozzle has been taken into account by using the appropriate phase-space file provided by HIT (Tessonnier et al 2016). The recommended default settings for hadron therapy, hadrothe, were used. Moreover, full transport of light and heavy ions was activated, evaporation of heavy fragments considered, δ-ray production by muons and charged hadrons deactivated, charged hadron transport step size decreased to a corresponding 0.5% loss of kinetic energy, and the transport cutoff in terms of kinetic energy reduced to 10 keV for all charged hadrons. The absorbed dose deposited at the measurement position of the thermistor probes was estimated using usrbin in a water region of 1 mm thickness (approximately the sensitive area of the thermistor probes) and a cross-section of 30 cm × 30 cm. In addition to the scored dose deposited by all particles, Dall, the dose deposited by particles with atomic number Z = 1 to Z = 6 regardless of their mass number M, was determined via FLUKA's auxscore card. The particle spectrum was estimated using FLUKA's usryield detector by scoring the particle yield d2N/(dLET × dE) with respect to LET and energy E in a cross-section of 30 cm × 30 cm water at the measuring depth of the thermistor probes, with auxscore filtering the particle yield by atomic number Z.
3. Results and discussion
3.1. Lateral dose distribution
Figure 7 shows the relative lateral dose profiles as measured by means of the STARCHECK array within the inner 40 mm × 40 mm area of the irradiated carbon ion field. Between the different BTs, the reproducibility, calculated as the mean value over the standard deviation for each data set per IC, amounts to 0.28%, demonstrating stable lateral dose distributions. Thus, for the determination of the field-dependent correction factors kl and kv, mean relative lateral dose distributions were used.
The data in figure 7 shows pronounced dose inhomogeneities having a maximal difference of about 3% between the central beam and the marginal regions of the radiation field. These large deviations were not expected from the initial irradiation plan. Furthermore, by taking the data of the irradiation records regarding the spatial irradiation pattern, the number of particles delivered to each raster, and the measured width of the ion pencil beam, the 2D dose distribution can be calculated by superimposing the intensity distributions of each spot. As also shown in figure 7, the derived theoretical dose profiles in both horizontal and vertical direction indicate an almost homogenous irradiation field for all three BTs and thus show no agreement with the experimental data. A possible explanation for the disagreement could be deviations of the raster spot positions as regulated by the MWPC located in the beam nozzle. If single wires of the MWPC are not located at their nominal position but within the production tolerance of about ±0.10 mm, ion beams delivered to this specific position will have a systematic shift due to the misplaced MWPC wires, whereas the irradiation records of the MWPC would record the coordinates of the nominal raster spot position. It could be shown by repetitive simulations that by varying the position of single raster spots as recorded by the MWPC within ±0.06 mm, assuming a systematic shift of the corresponding MWPC wires, the measured relative lateral dose distributions in both horizontal and vertical direction can be well approximated by the calculated profiles (figure 8). Although this hypothesis could not be verified experimentally yet, these slightly modified raster spot positions have been used for the calculation of the heat conduction correction kc.

Figure 8. Comparison of the measured mean lateral dose distributions in horizontal and in vertical direction with the corresponding calculated profiles on the basis of the modified raster spot positions.
Download figure:
Standard image High-resolution image3.2. Particle spectrum
In order to specify the radiation quality of the carbon ion beam beyond the determination of Rres (section 2.2), figure 9 summarizes the results of the MC simulation regarding the LET distribution of the particle spectrum as well as the contribution of primary particles and fragments to the total deposited dose. Although this additional information is not necessary for the comparison of the experimentally determined kQ factors with the theoretical kQ factors stated in current dosimetry protocols, it has been added in foresight as it might be of importance for continuing work. As expected, carbon ions (Z = 6) show the most narrow peak at the highest median LET of 11.3 keV µm−1 corresponding to a kinetic energy of about 368 MeV/u. This value is in agreement with the expected energy loss of the primary carbon ions (E = 429 MeV/u) passing the corresponding water-equivalent thickness from the synchrotron to the measurement position of the water calorimeter. The lightest particles with Z = 1 show the broadest peak at the lowest median LET of 0.4 keV µm−1, while all other particles with Z = 2–5 are located in between. Protons, deuterons and tritons (Z = 1) dominate the particle spectrum with a fraction of 48%, whereas carbon ions only contribute with 39% to the total number of particles scored at the measurement position of the water calorimeter. However, due to the difference in LET, the total dose is mainly deposited by carbon ions (85%), while the dose contribution of particles with Z = 1 is only 8%. Helium ions (Z = 2) make 10% of the total number of particles, while their contribution to the deposited dose is only 3%. Lithium (Z = 3), beryllium (Z = 4), and boron (Z = 5) are rare in the spectrum (less than 2% each) and deposit about 4% of the total dose all together. Particles with higher Z have not been explicitly considered in the simulation, since the sum over the doses from Z = 1 to 6 agrees within 99.8% with the total deposited dose scored independent of particle type. Thus, target fragments like oxygen and other heavier fragments only contribute with 0.2% to the total deposited dose and are therefore neglected in the particle spectrum shown.

Figure 9. The figure summarizes the results of the MC simulation at the measurement position of the water calorimeter showing (I) the yield of the different particles (number of particles, N, per primary simulated particle, N0) with respect to LET in water (median LET highlighted), (II) the percentage of the different particles with respect to the total number of particles scored, as well as their (III) percental contribution to the total deposited dose. The errors given for the dose estimation are directly taken from the MC simulation and thus only consider statistical uncertainties.
Download figure:
Standard image High-resolution image3.3. Correction factors for calorimetric Dw,Q determination
The kl factors are directly given by the reciprocal of the interpolated relative dose at the individual thermistor position, as the dose profiles in figures 7 and 8 have been normalized to the value at the central axis of the irradiation field. Differences well below 0.2% occur if either the mean relative lateral dose distribution measured with the STARCHECK array or the calculated relative dose distribution using the modified raster spot positions of the MWPC is used for the kl determination. The mean of both approaches was taken as the true thermistor-specific kl values. Depending on the specific thermistor position, values for kl lie between 1.0071 and 1.014 with a mean relative uncertainty of 0.36% dominated by the uncertainty of the measured mean lateral dose distribution. In addition, positioning uncertainties of the calorimeter, which are conservatively assumed to ±1 mm, cause a possible variation of the kl values within a relative standard measurement uncertainty of 0.14%, which is separately addressed in the overall uncertainty budget for the kQ determination (table 2).
The perturbation correction kP was determined as the mean ratio of IC measurements without and with the glass cylinder of the calorimetric detector present to kP = 1.0021 with a relative standard error of the mean of only 0.07%. This uncertainty contribution already includes the effects from small positioning variations of the IC during the course of measurements. Nevertheless, a possible systematic difference between the real calorimetric and the 'dummy detector' geometry (e.g. absence of thermistor probes) must be considered and is accounted for by an assumed uncertainty contribution of 0.2%. Thus, kP was taken to 1.0021 with an overall relative standard uncertainty of 0.21%. As a result from the MC calculations, the value for kP was found to be 1.0014 and thus confirms the experimental result.
By means of the convolution method (section 2.4.1), the heat conduction correction kc was determined to 1.0177 within a relative standard uncertainty of 0.50% using the slightly modified raster spot positions according to the knowledge gained from the measured lateral dose distribution (section 3.1), the measured size of the pencil beam (figure 2), and a mean time structure with a total irradiation time of 95 s. The value for kc is given here as a position-independent heat conduction correction, as the variations of kc for the different thermistor positions were found to be less than 0.2%, which is therefore incorporated in the given standard uncertainty. Additionally, the uncertainty for kc comprises the following components: (I) Variations of the time structure occurring from irradiation to irradiation due to different numbers of 'spills' delivered from the synchrotron as well as variations of the lateral dose distribution between different BTs are accounted for by performing calculus of variations using the measured fluctuation range. This component contributes to the total uncertainty with about 0.3%. (II) Uncertainties of the applied convolution model especially with respect to the complex raster pattern and the influence of the detector cylinder wall on raster spots positioned close by are also estimated to be approx. 0.3%. (III) Usually, the exact time evolution of the series of consecutive irradiations is considered in the heat transport calculations (Krauss 2006). This method, however, would lead to almost impractical data handling for the convolution method used here. Therefore, to further validate the convolution method, full heat conduction calculations were performed for a static irradiation field. It was assumed that the lateral dose distribution discussed in section 3.1 was permanently applied during an irradiation time of 95 s. Further, in order to estimate the influence of the consecutive irradiations, the heat conduction calculations have been performed for a series of 10 irradiations interrupted by breaks of 3 min. Maximal differences between the irradiation specific kc's were found to be 0.2% with a mean kc value of 1.0118. Thus, this variation is considered as an additional contribution to the overall uncertainty of the irradiation independent heat conduction correction. (IV) The uncertainty of the geometrical water calorimeter model as well as the thermal parameters used within the finite element calculations is assumed to contribute approx. 0.1% to kc.
3.4. Correction factors for IC measurements
According to the procedure described in DIN 6801-1, ks has been determined to 1.0022 (1.0023) for the FC65-G (TM30013) chamber operated at +300 V (+400 V). Via calculus of variations, where the number of data points in the Jaffé diagram has been slightly varied and its impact on the resulting ks value studied, the total measurement uncertainty for ks was estimated at 0.22% for both chambers including a small uncertainty contribution from the fit parameters used with respect to the analysis of the Jaffé diagram.
The polarity corrections kp have been determined to 1.0012 (0.9993) for the FC65-G (TM30013) chamber. The relative standard uncertainty was found to be 0.07% in both cases dominated by the standard error of the mean of the repeated measurements.
However, for the determination of kQ the ratio of ks as well as kp between carbon ions and 60Co as reference beam quality is required with ks,Co = 1.001 (for both chambers) and kp,Co = 1.001 (kp,Co = 0.999) for the FC65-G (TM30013) chamber as taken from the calibration certificates.
The volume correction factor kv of the ICs (section 2.4.2) was found to be 1.0129 on average. The relative standard uncertainties are taken to be 0.26% comprising an assumed uncertainty contribution of 0.20% for the simplified method for the determination of kv itself and 0.17% from the mean lateral dose distribution measured with the STARCHECK array (figure 7). Analogue to the lateral positioning uncertainty of the thermistor probes, an additional uncertainty contribution of 0.10% to kv results from possible positioning uncertainties (±1 mm) of the IC.
In summary, the main correction factors required for the calorimetric Dw,Q determination and the ionometric measurements are given in table 1.
Table 1. Summary of main correction factors required for the determination of kQ, separated into corrections required for the calorimetric and ionometric measurements, respectively.
| Calorimetric corrections | Ionometric corrections | ||
|---|---|---|---|
| kl | 1.0102 |
ks | 1.0013 |
| kc | 1.0177 |
kp | 1.0003 |
| kP | 1.0021 | kv | 1.0129 |
3.5. kQ factors for FC65-G and TM30013 chamber and uncertainty budget
The combined standard measurement uncertainties of the ND,w,Q and the kQ factors were evaluated in accordance with the recommendations of the GUM, Guide to the Expression of Uncertainty in Measurement (JCGM 2008). They are composed of the uncertainty contributions from the calorimetrically determined Dw,Q (as the mean of the absorbed dose values from both thermistors), the ionometric measurement of MQ, as well as the uncertainty of the calibration factor ND,w,Co. Because both ND,w,Q and ND,w,Co are determined by use of water calorimetry, the uncertainties for the specific heat capacity of water, for the heat defect, and for the uncertainty contribution caused by the Pt-25 standard thermometer used for the calibration of the thermistor probes are common in both cases and thus will be omitted in the calculation of the overall standard measurement uncertainty of kQ (Krauss and Kapsch 2007a, Krauss and Kapsch 2007b)). Table 2 summarizes the complete uncertainty budget for the experimentally determined ND,w,Q and for the kQ factors. As the uncertainties for the ionometric measurements performed with both ICs are very similar, the uncertainty budget is valid for the kQ factors determined with both ICs. In addition to the uncertainties of the calorimetric and ionometric correction factors discussed in section 3.4 and 3.5, additional contributions need to be considered for the measured relative resistance change ΔR/R (0.15%) with the calorimeter, the charge measurement (0.09%) with the ICs as well as a 0.30% contribution for possible variations in the dose deposition occurring between the calorimetric and ionometric measurements (section 2.2). The first two mentioned contributions comprise statistical measurement uncertainties, uncertainties of the calorimetric and ionometric measurement systems and uncertainties introduced by the data analysis methods.
Table 2. The table summarizes the standard uncertainties of all influence quantities and presents the combined standard measurement uncertainty for the calorimetric determination of ND,w,Q and kQ, calculated in accordance with the GUM. Some of the uncertainty contributions are common for both ND,w,Co and ND,w,Q and are therefore omitted in the overall standard measurement uncertainty of kQ (section 3.5).
| Quantity | Rel. standard | uncertainty/% |
|---|---|---|
| Calorimetric measurements, Dw,Q | ||
| Radiation-induced temperature rise | ||
| Rel. resistance chances, ΔR/R | 0.15 | 0.15 |
| Thermistor calibrations, S | 0.07 | 0.03 |
| Specific heat capacity, cp | 0.03 | — |
| Lateral measurement positions, kl | 0.36 | 0.36 |
| Heat conduction effects, kc | 0.50 | 0.50 |
| Heat defect, kh | 0.14 | — |
| Stability of detector response | 0.10 | 0.10 |
| Positioning of the thermistor probes | 0.14 | 0.14 |
| Radiation field perturbation correction, kP | 0.21 | 0.21 |
| Change in thermistor's electrical power, ke | 0.01 | 0.01 |
| Measurement position in depth, kT | 0.01 | 0.01 |
| Ionometric measurements | ||
| Dosimeter reading | 0.09 | 0.09 |
| Polarity effect, kp | 0.07 | 0.07 |
| Ion recombination, ks | 0.22 | 0.22 |
| Volume effect, kv | 0.26 | 0.26 |
| Positioning of the ionization chamber | 0.10 | 0.10 |
| Calibration factor ND,w,Co | — | 0.20 |
| Stability of ND,w,Co | — | 0.05 |
| Long-term reproducibility of the irradiation | 0.30 | 0.30 |
| Combined standard measurement uncertainty of ND,w,Q | 0.80 | |
| Combined standard measurement uncertainty of kQ | 0.82 | |
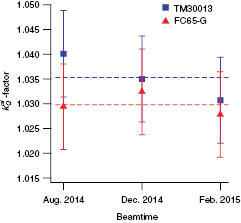
Thus, an overall standard measurement uncertainty of 0.82% for the kQ factors determined for each IC per calorimetric/ionometric BT has been achieved. The corresponding kQ factors are shown in figure 10 agreeing well within the given uncertainties. The final kQ factor per IC is taken to be the mean value of the three experimentally determined factors. Please note that the mean kQ values given in the figure need to be transformed into  (equation (4)) and
  (equation (5)), respectively, in order to be used for the reference dosimetry of ion beams according to DIN 6801-1 (DIN 2016) and TRS-398 (Andreo et al 2006). The corresponding
  and
and  values are summarized in table 3 and are compared to the data from literature.
Table 3. Comparison of the experimental  and
and  factors (see equations (4) and (5)) determined by means of water calorimetry in the clinical carbon ion beam at HIT with the calculated kQ values for ion beams as stated in TRS-398 and DIN 6801-1. The uncertainties given are the standard uncertainties for the experimental and calculated kQ values, respectively.
| TM30013 | FC65-G | |||||
|---|---|---|---|---|---|---|
| Literature | Calorimetry | Δ/% | Literature | Calorimetry | Δ/% | |
| DIN 6801-1 | 1.014 ± 2.2% | 1.026 ± 0.8% | −1.2% | 1.012 ± 2.2% | 1.021 ± 0.8% | −0.9% |
| TRS-398 | 1.032 ± 2.8% | 1.036 ± 0.8% | −0.4% | 1.042 ± 2.8% | 1.030 ± 0.8% | +1.1% |
Figure 10. kQ factors for carbon ion beams, as determined with the water calorimeter for the different measurements performed between August 2014 and February 2015. The error bars indicate the standard uncertainty of 0.8% with the dashed line showing the mean value. See equations (4) and (5) for conversion into  and
and  , respectively.
Download figure:
Standard image High-resolution image
4. Discussion and conclusions
It has been shown for the first time that the experimental determination of the kQ factor for carbon ion beams by means of water calorimetry is achievable with a relative standard measurement uncertainty of 0.8%. This corresponds to about a threefold reduction of the uncertainty compared to calculated values and therefore enables the significant reduction of the overall uncertainty related to ionization-based dosimetry of clinical carbon ion beams. The comparison between theoretical and experimental kQ factors given in table 3 shows that, with respect to DIN 6801-1, the experimentally determined  values for both chambers having a similar design are about 1% larger than the theoretical ones. However, the same tendency is not observable with respect to TRS-398. While for the TM30013 chamber the experimentally determined
  value is about 0.4% larger than the corresponding literature value, it is about 1% lower than the theoretical value in the case of the FC65-G chamber. In order to further investigate the inconsistency between measured and calculated kQ factors allowing to draw a conclusive statement with respect to literature values, more experimental data is needed.
Nevertheless, the increased accuracy of the experimentally determined kQ factor might open up the possibility to gain further insight and to validate individual components of the calculated kQ factor for ion beams such as the (Wair)Q value or the stopping-power-ratio (sw,air)Q, which—up to now—dominate the overall uncertainty of the calculated kQ factor. For example, using the individual values (including their standard uncertainties) for the different parameters of equation (1) given in TRS-398 and DIN 6801-1, respectively, an 'experimental' value for Wair/e can be deduced from the experimentally determined  and
and  values. With respect to the TM30013 chamber (table 3), the 'experimental' value for Wair/e amounts to Wair/e = (34.62 ± 0.87) J/C and to Wair/e = (34.97 ± 0.64) J/C according to the TRS-398 and the DIN 6801-1 protocol, respectively. Within their standard uncertainties, both values are in agreement with the theoretical values Wair/e = (34.50 ± 0.52) J/C given in TRS-398 and Wair/e = (34.71 ± 0.52) J/C given in the new recommendations of the ICRU (ICRU 2016). The 1% discrepancy between both 'experimental' Wair/e values are mainly caused by the different stopping-power data (sw,air)Q considered by the TRS-398 and the DIN protocol. In comparison, Sakama et al (2009) found a mean value of (35.72 ± 0.54) J/C for carbon ion beams having an initial energy between 135 MeV/u and 430 MeV/u by means of graphite calorimetry, which is about 3.5% larger than the literature value. Preliminary results obtained by Rossomme et al (2014) in an 80 MeV/u carbon ion beam also by means of graphite calorimetry indicate a Wair/e value of (35.50 ± 0.90) J/C and are thus in good agreement with the mean value found by Sakama et al (2009).
Besides precise calorimetric and ionometric measurements, the low uncertainty of the experimental kQ factors could only be reached by a detailed characterization and monitoring of the irradiation field. Most importantly, it was found that accurate knowledge of the lateral dose distribution is essential in order to determine the corresponding calorimetric (i.e. kc and kl) and ionometric correction factors (i.e. kv) with sufficient accuracy, as the simple assumption of a homogeneous dose distribution as predicted by the irradiation plan would lead to severe mistakes. For example, in the case of the volume correction factor kv it turns out that this correction should not be neglected since especially scanned ion beams tend to exhibit intrinsic inhomogeneities with partly significant dose gradients.
The total standard measurement uncertainty of the experimentally determined kQ factor for carbon ion beams could potentially be further decreased by using a more advanced 2D dosimetry device in order to determine the lateral dose distribution with higher accuracy and spatial resolution compared to the STARCHECK array. In addition, the investigation of spatial dose response functions of ICs with respect to carbon ion beams to enable a sound determination of kv would be desirable in order to converge to the same level of dosimetric accuracy as that of conventional high-energy photon beams.
As a projection of this investigation, it would be highly desirable to extend the experimental determination of the kQ factor by means of water calorimetry to different energies and different particle species (e.g. p, He, O). Even more conclusive results with respect to the comparison with calculated kQ values stated in literature as well as the possibility to investigate a potential energy/LET dependency of the kQ factor are expected from these additional measurements. Furthermore, as graphite calorimetry is also commonly used as a primary standard for absorbed dose to water in many standard laboratories worldwide (Seuntjens and Duane 2009), a direct comparison of water and graphite calorimetry in a clinical (scanned) carbon ion beam would be of great importance in order to further validate the experimental results found in this investigation.
Acknowledgment
We would like to express our gratitude to Karl-Heinz Misselhorn and Andreas Schlesner from PTB for their extensive technical support during the course of the calorimetric experiments at HIT, to Ulrike Ankerhold from PTB for realizing the cooperation between PTB and HIT, to the medical physicists and the accelerator team from HIT for their help with the irradiations and numerous fruitful discussions as well as to Eduardo Yukihara from PSI/OSU, Thomas Tessonnier from HIT and Andrea Mairani from CNAO/HIT for their help with the Monte Carlo simulations.