

Abstract
This article presents an experimental setup capable of conducting various experiments. The setup is used to accurately determine the acceleration due to gravity using either the pendulum or free fall experiment, as well as to allow students to conceive and conduct their own experiment. We discuss the design of the setup and the experiments conducted with it, highlighting the versatility and potential use for open inquiry. We include students' perception on this particular experiment and how it led to an interesting and educational open inquiry.
Export citation and abstract BibTeX RIS

Original content from this work may be used under the terms of the Creative Commons Attribution 4.0 license. Any further distribution of this work must maintain attribution to the author(s) and the title of the work, journal citation and DOI.
1. Introduction
Each year, approximately 250 students enrol in the Applied Physics Bachelor's program at Delft University of Technology (DUT). The 6 ECTS (168 h) first year physics lab course (FYPLC) is the program's first course introducing students to experimental physics. Similar to many introductory university lab courses [1, 2] and as recommended variously [3–5], the main goal is to impart the basic knowledge required for successful participation in scientific research. According to the learning goals, after successful engagement our students should be able to:
- 1.Conceive and plan a rigorous but basic physics inquiry;
- 2.Identify, calculate and where possible reduce (measurement) uncertainties, and do error propagation calculations;
- 3.Use commonly used instruments and measurement techniques (oscilloscope, multimetre, voltage dividers, ...);
- 4.Collect, analyse and visualize data;
- 5.Adequately report the findings and convincingly answer the research question.
To accommodate attainment of these learning objectives, the course has been redesigned recently [6], introducing i.a. new experiments. One of the interesting new experiments is designed and developed with the university's Electronic and Mechanical Support Division. We use it to focus on measurement uncertainty but it enables students to conceive their own experiments as well.
Before zooming in on the experimental setup and the various experiments that have been conducted by the students so far, a more detailed description of the course and its content is given. This allows to further specify how this experimental setup comes at hand in the course.
2. Background of the course
To impart the intended learning objectives described above, the FYPLC runs for 16 weeks, with two four-hour sessions a week. The first session in the week consists of self-work, with teaching assistants available online and on campus. This session is meant, i.a., for learning to program in self-guided modules and writing reports.
The second session, conducted in smaller groups of ∼60 students, include small lectures, experiments, and Q&A sessions led by the main teacher. During the five experiments carried out in the course, the students work in (alternating) pairs.
Where previously the course focused especially on the development of conceptual knowledge, we recently shifted focus towards developing students' ability to engage in experimental physics research. In the redesign of the course [6] we made use of Millar's Procedural and Conceptual Knowledge in Science (PACKS) model [7, 8], see figure 1. The model distinguishes four types of knowledge: knowledge type A refers to the understanding of the scientific purpose of inquiry, type B to the relevant content knowledge, type C to the ability to manipulate the instruments, and type D to the knowledge required to evaluate the reliability and validity of scientific evidence. All knowledge types need to be addressed and developed extensively when enabling students to successfully engage in physics inquiry.
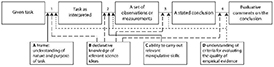
Figure 1. In Millar's PACKS model (feedback loops omitted) four knowledge types required in various stages of an inquiry are distinguished. The quality of decisions made is influenced by the level of attainment of these knowledge types. The model guided the transformation of the FYPLC, where the various knowledge types are addressed in specific designed activities [7]. Taylor & Francis Ltd. http://tandfonline.com.
Download figure:
Standard image High-resolution imageIn our approach, the various PACKS knowledge types are systematically addressed in specific, separate experiments and activities. Accordingly, the course is structured in three phases (introduction, practice, application). The first eight weeks focus on collecting, analysing and representing data (learning objectives 2, 4 & 5—PACKS type A&D). Weeks 9–12 focuses on learning objectives 2 and 3 (PACKS type C&D). In this phase, students conduct four experiments, among them the determination of  described below.
As students ultimately should be able to apply in an integrated way the full scope of PACKS and make research decisions themselves [4, 9, 10], the students engage in a final project where they conduct a self-conceived experiment [11]. Students' ability to conceive and conduct a physics experiment as well as report on it, is assessed using a grading rubric that is derived from the Assessment Rubric for Physics Inquiry (ARPI) [12]. ARPI fulfils the role of evaluating the quality of students' research decisions by examining the justifications they provide for them in their report and lab journal. An even more elaborate description of the course' details is available [6].
3. The experimental setup
In the practice phase, one of the experiments focusses on the development of PACKS knowledge type D. This experiment requires students to fully apply their understandings of measurement uncertainty and error propagation. In this experiment, students are asked to determine the fourth significant figure of acceleration due to gravity within 0.1% of the established value in Delft (9.812 m s−2). Students are free to choose either the pendulum or the freefall experiment. Regardless of the experiment students choose, the same setup is used.
The experimental setup, depicted in figure 2, consists of a tall ITEM frame (2.75 m) with an adjustable horizontal bar attached to it and a ruler glued to the side of the frame. One break beam sensor (consisting of a LED and photodiode) is mounted to the bar. Another is mounted at the lowest point of the frame. The Arduino registers when the IR-beam is interrupted by a passing object. Using both sensors allows to determine the time it takes for an object to travel between these sensors. Using only the bottom sensor allows to determine the time of half a pendulum's period.
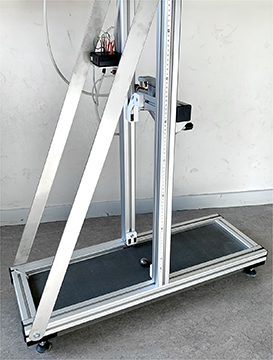
Figure 2. The experimental setup consists of a tall frame with a sensor adjustable in height at the top and one fixed at the bottom.
Download figure:
Standard image High-resolution imageFor the freefall experiment an electromagnet is attached at the horizontal bar with the first break beam sensor mounted several centimetres below it, ensuring that the ball has a significant velocity  as it passes through. A simple clip can be affixed to the horizontal bar enabling easy attachment and alteration of the pendulum's length. Moreover, three different printed sensor holders are developed, figure 3. These holders (single, stacked or parallel) allow to determine the instantaneous velocity at that point and thereby allowing many different experiments. Further details, as well as the 3D models used in the setup can be requested by contacting the author.

Figure 3. Three different sensor holders are available, the stacked sensors allow to determine the instantaneous velocity.
Download figure:
Standard image High-resolution image4. Determining g
For both experiments a small description is given, including a formula. Students are first asked to measure the fall time or period by hand and then calculate the acceleration due to gravity. This quickly leads to the conclusion that determining the acceleration within the given precision and accuracy manually is not feasible. Students are then asked to devise their own methods and procedures using the given experimental setup.
These experiments are not new to students. Both the pendulum and the free fall experiment are frequently used in secondary school physics and introductory university courses [13–19], with more precise devises such as Kater's pendulum available [19]. However, our goal is to have students find the best possible answer to the research question using a cheap and simple setup, where they master already the physics content.
We provide our students with numerous opportunities to make decisions, while also emphasizing the importance of making well-justified choices. For instance, we provide about ten different wires and ask students to pick one. Thin nylon wires might be preferred due to their small mass, however, they might come with the pitfall that they easily stretch. Students might pick a bob of their choice as well. They often assume that the centre of mass is in the middle as they expect that the bob has a uniform density. Assumptions like these—or neglecting angle and friction—need to be validated however. Our teaching assistants are trained to probe questions about these 'hidden' assumptions and are not easily satisfied by students' answers.
Once students have validated their assumptions, they may continue in designing a proper method. They need to consider the number of repeated measurements, the range and interval, the starting angle for the pendulum and how to measure the length or height as accurately as possible. As the task is clear and easy to understand (PACKS type A), students master the relevant physics content (PACKS type B) and the setup is simple (PACKS type C), they can fully focus on the adequacy of their methods. That is, distracting details are minimized [20]. Taking measurements by hand, validating all assumptions and devising a method takes roughly two hours. Students are then ready to collect measurements.
One option is to use a fixed length for the pendulum and let it swing for a few hundred times. The result is shown in figure 4 where we used a 245.2 ± 0.3 cm long pendulum. Interestingly enough, the experimental setup allows to record small variations in the period as consequence of the classroom's door opening and closing or students passing by. Using these 357 recordings (without discarding outliers) we obtain 9.810 ± 0.001 m s−2. Note that a difference of only 2 mm already results in a value of 9.817 m s−2. This highlights (again) the importance of measuring as accurately as possible.

Figure 4. 357 repeated measurements on a 245.2 ± 0.3 cm long pendulum resulting in a value of 9.810 ± 0.001 m s−2 for the acceleration due to gravity.
Download figure:
Standard image High-resolution imageAlthough this is one smart way to determine  , most students take four to five different heights and about ten repeated readings. Their decisions as well as their justifications for these illustrate their understanding of measurement uncertainty. Frequently we have held discussions on the number of repeated measurement ('why repeat at all? it should yield the same result...'), the chosen range ('why do you only measure between 1.0 and 1.5 m?'). A benefit of this approach is that the experiment is largely self-correcting: both the found value and its associated uncertainty tells whether the chosen approach is adequate.
Once all data have been collected, students need to plot and analyse them using Python, see figure 5. Students explore, i.a., whether a systematic error exists. They thereby gain a crystal-clear understanding of residual analysis and its purpose. As no further guidance on the specific data-analysis is given, students' understanding (of data-analysis e.g. coordinate transformation) is elicited. Students report their findings by writing a 200 word abstract. The abstract as well as their lab journal is used for assessment purposes.
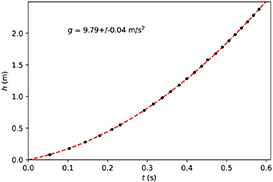
Figure 5. A students' attempt to determine the fourth significant figure of the acceleration due to gravity using the free-fall experiment.
Download figure:
Standard image High-resolution image5. Open inquiry
In the final project of the FYPLC, students can devote approximately 28 h on a self-conceived experiment. This project allows them to apply their newly acquired knowledge, try, probably fail, reflect and do it all over again when necessary [11]. Some guidance is provided by providing a list of ∼15 topics. For each topic, some background information is provided and an experimental setup is available. The described setup is one of these and is used in various of these topics.
Students start with a short literature study, do a few trial runs, think of an appropriate research question and methods to answer that question. Subsequently they write a research proposal. We assess whether the conceived experiment is feasible within the given time frame and provide feedback and tips. Once the students received a GO, they may conduct the experiment. Help is still available when necessary.
One of the self-conceived experiments with the described setup carried out so far involved an investigation of the influence of air resistance of a pingpong ball. These students changed the weight of the ball by filling it with sand. The fall time, and thereby the average velocity of the ball was then determined at various heights. Students verified whether their measurements confirmed theory.
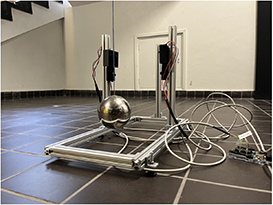
Another student team investigated how a pendulum's period is affected by the starting angle of the pendulum. Yet another team had the ambitious plan to determine the Q-factor of a pendulum as function of its velocity, see figure 6. The setup has also been used to experimentally validate the formula of falling cones as provided by Mooldijk, van der Valk [21].

Figure 6. The graph a student team produced when investigating the Q-factor as function of the pendulum's velocity.
Download figure:
Standard image High-resolution imageIn one of the latest attempts, a group of students tried to determine the acceleration due to gravity even more accurate than their first attempt ( = 9.811 ± 0.002 m s−2). They modified the experimental setup slightly first, see figure 7, and used a rope with lengths between 11 and 18 m. As they experienced several difficulties, e.g. vibrations, they were required to further improve the setup. With not much time left to collect the actual data, they finally found a value of
  = 9.811 ± 0.002 m s−2. Although they did not succeed in establishing a more precise and accurate value, much was learned as elaborated on in the next section.
Figure 7. The students adapted the original experimental setup so they could measure in the stairwell using an 18 m long pendulum.
Download figure:
Standard image High-resolution image
6. Students' perspective
'We were not quite happy with our initial result. In the first experiment we focused too much on data collection rather than considering adequate methods. For instance, we did not consider what starting angle is small enough so that the pendulum's period can be considered angle independent. We realised this only in the data-analysis phase where we looked in more detail to our data. We saw a clear pattern in our data: the period decreased over time! Moreover, we came up with more accurate ways of determining the pendulum's length. All in all, we had some frustration about the way we approached this first experiment. This led us to question whether we could improve our result when given more time. The whole idea of doing a follow-up study also felt like a great opportunity to take into account the feedback from this experiment. For example, the first time we did not pay attention to proper data management. We wanted to do so more structured the second time. This would make it easier to adjust things when needed.'
As presented above, the students decided to carry out the same experiment in XXL format where they hoped to eliminate the angle issue and reduce the uncertainty in length.
'Still, one of the main problems we encountered was determining the exact length of the pendulum. Even an uncertainty of a few millimetre has significant impact on the experimental outcomes. In hindsight it would have been better to break up the entire experiment in smaller steps, changing one thing at a time. This would really help in understanding how each of the adjustments alters the experimental outcomes. However, this would take considerably more time. Even our final measurements took eight hours in total. Another issue that we faced was handling the large amount of data that we collected. We learned ourselves to write code, including classes, to keep the data manageable. The amount of time required to setup the experiment and analyse the data resulted in little time to write the article. If we would like to get a higher grade, it would be much smarter to keep the inquiry more simple and focus on improving our article, but where is the fun in that.'
'Looking back on our approach. We had simply not enough time to determine the fifth significant figure of the acceleration due to gravity. However, we question whether more time alone would help us here: There were several unexpected problems and factors that play a role with a 10x longer pendulum.'
7. In conclusion
In all self-conceived experiments, students started with ambitious plans. However, almost all teams experienced several hurdles that required problem solving and frequently altering the plan as well. The description provided by the students illustrates how a seemingly simple experiment can have follow ups and lead to interesting student-led investigation. Where a prescribed experiment often results in a desired outcome, leaving open more decisions to the students better illustrates what it takes to become an experimental physicist [4, 9]. Even with a simple experimental setup as described here, many experiments can be devised. Although only a very few experiments are described, I foresee many more experiments will be devised by the students upcoming years.
Acknowledgments
I would like to thank Floris Dirkzwager and Koen van Uffelen for their valuable input.
Data availability statement
The data that support the findings of this study are available upon reasonable request from the authors.
Ethical statement
This study conducted at the introductory lab course given at Delft University of Technology respected the privacy and psychological wellbeing of the individuals observed and posed minimal risk to the students as no personal data was collected. The two students presenting their work and sharing their experiences gave explicit consent for publication.