
Abstract
In high school, LC(R)-circuits are an integral component of physics education. We propose a new setup for exploring those circuits utilizing the magnetic field sensor of a smartphone in combination with the application phyphox, which reads and displays sensor input. Coils with high inductance and low resistance generate low frequency oscillations which can be visualized without any measuring devices other than a smartphone. The results are very satisfactory, because the resolution of the graph is high and the theoretical values match principal features of the measurements. Also, the setup can be achieved with low-cost components.
Export citation and abstract BibTeX RIS

Original content from this work may be used under the terms of the Creative Commons Attribution 4.0 license. Any further distribution of this work must maintain attribution to the author(s) and the title of the work, journal citation and DOI.
1. Introduction
LC(R)-circuits are a typical part of physics education in high school. The topic is usually taught in upper class, as part of the module 'oscillations'. Students examine the spring pendulum and determine the differential equation describing its movement. Later, the energetic properties of the pendulum are compared to those of the LC-circuit.
The main problem of common LC-circuit setups is the visualization of the oscillation, which requires expensive oscilloscopes. The components used in school setups produce oscillations with frequencies in the range of a few kHz or higher, thus an oscilloscope with memory function or an additional signal generator is required. We propose a new setup which gives a simple alternative where only a smartphone, a battery, a capacitor and a coil with special characteristics is used.
To visualize the oscillation, the magnetic field sensor of a smartphone is used to measure the magnetic field of the coil. In the setup, the capacitor is connected directly to the coil. The introduced characteristics of both lead to an oscillation which has a frequency between 6 Hz and 30 Hz. The magnetic field is measured by the students with the smartphone application phyphox (https://phyphox.org, [1]). Hence the setup consists only of four parts: the smartphone, a coil, a capacitor and a voltage source.
Hochberg et al find, that the use of smartphones as measuring devices in class can lead to higher interest and to a higher state of curiosity than in experiments without smartphones [2]. Supported by this result and the easy to perform measurements with a smartphone, there have been some recent publications of smartphone-based experiments in general [3–5]. The magnetic field sensor is used in various applications like the discovery of the r−3 distance-strength-law or the determination of the Curie temperature [6–8].
To obtain the electrical characteristics of an LC-circuit, the microphone input of a computer or smartphone can be used [9, 10]. There are also oscilloscopes which can be plugged in the USB port of smartphones and tablets and display the data with a special app [11]. In this paper an alternative, simple and safe approach to measure the oscillations of an LC-circuit is presented. The method is fast and simple, because there is no extra wiring needed for data acquisition and the data can be shown instantly and be analysed within the app. It is safe, because no electrical connections to the measurement device are made. Since a majority of more than 90% of smartphone-users has a magnetometer in their devices (due to the database [12] with 25.000 phyphox-users, who agreed to deliver data for 3.000 different smartphone types), this experiment can be performed by almost any student with their own smartphone.
2. The experiment
After charging the capacitor with the battery, it is connected to the coil, while the magnetic field is measured with a smartphone. The amplitude of the magnetic field is proportional to the oscillating current in the circuit, which results in a damped oscillating magnetic field of the coil (with  , the resistance R of the circuit, the inductance L, the start charge Q0, the decay constant τ and the oscillation frequency ω [13]):
The sample rate of the magnetic sensor in the smartphone is either 50 Hz or 100 Hz for most smartphones [14]. According to the Nyquist–Shannon sampling theorem [15] the oscillation frequency therefore should be lower than 25 Hz, respectively 50 Hz. Furthermore, the oscillation produces a visible graph in phyphox if  s, and better
  s.
s.
These values lead to rather fixed characteristics of the coil and the capacitor. Especially the coil must have a high inductance (which requires a high number of windings and a core with high magnetic permeability) while simultaneously having very low resistance. Such coils can be found in school supplies (expensive) or in professional audio supplies. The coils used in this setup have a resistance between 0.17 Ω and 2.5 Ω and inductances between 10 mH and 30 mH (see table 1). The prices for coils B and C were 150 € and 30 € (as of spring 2021). The low intensity of the magnetic field is no problem, since the smartphone sensor is designed to measure the magnetic field of the earth with a strength around 50 µT.
Table 1. Data of the coils used in this experiment.
| Serial No. | Induct. | Resist. | Manufact. | |
|---|---|---|---|---|
| A | 56 214 | 11 mH | 2.5 Ω | LEYBOLD |
| B | 195P10 | 30 mH | 0.17 Ω | hmf |
| C | LSI-100T | 10 mH | 0.19 Ω | Monacor |
The capacitance is chosen so that the frequency is high enough but still resolved. This experiment is realized with capacitances between 22 mF and 470 µF.
The capacitor is charged via battery (with 9 V). Then it is connected immediately to the coil—without wires to reduce the total resistance of the setup to a minimum.
3. Measurement technique
For measurements, the smartphone application phyphox is used. Since 2015 this program is developed by Staacks et al [1] at the RWTH Aachen University and can be used on Android and iOS to utilize the sensors of a smartphone for a wide range of experiments. In this experiment one can select the predefined configuration to read the magnetic sensor (display x-, y- and z-axis) or create a new configuration which, for example, displays only the z-axis. Students then can read the new configuration simply via QR-Code with their own phones. Also the teacher can display the measurements on a video projector via browser and the easy-to-use remote interface included in phyphox.
To measure the magnetic field, it is best to place the smartphone on the coil so that the actual sensor is on the centre of one pole (so one axis of the sensor is tangential to the field lines). Then only the vertical axis (the z-axis) can be used for the measurement. In most smartphones the magnetic sensor is somewhere in the top part of the phone, but the location of the sensor in the smartphone can be determined also with a magnetized nail. The nail is brought up from all three directions in space while the graph of the magnetic field is observed in phyphox. In all smartphones the z-axis is perpendicular to the screen.
The measurement process is as follows: after placing the phone on top of the coil, the measurement in phyphox is started (by pressing the play-symbol). Then the charged coil is connected to the capacitor and a graph can directly be seen. To stop the measurement, the pause-button is pressed.
4. Analysis
With suitable components, the results correspond strikingly well with theoretical expectations for such a simple setup. An oscillation of the magnetic field may be visible in phyphox for more than one half of a second.
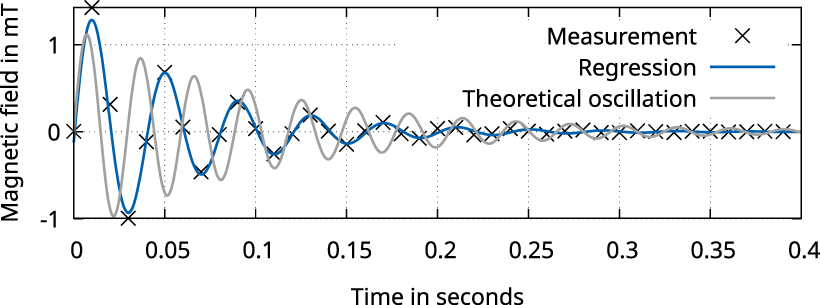
The experiment is conducted with a range of capacitances and three different coils. While measurements with the coil A show highly dampened oscillations only, using coils B and C result in oscillations with up to seven clearly visible maxima as shown in figures 2 and 3. The measured values are analysed with Python. To determine the values for β and ω, the maxima and minima are fitted with an exponential function  . In a second step, the whole data set is fitted with an oscillating function which uses the previously determined value for β. In comparison to the theoretical values of β and ω (calculated on the basis of the values of C and L, given in the data sheets of the parts used) the measured values are in the same range, but β is larger than the theoretical values and the frequency is lower. This could be explained by the internal resistance of the capacitor which is not considered in the theoretical equations. All values are reproducible over several measurements.
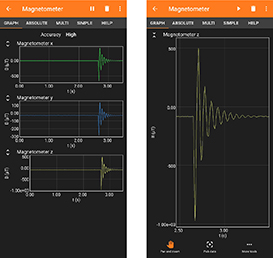
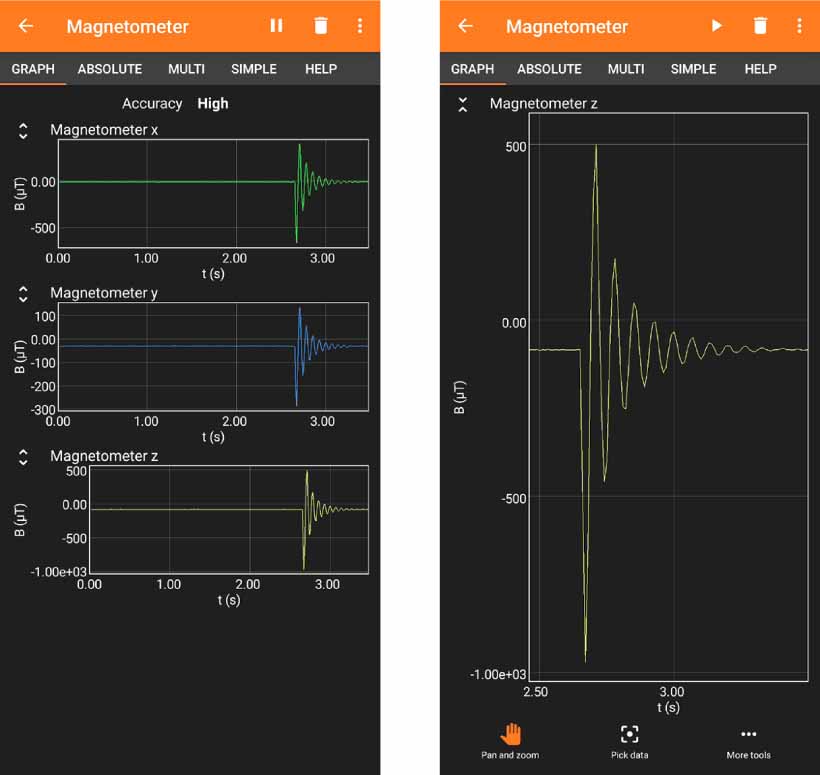
Figure 1. Screenshot of a measurement in the phyphox application (left: the whole measurement of all three axes, right: the zoomed z-data).
Download figure:
Standard image High-resolution image
Figure 2. Oscillation measured with coil B with C = 3300 µF, L = 30 mH and R = 0.17 Ω, with a sample rate of 100 Hz. Regression with ω = 84.6(3) s−1 and β = 6.8(1) ΩH−1.
Download figure:
Standard image High-resolution image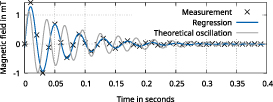
Figure 3. Oscillation measured with coil C with C = 2200 µF, L = 10 mH and R = 0.19 Ω, regression with ω = 156.4(5) s−1 and β = 16.0(4) ΩH−1. With a sample rate of 100 Hz, the maximum frequency of the circuit is reached approximately with the frequency shown here.
Download figure:
Standard image High-resolution imageNo significant differences between normal and bipolar capacitors have been found, but we recommend using bipolar capacitors to avoid damage due to polarity reversal. Furthermore the charging voltage has no effect on the oscillation other than a higher amplitude.
Due to the high quality of the data, the measurement values could be analysed in different ways in school. The easiest way is to analyse the data for maxima and minima of the graph directly in the app phyphox itself by using the 'pick data' tool. Phyphox also allows to export easily data as csv file for further use, for example, in a spreadsheet. Then the measuring points can be connected to an oscillation curve and its characteristics can be analysed. But also the maxima or minima can be connected to visualize the exponential decline of the oscillation. When the amplitude of the magnetic field is plotted logarithmically, a linear regression is also possible. Last but not least, the parameters of the oscillation equation can be determined by a set of measurement values and the resulting system of linear equations.
The experimental setup was tested with a group of students to evaluate both its handling and the quality of the experimental data measured by students. They could reproduce the results presented above successfully. The study resulted also in hints for conducting the experiment which can be found in the next section.
5. Trouble shooting
There are a few crucial points which need to be considered:
First, the magnetic sensor saturates at a certain level. If this happens, the distance between the smartphone and the coil has to be increased, e.g. by using cardboard as a spacer.
Second, according to the Nyquist–Shannon sampling theorem the frequency of the oscillation should not be higher than half of the sample rate of the sensor. In practice, it is advisable to aim for at least a quarter of the sample rate to generate a dataset that can be recognized as an oscillation by untrained eyes (for comparison, see figures 3 and 4).

Figure 4. Oscillation with C = 2200 µF, L = 10 mH and R = 0.19 Ω, (same values as in figure 3, but measured with a smartphone with a sample rate of 50 Hz, which is too slow to resolve the oscillation).
Download figure:
Standard image High-resolution image
Third, to shorten the capacitor with the coil with minimal resistivity without using cables, one needs a steady hand and sometimes multiple attempts.
6. Conclusion
We propose a simplified setup to measure the oscillation of a LC(R)-circuit in school with a smartphone. The magnetic sensor of a smartphone in combination with the application phyphox is used to measure the magnetic field of the coil. If the components have suitable values (especially the coils resistance should be low and the inductance high), an oscillation is visible for up to half of a second.
Data availability statement
The data that support the findings of this study are available upon reasonable request from the authors.
Biographies
Niklas Westermann has a Master of Education degree in Physics, Computer Science and Biology from the University of Konstanz. His research interests are enhancing education with digital tools and interdisciplinary teaching.
Sebastian Staacks is the developer of the physics education app 'phyphox' and a scientific assistant at the RWTH Aachen University. After getting his PhD in the field of solid state physics he focuses on developing digital tools to enhance physics education.
Heidrun Heinke is a professor for experimental physics at the RWTH Aachen University, where she is responsible for large physical practical courses with up to 2000 student participants per year and is engaged in teacher education. Her research interests are focussed on experiments in physics education.
Philipp Möhrke is researcher and teaching staff member for physics education at the University of Konstanz as well the Thurgau University of Teacher Education. His research interests are in handling and addressing the uncertainty of measurement data in school and university as well as the use of digital measurement devices.