
Abstract
Changing acceleration and forces are part of the excitement of a roller coaster ride. According to Newton's second law,  , every part of our body must be exposed to a force to accelerate. Since our bodies are not symmetric, the direction of the force matters, and must be accounted for by ride designers. An additional complication is that not all parts of the body accelerate in the same way when the acceleration is changing, i.e. when there is jerk. Softer parts of the body provide varying levels of damping, and different parts of the body have different frequency responses and different resonance frequencies that should be avoided or reduced by the roller coaster designer. This paper discusses the effect of acceleration, jerk, snap and vibration on the experience and safety of roller coaster rides, using authentic data from a dive coaster as an example.
Export citation and abstract BibTeX RIS

Original content from this work may be used under the terms of the Creative Commons Attribution 4.0 license. Any further distribution of this work must maintain attribution to the author(s) and the title of the work, journal citation and DOI.
Corrections were made to this article on 11 11 2020. The appearance of figure 3 was corrected.
1. Introduction
Acceleration and forces are at the heart of many amusement park experiences. Exposing our bodies to the changing forces triggers the fight or flight response, which in turn triggers our bodies to release neuro-chemicals such as adrenaline and dopamine [1], causing many people to consider amusement rides to be a lot of fun and an enjoyable experience.
According to Newton's second law, acceleration of a body with mass m requires a force  . Since the force of gravity,
  , always acts, the additional force required from the ride can be written as
  , usually expressed in terms of a G force which can be seen as a force per mass unit
  . The G force is thus independent of mass and is often expressed in terms of the acceleration of gravity, g ≈ 9.8 m s−2. It relates the force from the ride as it is in motion to the force when it is at rest. When the acceleration
  is close to
  , very little force is required from the ride and you experience near-weightlessness. Bouncing on a trampoline only the force of gravity acts while you are in the air and you experience
  , but as the trampoline bed enables the acceleration for the next bounce, you may reach
  [2, 3]. Elite trampolinists may reach even larger forces [3, 4]. This exceeds the maximum G force of
  allowed by amusement park standards. Unlike in an amusement ride, you may interrupt the bouncing motion at any time on a trampoline by bending your legs and using them as shock absorbing pistons, should you feel uncomfortable.
Roller coaster rides need to fall into the Goldilocks zone to be considered for amusement parks. Too few g's and the ride is boring. Too many g's and the ride is dangerous. Within this Goldilocks zone there needs to be a range of rides that accommodate the varying needs of the amusement park visitors. In rides for children, the G-forces of a ride typically lie in the range  –
– (e.g [5]). Family rides extend the range to
  –
– . Thrill rides often involve
  or more, as well as negative g's, where the body lifts from the seat, and must be held in place by the restraint system.
The time derivative of acceleration is referred to as jerk. The higher derivatives are called snap, crackle and pop[ 3], followed by the less known term lock. Just as we experience acceleration differently to velocity, we experience jerk differently to acceleration, snap differently to jerk and so on for the higher derivatives. In this paper we will discuss jerk and snap and present some practical examples of these.
2. Theory, measurement and experiences of ride features
If you enjoy roller coasters, you will most probably know what to expect from the ride, just by looking at a photo, such as figure 1. The long straight launch to the left provides sufficient kinetic energy for the coaster train to pass the top. You may also recognise the light grey stators of the linear synchronous motors (LSM) on the track. During the launch, your body will feel a force from the back of the seat [6]. During the long drop that follows, you will feel much lighter than normal, possibly even weightless as you move faster and faster. In the large valley that follows, you will instead feel a few times heavier than normal.
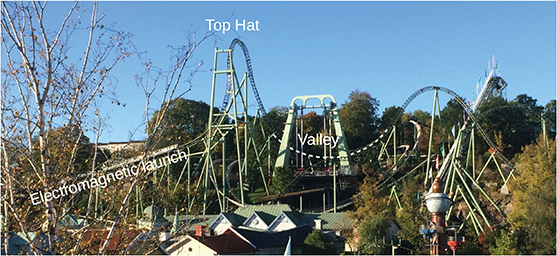
Figure 1. The second electromagnetic (LSM) launch of the Helix roller coaster, followed by an inverted Top Hat and a large valley.
Download figure:
Standard image High-resolution imageRoller coasters depend on the conversion of energy between potential and kinetic energy. Traditional roller coasters start with a lift hill, bringing the train to the highest point of the ride, where it has maximum potential energy. As gravity pulls the train down the first drop, the speed and kinetic energy increases and the potential energy decreases until the train starts to move up again, gaining potential energy while losing kinetic energy.
Less traditional roller coasters are instead given initial kinetic energy through a launch, where the energy may be supplied by some other means such as electromagnetic propulsion, hydraulic launch, compressed air or a mechanical spring which accelerate the train from 0 m s−1 to a maximum speed in a few seconds (see e.g. [7]). Electromagnets can also be used for a launch during the ride, as shown in figure 1. They can also be used to regulate the speed and stop the ride.
Some energy losses due to air resistance and rolling friction are unavoidable. However, these energy losses are surprisingly small and meaningful estimates of the speed can be obtained from elevation differences from the highest point or from a point with known speed, using the relation for free fall, giving

The maximum speed after a first drop is always slightly smaller than expected from equation (1) based on the elevation difference. Similarly, launch coasters never reach the maximum height calculated from the initial speed. Figure 2 shows the relation between maximum speed and maximum height for a number of roller coasters of different heights.
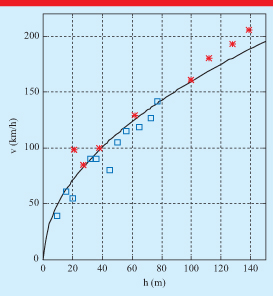
Figure 2. Relation between maximum speed and maximum elevation difference for a number of roller coasters. The solid line shows how the speed at free fall depends on the distance fallen. The blue squares denote a few traditional roller coasters with lift hills, whereas the red stars mark launch coasters.
Download figure:
Standard image High-resolution image2.1. Visual estimate of forces in a roller coaster valley
Equation (1) can be used to express the speed v at the bottom of the valley in figure 1 in terms of the speed v0 at the top and the elevation difference ΔH. For the estimates, we neglect energy losses and also contributions due to the finite length of the roller coaster train [8, 9]. Using v0 > 0, this gives an estimate of the upwards centripetal acceleration ac at the bottom of the valley in terms of the radius of curvature, R:
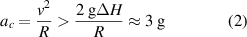
where we have used the photo to obtain an approximation of the ratio ΔH/R ≈ 3/2, as indicated in figure 3.
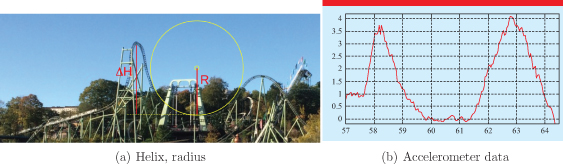
Figure 3. (a) Estimate of the relation between the elevation difference and the radius of curvature, resulting in an expected normal force of 4mg at the bottom of the valley. (b) Detail of the accelerometer data from the end of the launch, over the top and into the drop and the valley .
Download figure:
Standard image High-resolution imageThe normal force needs to compensate for the force of gravity and provide the force required for the centripetal acceleration. The force from the ride on your body should then be close to N = 4 mg, which is also found in the accelerometer data [3, 6].
An interesting aspect of the forces is that they do not depend on the scale, only the ratio between elevations and radii (as long as we neglect energy losses). Double height would lead to speeds that are higher by a factor of  and a time exposure to the forces for a period that is longer by the same factor.
2.2. Comparison with accelerometer data
Figure 3(b) shows the accelerometer data from the end of the launch, over the top and into the drop and the valley of the Helix roller coaster. The maximum force on the rider is found to be close to the 4 mg predicted from the visual analysis above. The graph also shows small oscillations in the data, in particular after rapid changes—large jerks—e.g. when the train leave the linear launch section of the track and enters the curve to move uphill. This can be attributed to 'ringing', and depends on the resonance frequency of the sensor within the measurement device.
2.3. Heads against the headrest
Every roller coaster you have ever ridden upon has a pre-ride safety briefing. It is likely to include instructions to keep your heads back or keep your heads against the headrest. Why is this important? Your head has mass and inertia. If there is a gap between your head and the head-rest during a launch your head will impact the head-rest and give you an unpleasant knock on the back of your head. With extreme rides you may experience a mild traumatic brain injury (m-TBI), unless the head is supported. Mild TBIs were found to have the potential to lead to long-lasting cognitive and motor deficits in mice, increasing the risk of future behavioural, neurological, and other disorders [10]. The risk of experiencing more severe injuries was found to increase with each repeated m-TBI. After a severe bump you may experience a headache, dizziness, nausea, or a combination of these symptoms, or simply a stiff neck. Sudden changes in forces can excite vibrations in a range of frequencies, discussed in the next section.
3. Vibrations and the human body
Vibration is motion of a body (or part of a body) about an equilibrium position and can be seen as a special case of acceleration. Vibration is generally disliked and can be annoying. Our sensitivity to mechanical oscillations range in frequency from well below 1 Hz to up to at least 100 kHz. This range of sensitivity is thus much broader than our hearing.
The human response to vibrations has been studied extensively in the context of ride comfort in automotive vehicles (see e.g. [11]), considering both whole-body vibrations and local vibrations. Whole-body vibrations are transmitted to the human body via a supporting surface, for instance the seat, or a floor. For local vibrations, parts of the human body are in contact with a vibrating area. The most common local vibrations people experience during vehicle riding include hand- and feet-transmitted vibrations.
Our bodies are essentially elastic and this elasticity allows many internal modes of vibration. The damping within our bodies can be less than critical in some of these modes. Differential modes of various body parts with resonant amplification can occur [12], and vary from train passenger to passenger, and with changes of axis and position of the passenger in the train. Table 1 shows the resonance frequency ranges for various parts of the human body, based on [13]. All these natural frequencies are avoided by ride design engineers.
Table 1. Approximate frequency ranges of various human body components, from [13].
| Body component | Frequency range (Hz) |
|---|---|
| Spinal column (axial mode) | 10–12 |
| Shoulder girdle | 4–5 |
| Hand grip | 50–200 |
| Head (axial mode) | 20–30 |
| Eyeballs (internal structures) | 25 |
| Chest wall | 50–60 |
| Abdominal mass | 4–8 |
| Legs (rigid posture) | 20 |
| Legs (flexed knees) | 2 |
3.1. Human vibration sensing and sensitivity
Our bodies have two direct vibration sensory mechanisms, both of which are applicable to roller coasters. The first mechanism is our balance organs within our ears while the second mechanism is the small mechano-receptors distributed around our body [14]. Vibration may also directly influence the central nervous system by altering levels of arousal and providing surplus information for the brain to deal with. If this is the case then it would be expected that cognitive skills, such as concentration and memory would be affected. Although the effect of vibration on the human body seems to be poorly understood, it has been hypothesised that there are two distinct regimes which can affect our performance. These are 0.1 to 1 Hz in which kinetosis (motion sickness) is important, and 1 to 10 Hz in which resonances of the body dominate. In addition to effects on comfort during car rides [11], research has also investigated the effect on performance, particularly involving motor co-ordination skills and visual performance. The research in the area of human vibration [15–17] has been primarily for the military where the exposure duration is considerably longer than the duration of a typical roller coaster ride. Nevertheless, one could assume with reasonable confidence that staying below exposure limits from these studies would provide safe exposure limits for use by roller coaster designers.
3.2. Jerk, vibration, resonance and ringing
Rapid changes in forces lead to rapid changes in acceleration. However, these rapid changes need to be transmitted between the components of the body, that do not all accelerate together, since our bodies are not rigid. Consider for example a football player hit in the face by a ball. If the player and the ball had been rigid bodies the forces would theoretically be infinite. Slow motion video footage shows the face is not rigid and work ( ) is performed on the player and the ball as they both deform. Even with the damping provided by the elasticity of the ball and the soft facial tissue, the force on the player will be high but of a relatively short duration, giving large values for acceleration, jerk and snap. High speed video will also reveal that after separation both the face and the ball will oscillate at their respective natural frequency, albeit highly damped.
Jerk and snap can lead to breakage. Let us illustrate with the example of the traditional 'inertia ball' demonstration, where a massive ball is suspended on a string and an identical string is attached to the bottom of the ball. A slow pull will lead to the top string breaking, whereas a rapid jerk causes the bottom string to break, since the ball would need a much larger force to achieve the acceleration of the bottom string. This concept can be transferred to that of a ligament that connects two bones, or a muscle to a bone. If the ligament is lightly jerked, it pulls whatever bone it is attached to along with it. If a ligament is jerked hard (or one of the segments it is attached to is accelerated quickly), its tensile strength may not be able to handle the change in force and it may tear. Further, consider that repeated jerks are analogous to repetitive micro-trauma; multiple mild or medium jerks may lead to fatigue in the ligament and eventual failure.
Examining the actual jerk, as opposed to previous studies of linear and angular accelerations, may provide a better indicator of repetitive micro-trauma severity.
A very large jerk involves a rapid change in force and acceleration which may be approximated by a step function. It can excite resonances in a broad range of frequencies, and the oscillations can continue long after the application of the force. (Try lifting a slinky and then hold your hand still and observe the 'ringing' as the oscillations continue.) As the train travels along the track it can excite the track and this multi-resonant vibration can be felt by queuing riders as the vibration travels ahead of the train at more than 5 000 m s−1 and exciting the supporting structure and the wall panels lining the queue. Some roller coaster designers use this noise and vibration to good effect as it increases the arousal level of the queuing patrons, whereas in other situations the tracks are filled with sand to reduce the noise level.
4. Recommendations for maximum forces in amusement rides
There are National Standards in most countries around the world for amusement rides and devices. As the majority of rides are manufactured in Europe and North America, there has been a move toward the internationalisation of amusement rides and devices. There are three dominant amusement rides and devices standards where there has been a convergence in the technical requirements. These are: CEN, ASTM and ISO. One important document is the ISO 2014 Technical Specification titled Biomechanical effects on amusement ride passengers[ 18].
Our bodies are not point particles and orientation matters. The standards thus give different limits in different directions, to account for the non-symmetry of our bodies, as discussed in [3]. For bio-mechanical effects, the forces are conventionally defined in terms of a coordinate system fixed to the body, with the 'vertical' z-direction pointing along the spine towards the head, as shown in figure 4.
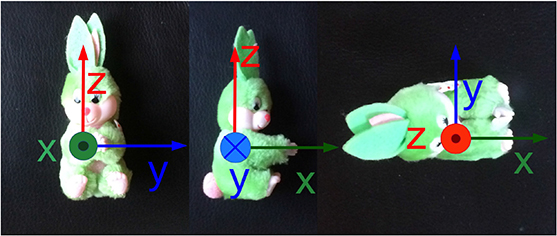
Figure 4. Biomechanical coordinate system.
Download figure:
Standard image High-resolution imageMaximum recommended forces in other directions can be expressed in terms of 'egg graphs', shown in figure 5, with accelerometer data from the roller coaster Valkyria included for illustration. As seen from the graphs, the forces are well below the recommended maximum limits specified by the 'egg graphs'. Figure 6 shows the accelerometer data for the z-direction during a ride in the Valkyria roller coaster, together with an analysis of acceptable forces and rates of change of acceleration, discussed in section 5.
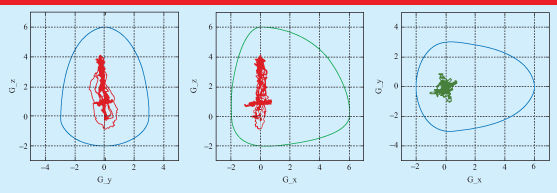
Figure 5. Egg graphs for maximum forces in different directions, together with accelerometer data, for the Valkyria roller coaster.
Download figure:
Standard image High-resolution image
Figure 6. Vertical accelerometer data for a ride in Valkyria. The standard Biomechanical effects on amusement ride passengers[ 18] recommends that 'the acceleration exposure of a patron always be beneath the envelop formed by the trapezium which is drawn by applying the onset acceleration, the maximum constant acceleration, and trailing edge acceleration'. The recommended maximum rate of onset (jerk) is  s. The drop rate of at least 0.8 g s−1 for the envelop limits the total duration of the exposure. These limits are marked with dashed lines. The thin horizontal lines represent maximum allowed duration for each level of exposure, with different colours to mark the different time limits for different levels. The thick horizontal lines indicate an approximation of the actual duration.
Download figure:
Standard image High-resolution imageThe safety standards also recommend maximum duration of exposure to different forces. For pelvis to head (z-direction), the maximum force of 6 mg should not last for more than 1 second, and a force of 5 mg for a maximum of 2 seconds. Lower forces can be tolerated for longer times. The periods of 4 mg shown in figure 6 were well below the 6 second recommended limit.
In addition to these limits, there are also limits for how fast these forces can grow (15 g s−1) (i.e. the maximum jerk), as well as how slowly they can drop after a maximum length exposure (corresponding to a jerk of −0.8 g s−1). Figure 6 shows the accelerometer graph for the whole Valkyria ride, together with an analysis showing that it falls within the recommended limits. Although the various amusement rides and devices standards do limit the G forces and also the jerk, no limits are provided for the rate of change of the jerk (i.e. the snap).
5. Jerk and snap in a roller coaster dive
In an earlier paper we analysed the jerk and snap in relation to trampoline bouncing, where the transition from free-fall to contact with the trampoline bed gave a jerk which could be approximated by a step function [3]. The time derivative of a step function is infinite and a Dirac delta function could be used to describe the snap during trampoline bouncing. These rapid changes can induce oscillations in a broad frequency range, not only in the sensors but also in the human body.
Roller coaster designers aim to avoid such singularities and to minimize jerk and snap to ensure that neither the passengers nor the structural framework are subjected to abruptly changed forces. Damped roller coaster seats and headrests slow the transmission to the human body of changed accelerations of the roller coaster train, thus reducing jerk and higher derivatives on the rider. Elevated jerk and snap exposure levels are uncomfortable and can result in bodily harm and also lead to structural fatigue and reduce the life of the roller coaster's structural elements.
In this section we first analyse forces, as well as jerk and snap, during and after the roller coaster dive shown in figure 7. It is worth noting that in the context of biomechanical effects, jerk and snap refer to derivatives of the G forces in the rider coordinate system.

Figure 7. Screenshots at 0.2 intervals of the initial drop of the dive coaster Valkyria. The distance between the first and third row is 3.0 m.
Download figure:
Standard image High-resolution image5.1. Forces during the dive
Figure 7 shows a sequence of screen shots from a video of the first drop of the dive coaster Valkyria. The valley following the drop is underground and thus invisible, unless you are on the ride. However, an accelerometer taken along on the ride can reveal the forces on the body.
Figures 1(b) and 8(b) show the accelerometer data in the long drops and valleys of the Helix and Valkyria roller coasters (in both cases, only the component orthogonal to the track is shown). We can note that the force on the body at the bottom of the valley is close to 4 mg, for both coasters.
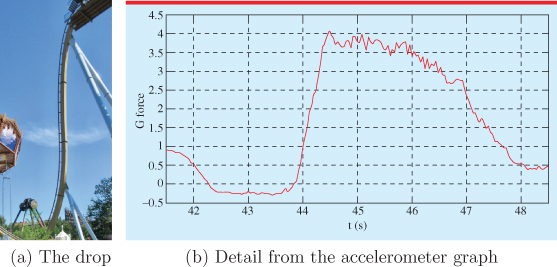
Figure 8. (a) Side view of the track of the Valkyria dive. (b) Accelerometer graph for the dive underground in Valkyria following the drop shown in figure 7.
Download figure:
Standard image High-resolution imageWe can also note that the force during the dive in Valkyria does not quite correspond to a free fall ('zero g'), but has a negative component, {indicating that the coaster seat restraint pushes you toward the track. During the dive, this force is horizontal and does not influence the downward acceleration. The negative value can be attributed to the shape of the track being a more narrow parabola than would correspond to an object leaving the top of the track in pure free fall (figure 8(a)). You may not notice this force as you ride, unless you have been made aware of it. The slight pressure from the restraint system is more likely to be perceived as just providing comfort during a scary drop.
As we compare the forces in the large valleys of Helix and Valkyria, shown in figures 3(b) and 8(b), we can also note that forces from the ride between 3.5 mg and 4 mg are experienced for considerably longer times on Valkyria than on Helix, although both are well below the recommended 6 second limit for 4 mg force, discussed in section 4.
5.2. Jerk and snap in a valley
As the drop shown in figure 8 turns into a valley, the forces on the body change rapidly, from slightly negative G's to nearly  . Figure 9 shows the time derivative of the radial G force—the jerk—which reaches about half of the permitted 15 g s−1. It can be noted that this transition feels very smooth when you ride it.

Figure 9. Detail of the accelerometer graph in figure 8 with the derivative - jerk (in blue) reaching about 7g/s. The dashed green lines mark the largest positive and negative derivatives of the jerk. The increasing jerk corresponds to a snap of 22g/s2 and the period with decreasing jerk has a snap of  .
.
Download figure:
Standard image High-resolution imageThe jerk, in turn, also grows rapidly. A numerical derivation of the jerk hints to a smooth shape, although the effect of the sensor noise becomes more prominent with every differentiation. Instead we indicate in figure 9 the maximum size of the snap as dashed lines: The derivative of the jerk reaches a magnitude of about 22 g s−2 in the beginning of the valley and then rapidly drops to −32 g s−2 as the G force reaches it is maximum and the jerk drops to zero.
5.3. Clothoids and other track shapes for reduced jerk and snap
Roller coaster tracks involve changes between different radii of curvature. In older roller coasters, individual track segments had different radii of curvature, whereas modern coasters involve smooth transitions, which can be obtained using clothoids and space curves [19].
What shape of the track could lead to the time dependence of the force, shown in figure 8? An extended period of nearly constant G force is possible (see e.g. [20, 21]). However, the transition from a nearly linear vertical track requires a transition curve, such as the clothoid, which is based on a Cornu (Euler) spiral (known from single-slit diffraction in optics). The Cornu spiral has the property that the radius of curvature is inversely proportional to the distance, s, from a starting point (the 'center' of the spiral, which extends both ways from this point) and is discussed in more detail in the appendix.
After the dive into the valley, the track turns into a loop, as seen in figure 10. The top segment is possibly with a circular arc, but following a valley with constant G force may also be a segment constructed to give a constant centripetal acceleration [20]. To compare the track shapes with the accelerometer data, the shapes needs to be combined with a time dependence of the motion and forces. The radial or vertical component of  can be expressed as

where v = ds/dt and  .
.
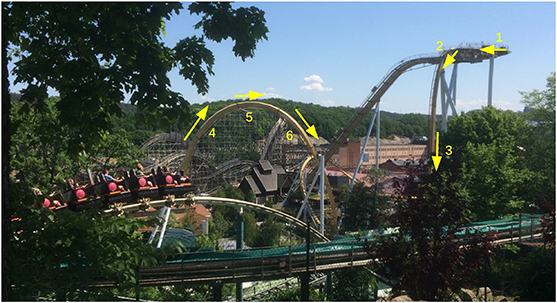
Figure 10. A view of the Valkyria dive coaster together with the inversion following the valley. The yellow arrows indicate the direction of the train, starting with a panoramic tour of the Liseberg amusement park at the top of ride (1), a brief hold looking down (2) before the dive (3) into the an underground tunnel. The train then emerges from the underground tunnel to the left (4) and moves to the right, upside down over the hill (5) and the down on the other side (6).
Download figure:
Standard image High-resolution imageIn an attempt to reproduce the accelerometer graph of the data collected on the ride, shown in figure 8(b), we constructed a track shape from a combination of rules together with the resulting G forces. Although the result, shown in figure 11 is less than perfect, the main features of the accelerometer data are reproduced. The real track is shown in figure 10.

Figure 11. (a) A simulated track shape starting with a clothoid drop into a section characterised by a constant value for  , followed by a short section with constant centripetal acceleration matched to a half circle. (b) Time dependence of G forces corresponding to the track shape in (a), to be compared with the measured data in figure 8(b).
Download figure:
Standard image High-resolution image6. Conclusion
The human tolerance to acceleration has been established and is well understood. Jerk is rarely mentioned in the teaching of physics and snap is never mentioned. Minimising jerk and snap are an important consideration in the design of amusement park roller coaster rides. The human tolerance to jerk and snap is not well understood. Nevertheless, designers of roller coaster rides limit these to improve the passenger comfort of their rides. Roller coaster passengers need time to sense acceleration changes and adjust their muscle tension or suffer conditions such as whiplash. Even when human safety is not an issue physicists and engineers expend considerable design effort minimising jerk and eliminating snap within roller coaster rides to reduce maintenance, extend the life of the ride and improve the experience for all users.
: Appendix: Jerks for clothoids and other track shapes
The z-component of the G force for a given part of the track can be written as  , where r is the local radius of curvature and θ is the slope of the track. The time derivative of Gz
can be written as
, where r is the local radius of curvature and θ is the slope of the track. The time derivative of Gz
can be written as
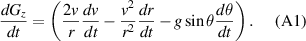
The change in speed depends on the angle of the track:  ; the angular velocity depends on the speed; and the radius,
  . The general expression (A1) for dGz
/dt can thus be rewritten as
. The general expression (A1) for dGz
/dt can thus be rewritten as
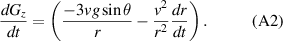
What differs between the track shapes is the rate of change of curvature. For a track segment that can be described as a circular arc, the radius r is a constant and the last term in equation (A2) vanishes. The time derivative for a segment with constant radius can thus be written as  . For segments with constant G force, obviously dGz
/dt = 0. For segments with constant centripetal acceleration, the first term in equation (3) is constant and, using
. For segments with constant G force, obviously dGz
/dt = 0. For segments with constant centripetal acceleration, the first term in equation (3) is constant and, using  , the derivative reduces to
  .
.
A.0.1. Clothoid track segments
Clothoids are more complex: They are part of Cornu spirals (figure A1), which have the property that the radius of curvature is inversely proportional to the distance, s, from a starting point (the 'center' of the spiral, which extends both ways from that point), i.e. r = 1/ks. This rule can be implemented in a code by expressing the change in angle along the curve as d θ/ds = ks, as discussed in [20]. Figure A1 shows a generic Cornu spiral. No real track includes segments with repeated smaller and smaller radii with larger and larger G forces for every full turn.

Figure A1. A Cornu spiral is characterised by a radius or curvature inversely proportional to the distance from a starting point, marked here by a change of colour.
Download figure:
Standard image High-resolution image
For a clothoid segment of the track, the angular velocity can be expressed as  . The change in radius can be expressed in terms of the speed, distance and the constant k, giving
  . Using these expressions, equation (A2) can be rewritten as
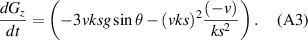
giving
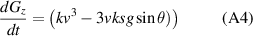
A.0.2. Continuous higher derivatives
An important observation is that all these expressions for dGz /dt can be differentiated - and differentiated repeatedly—without generating discontinuities. This is in contrast to shapes where the radius of curvature changes abruptly (as e.g. in classical Schwarzkopf coasters, where every track segment was bent to a well-defined radius of curvature [19]). However, even with smooth changes in the radius of curvature, abrupt transitions between different mathematical expressions for the shapes of the track segments lead to discontinuous time derivatives of the G force, as can be observed in figures 8 and 11. In real life the changes are damped and the jerk is not discontinuous, but the sudden change in jerk still leads to very large snap—and, of course, large higher derivatives such as the crackle and pop.
Biographies

Ann-Marie Pendrill is senior professor at Lund university, where she was the director of the Swedish National Resource Centre for Physics Education 2009–2019. Her research background is in computational atomic physics, but her more recent work has focused on various aspects of physics and science education. She has used examples from playgrounds and amusement parks in her teaching in physics, teaching and engineering programmes.

David Eager is an internationally recognized expert on the safety aspects of amusement rides, trampolines, playgrounds, and sports and recreation equipment. He chairs the several Australian Standards Committee and is Head of Delegation on the International Standards Organisation committees for Amusement rides and sports and recreation equipment. He is the Professor of Risk Management and Injury Prevention within the Faculty of Engineering Information Technology at UTS. He is a Fellow of Engineers Australia and a Chartered Professional Engineer. David is currently the UTS Assistant Student Ombud and is a past Deputy Chair of the UTS Academic Board. He has also been the Head of School, Mechanical and Mechatronic Engineering UTS.