
Abstract
An amusement park is full of examples that can be made into challenging problems for students, combining mathematical modelling with video analysis, as well as measurements in the rides. Traditional amusement ride related textbook problems include free-fall, circular motion, pendula and energy conservation in roller coasters, where the moving bodies are typically considered point-like. However, an amusement park can offer many more examples that are useful in physics and engineering education, many of them with strong mathematical content. This paper analyses forces on riders in a large rotating pendulum ride, where the Coriolis effect is sufficiently large to be visible in accelerometer data from the rides and leads to different ride experiences in different positions.
Export citation and abstract BibTeX RIS

Original content from this work may be used under the terms of the Creative Commons Attribution 3.0 licence. Any further distribution of this work must maintain attribution to the author(s) and the title of the work, journal citation and DOI.
1. Introduction
Traditional amusement ride related textbook problems include free-fall, circular motion, pendula and energy conservation in roller coasters, where the moving bodies are typically considered point-like. However, an amusement park can offer many more examples that are useful in physics and engineering education, many of them with a strong mathematical content. These examples are well-suited for mathematical modelling and the results can be compared to authentic accelerometer data, as well as to data from photos and video clips.
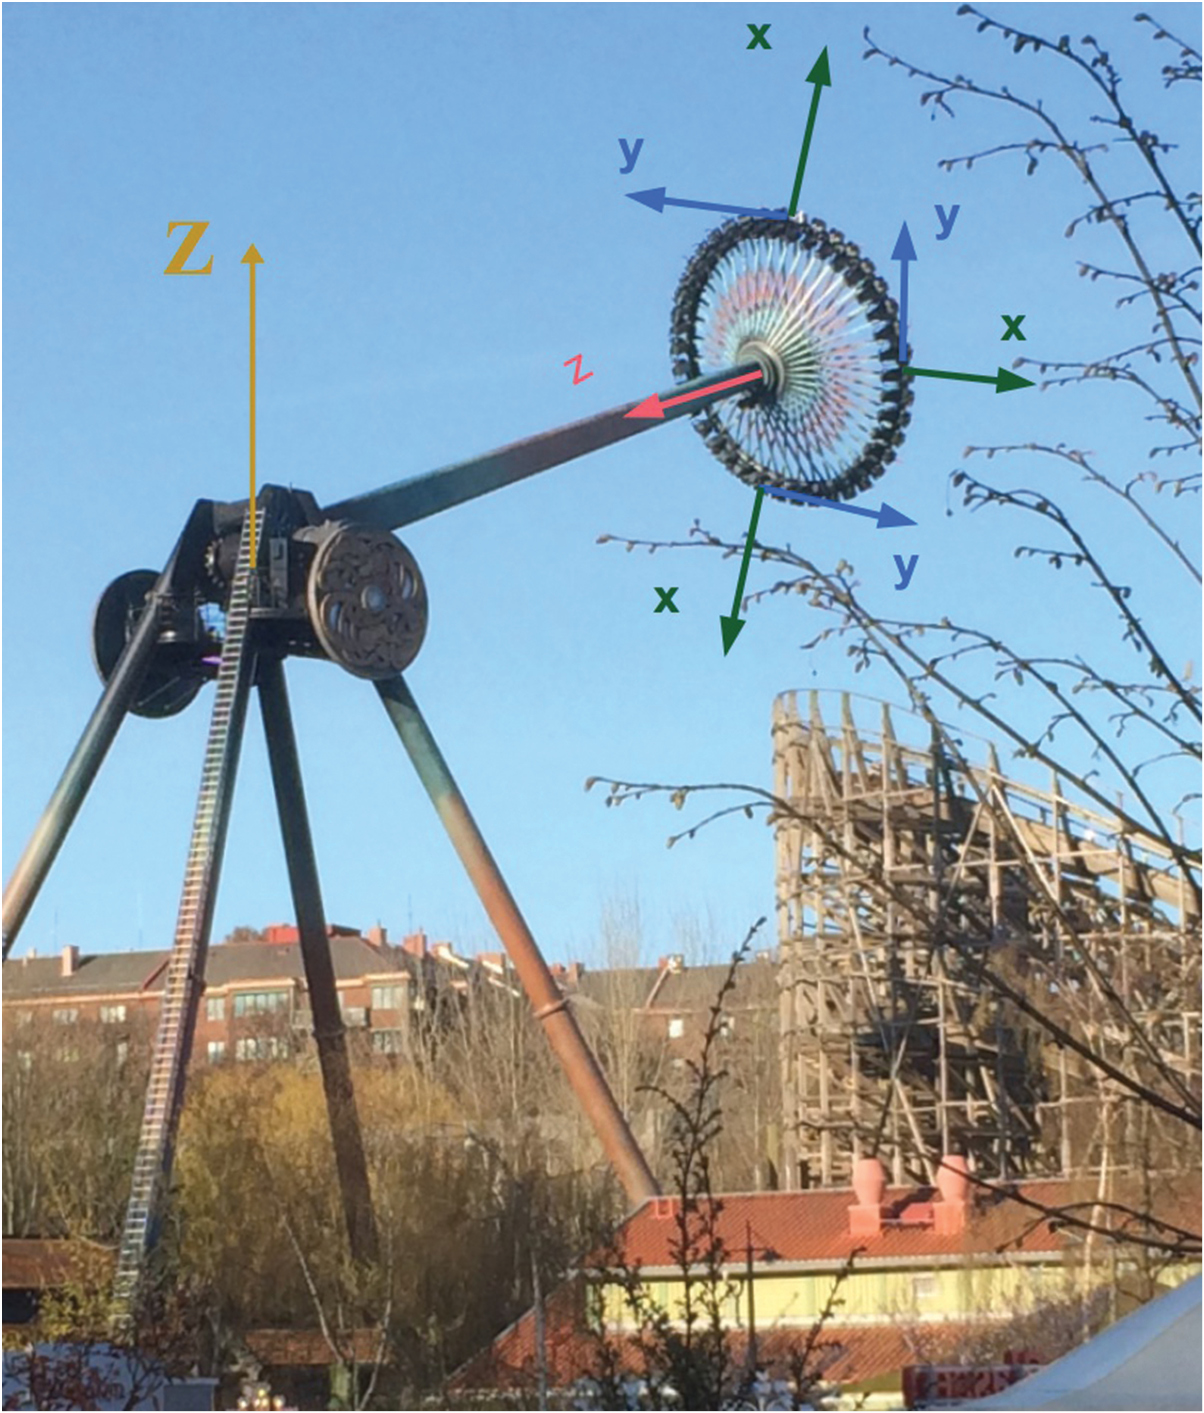
Motion in three dimensions is common in real-life applications. Describing 3D motion including combinations of acceleration and rotation is a challenge where mathematics plays a central role. As students struggle to visualize generalized 3D motion, including rotating arms, links, shafts, cranks and disks, reference to real-life concrete examples is useful. In this work, we study in some detail the 'Gyro Swing' [1] giant pendulum ride Loke (figure 1), which combines rotations around two axes. The circle of 40 riders rotates as the pendulum swings back and forth. The motion around the edge of the circle leads to a Coriolis effect that is sufficiently large to be visible in the accelerometer data from the ride. In earlier work, we discussed how the Coriolis effect can be observed even in small children's carousels—or even better in a slowly rotating observation tower—by bringing a small, soft object on a string, as a miniature 'Foucault pendulum' [2–4].
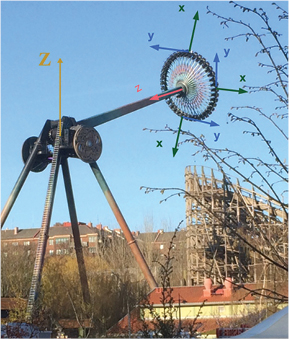
Figure 1. The Gyro Swing Loke at Liseberg is a pendulum ride. The circle with the 40 riders has a radius of 4 m and rotates up to 5 times per minute. The length of the pendulum is 24 m. The Z axis is part of the fixed coordinate system, whereas the x, y and z represent the comoving coodinate system for riders in different postions, as discussed in section 2.
Download figure:
Standard image High-resolution image2. Collecting and analysing data
Using apps such as Physics Toolbox Roller Coaster [5] or PhyPhox [6], today's students can easily measure acceleration and rotation. It is important that students are acquainted with the data collection tools before embarking on data collection in an amusement park. Many problems can be avoided if the students have the opportunities to test the equipment in familiar and simple situations, such as elevators or playground swings, where the motion can be easily understood and related to the data collected. Students need to realise that accelerometers do not measure acceleration but the components of the vector  in a comoving coordinate system. This insight is needed to understand the accelerometer data collected in pendula or roller coasters. The interpretation of the data from smartphones offers good practice in identifying coordinate axes [7–9], useful also in interpreting data from other acceleration and rotation sensors commonly used in high school physics classes [10, 11]. Figure 2 shows the coordinate system used in the data collection as well as in the analysis of forces on the rider [12].
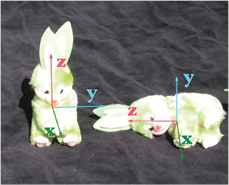
Figure 2. Definition of the rider-fixed coordinate systems commonly used in analysing biomechanical effects on riders. These are also the axes of an accelerometer carried along on a ride, e.g. in a data vest. The x, y and z axes in this comoving system are often referred to as 'longitudinal', 'lateral' and 'vertical', respectively. The biomechanical effects on the body are determined by the forces along these axes [12].
Download figure:
Standard image High-resolution image3. Pendulum rides
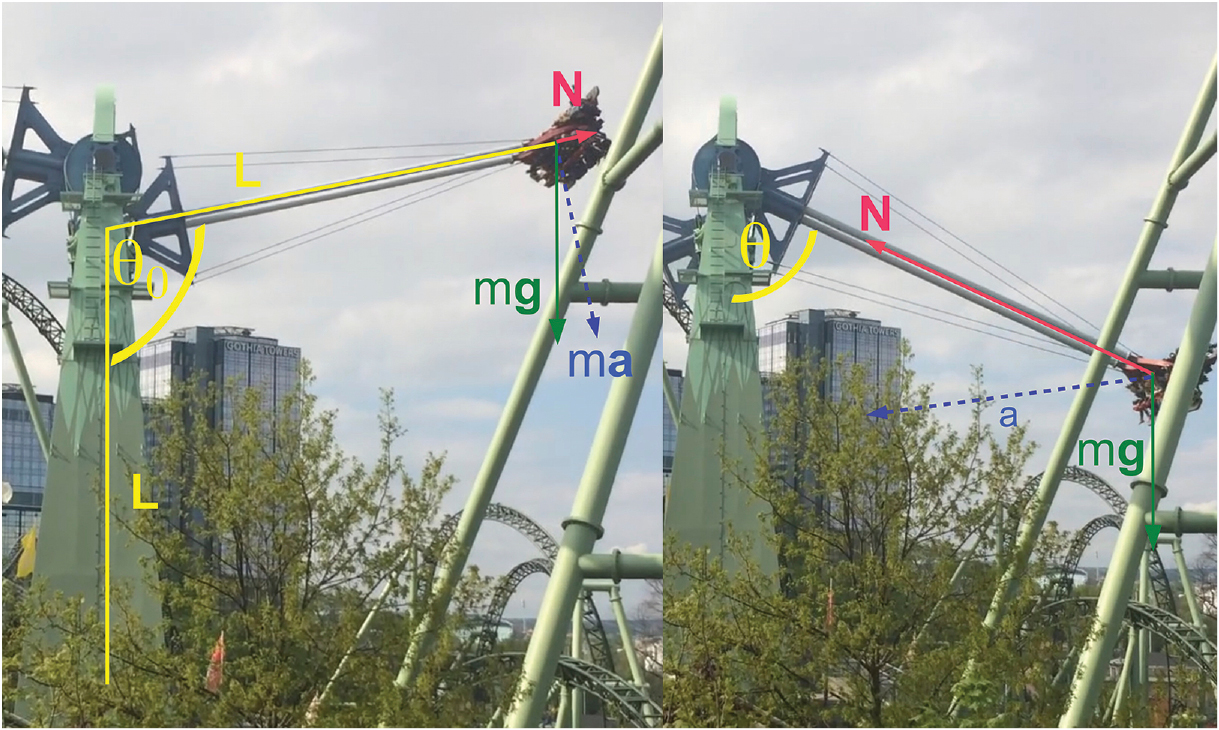
We consider first the purely 2D motion in the Screamin' Swing pendulum ride, shown in figure 3. The forces on a rider with mass m during different parts of the motion of this ride are illustrated in figure 4. At the maximum angle  the force on the rider is
  towards the rotation axis of the pendulum and the acceleration is purely tangential,
  . For smaller angles, the circular motion also requires a centripetal acceration,
  , towards the rotation axis. To evaluate the speed for different angles, the conversion between potential and kinetic energy can be used: For a pendulum of length L, the centre of mass elevation differs by
  between the highest and lowest points, giving an expression
  for the speed
  at the lowest point. The force from the swing at the lowest point is then obtained as
  , independent of the pendulum length. For an arbitrary angle, the centripetal acceleration is given by
  and the force from the swing on the rider is
  .
.

Figure 3. The Screamin' Swing pendulum ride Uppswinget at Liseberg.
Download figure:
Standard image High-resolution image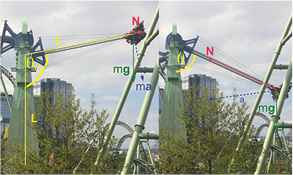
Figure 4. Forces on the rider at the turning point and at a smaller angle for the pendulum ride shown in figure 5.
Download figure:
Standard image High-resolution imageEven a relatively simple motion as a pendulum brings surprises when accelerometer data are collected; the data differ significantly from zero only in the axis in the direction of the chain. (Bringing along a soft mug with a small quantity of liquid in a swing leads to analogous surprises [9, 13–15]). This can be understood by noting that the tangential acceleration corresponds exactly to the tangential component of the acceleration of gravity, causing the tangential component of  to vanish. Figure 5 shows the radial component of the accelerometer data for the pendulum ride shown in figure 3. The corresponding data for Loke are shown in figure 6.

Figure 5. Accelerometer data for the pendulum ride Uppswinget (figure 3), showing the vertical (z) component of the force from the ride on the rider divided by mg. The largest values are obtained when the pendulum passes the lowest point, where the size of force from the ride on the rider is expected to be  . For the turning points, the value should be
  . Note that the deviation from a value mg for the normal force is twice as large at the bottom of the ride (and with opposite sign) compared to the values at the turning points.
Download figure:
Standard image High-resolution image
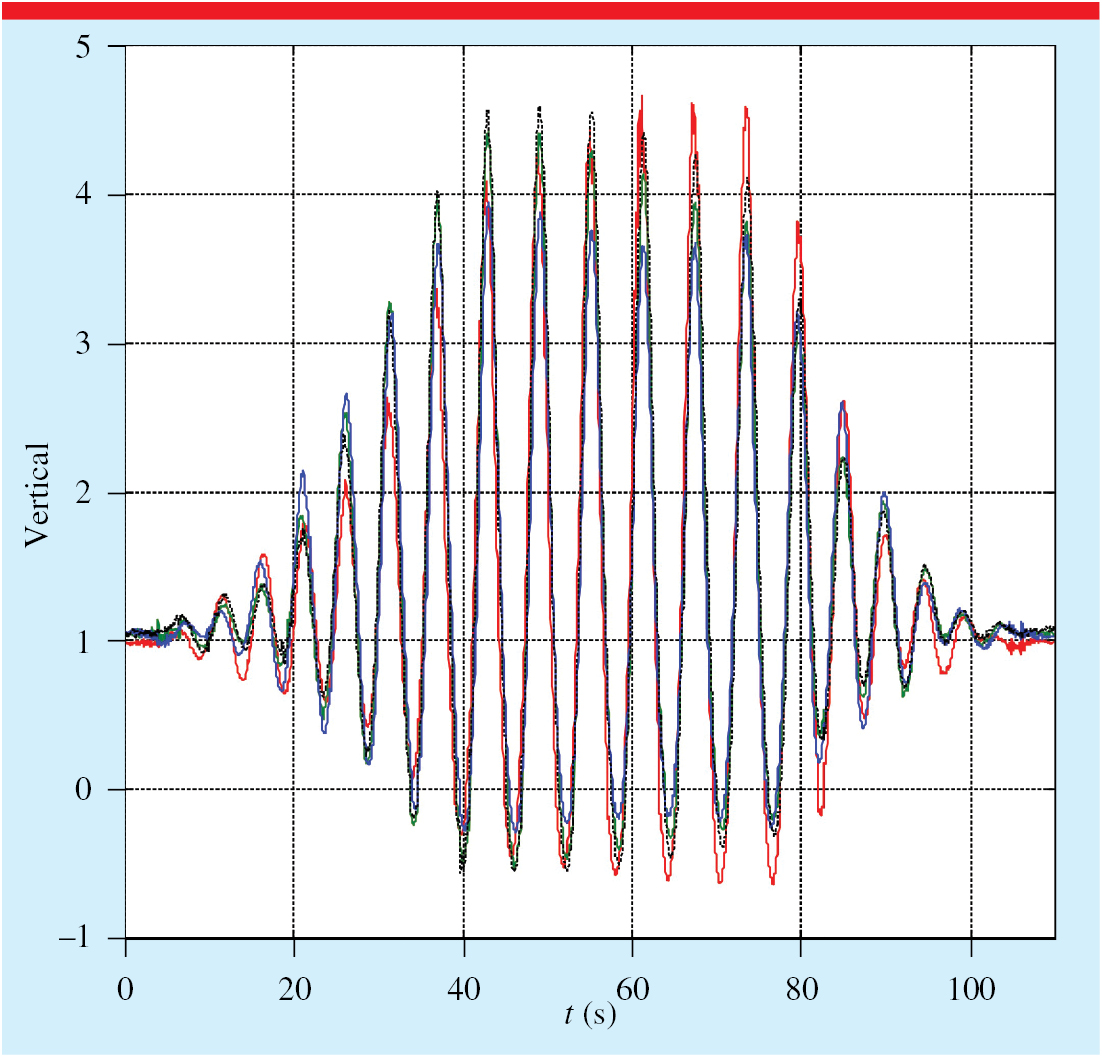
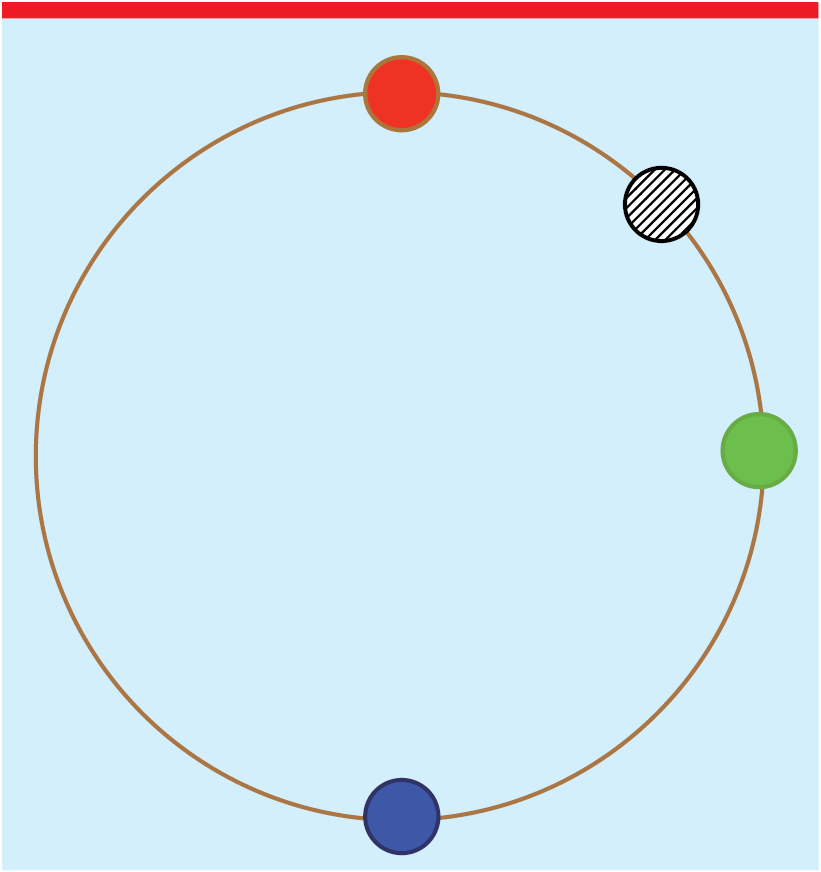
Figure 6. Accelerometer data from riders at four different positions during the ride in the Loke Gyro Swing ride. The positions are shown in figure 8. The red and blue graphs are for riders at opposite sides of the circle.
Download figure:
Standard image High-resolution imageFor a physical pendulum, where the mass is not concentrated in a point, the moment of inertia must be taken into account. However, the expressions for acceleration and velocities hold for a distance  , where Iaxis is the moment of inertia with respect to the rotation axis of the pendulum and
  is the 'radius of gyration'. For the rides considered here, the accelerometer values at the bottom of the ride indicate that the distance to the main rotation axis is close to the radius of gyration.
3.1. Angular velocities
The mathematical treatment of a pendulum typically focuses on the angle θ, angular velocity,  and angular acceleration,
  , giving the relation
where L is the length of the mathematical pendulum, or the radius of gyration for a physical pendulum. For small angles  and the period for the pendulum is then given by
  . Large angles lead to longer pendulum periods [16]. This was also examined in a recent paper using smartphones [17]. For the Gyro Swing Loke (figure 1), with a length L = 24 m, the expected period for small angles becomes T = 9.8 s. For
  , the theoretical expressions give a
  increase in the pendulum period, giving
  s for Loke.
For a maximum angle of  , we expect a normal force from the ride N = −mg/2. (The minus sign indicates that the force acts on the shoulders of the rider.) At the lowest point we expect a force N = 4mg, essentially consistent with the accelerometer data in figure 6. With a centripetal acceleration of
  at the bottom and a pendulum length L = 24 m, the velocity of the centre of the circle of Loke can be estimated to
  m s−1.
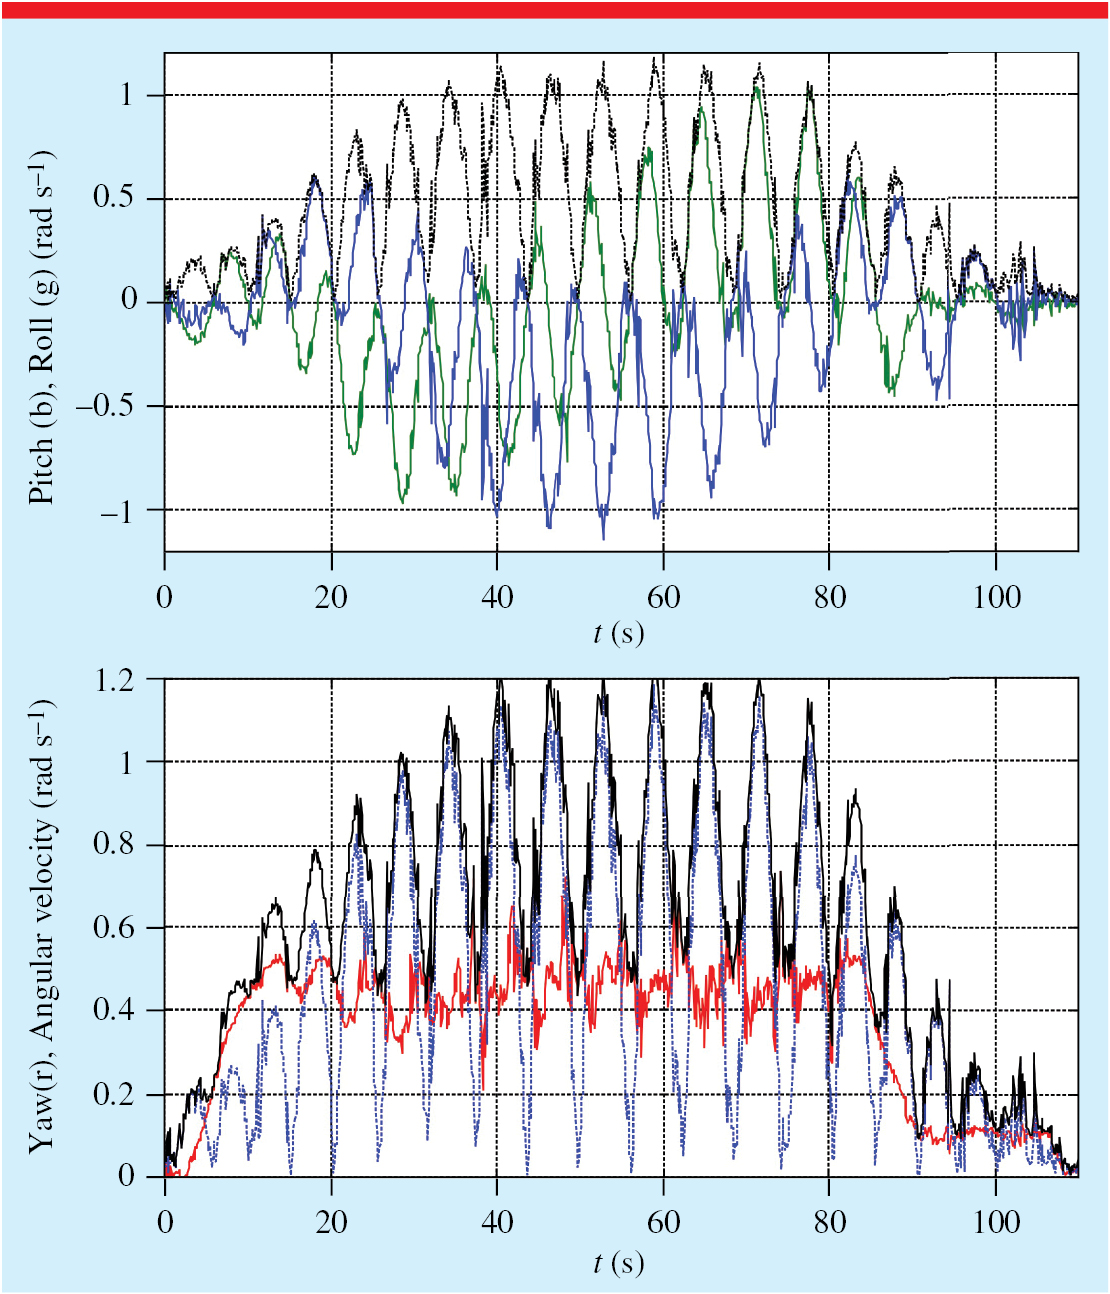
The angular velocity due to pendulum motion is  with a largest value at lowest points. For Loke we expect
  rad s−1, in good agreement with the data shown in figure 7, collected using a smartphone. Not long ago, measuring rotation was a specialised task, requiring equipment not generally available [18], whereas today, students can collect their own data, also for rotation, using apps such as Physics Toolbox Roller Coaster [5] or PhyPhoX [6].
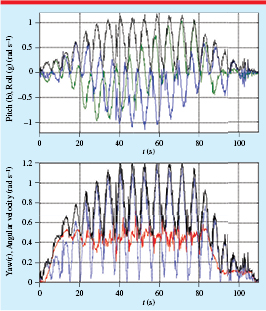
Figure 7. Angular velocities in Loke, as collected with a smartphone using Physics Toolbox Roller Coaster [5]. The upper graph shows the rotations around the x axis ('roll', green) and the y axis ('pitch', blue), together with the modulus of their vector sum (black). The lower graph shows the rotation around the y and z axes ('pitch', blue and 'yaw', red), as well as the modulus of the total angular momentum (black). The axes are defined in figure 2.
Download figure:
Standard image High-resolution imageDuring the amusement park physics day at Liseberg 2017, four high school students, each carrying a wireless dynamic sensor system [10] in a data vest, rode the Loke ride in different positions of the circle. The resulting data (figure 6) are in relatively good agreement with the expressions for a mathematical pendulum, but show small and position-dependent deviations, to be discussed below. Their positions in the ride are shown in figure 8.

Figure 8. Positions of the four data collecting students in the circle of seats in the Loke Gyro Swing ride, shown in figure 1.
Download figure:
Standard image High-resolution image4. A rotating circle at the end of the pendulum
In the Gyro Swing ride Loke (figure 1), the riders are seated in a large circle around the end of the pendulum arm. Curious students may be interested in understanding the small force corrections required for the motion of the rider relative to the centre of the circle and visible in the accelerometer data.
Since the riders look out from the ride, the x axis for the rider points away from the centre of the circle. The y axis points to the left of the rider, along the tangent of the circle. The z axis points from the seat to the head and is in the same direction for all riders at any given time. When the circle is in the lowest point, the z axis coincides with the Z axis in the fixed coordinate system, where we let the X be the pendulum axis, as shown in figure 9.
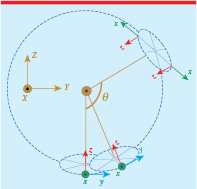
Figure 9. The fixed coordinate system, X, Y, Z and the comoving coordinate system for a couple of positions in Loke. The two lowest positions illustrate how the rotation of the circular plane leads to an additional acceleration (the Coriolis effect) due to the relative velocity.
Download figure:
Standard image High-resolution imageThe riders in the circle with radius  m rotating 5 times per minute, move with a tangential velocity
  , where
  m s−1 relative to the centre of the circle. (The direction of rotation changes between different rides.) The pendulum swings back and forth around the fixed X axis, with a time-dependent angular velocity
  , with a maximum value as the pendulum passes the lowest point
  rad s−1.
The direction of the fixed X axis can be written as a combination of the x and y axes, which rotate around the z axis, as discussed in an earlier work on the family ride Rockin' Tug [7]. The measured angular velocities are thus more complicated than for a simple pendulum as shown in figure 7.
4.1. Forces at the lowest point
A comparison between the different accelerometer graphs in figure 6 shows that for some positions, the forces at the bottom of the Loke ride is 4mg, as expected, whereas in other cases, the force is smaller or larger, and the deviation may be nearly mg/2. These corrections can be understood by considering how the motion of the circle of riders combines with the pendulum motion.
The pendulum motion leads also to a rotation  of the coordinate system for the circle, resulting in an additional acceleration

which is orthogonal both to the velocity relative to the centre of the star, and to the main rotation axis. This Coriolis effect can reach  depending on the position of the rider. When the circle is at the lowest point, this additional acceleration is upwards on one side and downwards on the other, requiring a larger (or smaller) 'vertical force' from the ride.
4.2. Forces at the top of Loke
When the pendulum motion in Loke has reached the turning point at the maximum angle, the angular velocity Ω for the pendulum motion is zero, and the Coriolis effect discussed above gives no contribution. However, the graphs in figure 6 show that even in the turning point the force depends on the location in the ride. Some students may want a closer investigation of these discrepancies, which can be understood by considering the angular acceleration in the pendulum motion:  . This angular acceleration influences the whole circle of riders, and size of the effect depends on the position in the circle. For riders in the highest position of the circle this leads to an additional acceleration in the z ('vertical') direction with the size
  . In the turning points, where
  , this gives a contribution
  . For a rider in the lowest point of the circle, the angular acceleration of the pendulum gives an equally large, but negative, acceleration in the z direction. Figure 10 shows these additional accelerations that depend on the location in the circle and account for the differences in the normal forces on the rider, seen in figure 6.

Figure 10. Forces at the highest points. The arrows in cyan indicate the additional acceleration due to the rotation of the circle as the pendulum starts moving down.
Download figure:
Standard image High-resolution image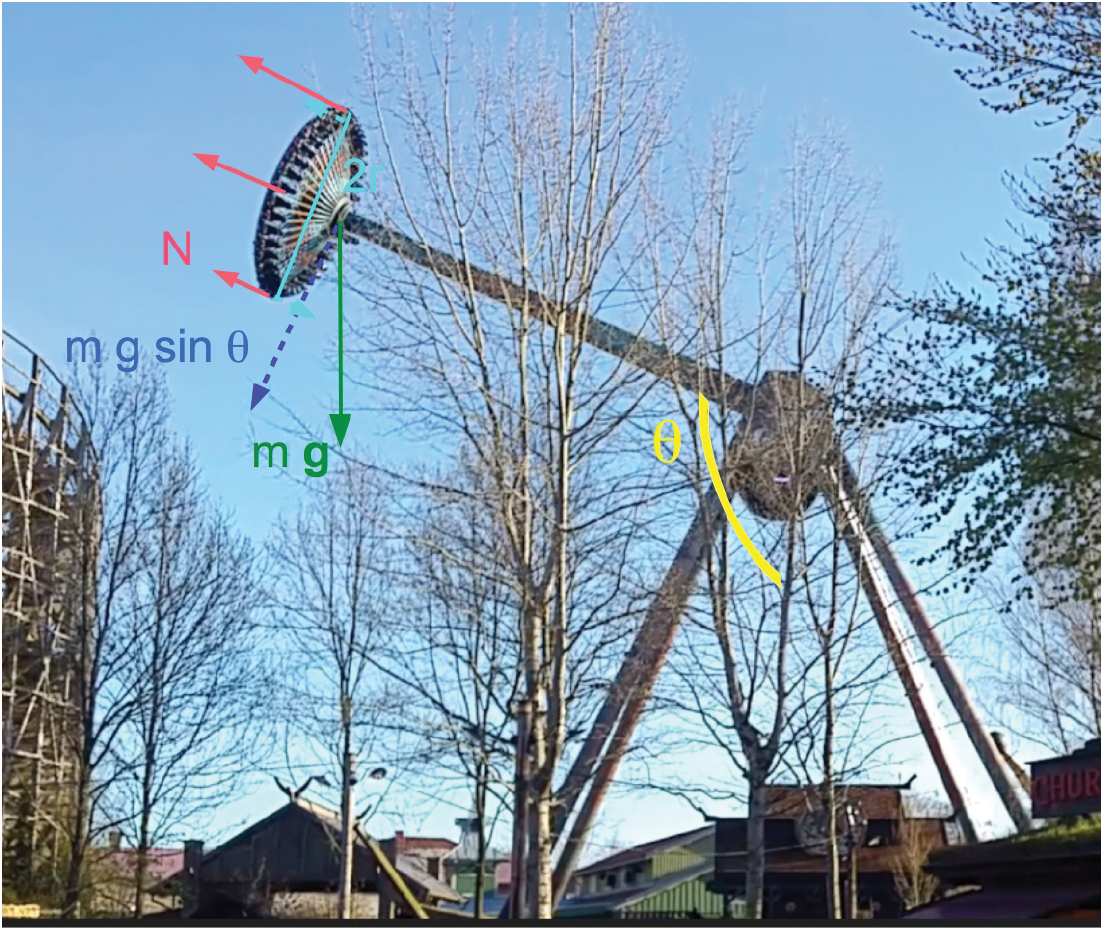
5. Discussion
For high school students, understanding the forces for a non-rotating pendulum may be sufficiently challenging. The data collected by the four students in different positions of the rotating pendulum illustrate that the ride experience depends on the position, which can be quite confusing. This paper is intented to provide teachers with background to discuss the small deviations when student questions arise. Students may also enjoy discovering the size of the Coriolis effect in the GyroSwing ride.
Biographies

Ann-Marie Pendrill is director of the Swedish National Resource Centre for Physics Education. Her research background is computational atomic physics, but her more recent work has focused on various aspects of physics and science education. She has used examples from playgrounds and amusement parks in her teaching in physics, teaching and engineering programmes. She enjoys studying physics in rotating systems.

Conny Modig is high school teacher at Gymnasium Skövde Västerhöjd. In his teaching he has been particularly interested in Amusement Park Physics and computer-based measurement technology in teaching. Conny has also been involved in teacher education in these areas.