
Abstract
Probing university students' understanding of direct-current (DC) resistive circuits is still a field of active physics education research. We report here on a study we conducted of this understanding, where the cohort consisted of students in a large-enrollment first-year physics module. This is a non-calculus based physics module for students in the life sciences stream. The study involved 366 students enrolled in the physics (bio) 154 module at Stellenbosch University in 2015. Students' understanding of DC resistive circuits was probed by means of a standardized test instrument. The instrument comprises 29 multiple choice questions that students have to answer in ~40 min. Students were required to first complete the standardized test at the start of semester (July 2015). For ease of reference we call this test the pre-test. Students answered the pre-test having no university-level formal exposure to DC circuits in theory or practice. The pre-test therefore served to probe students' school level knowledge of DC circuits. As the semester progressed students were exposed to a practical (E1), lectures, a prescribed textbook, a tutorial and online videos focusing on DC circuits. The E1 practical required students to solve DC circuit problems by means of physically constructing circuits, algebraically using Kirchhoff's Rules and Ohm's Law, and by means of simulating circuits using the app iCircuit running on iPads (iOS platform). Each E1 practical involved ~50 students in a three hour session. The practical was repeated three afternoons per week over an eight week period. Twenty three iPads were distributed among students on a practical afternoon in order for them to do the circuit simulations in groups (of 4–5 students). At the end of the practical students were again required to do the standardized test on circuits and complete a survey on their experience of the use of the iPad and iCircuit app. For ease of reference we refer to this second test as the post-test. The students' average score on the post-test was found to be ~25% higher than their pre-test score. The results of the iPad use survey show that the majority of students felt that the iCircuit app enhanced their learning of DC circuits.
Export citation and abstract BibTeX RIS
Introduction
An important section of the secondary (high) school and first-year university physics curriculum deals with direct current (DC) circuits involving resistors and batteries (i.e. sources of electromotive force (emf) or potential difference). A photograph of a DC resistive circuit involving three light bulbs is shown, for example, in figure 1. It is evident that there is a variation in the brightness of the light bulbs. Thus, a common question posed to first-year physics students is to predict the relative brightness of light bulbs in various combinations in an electrical circuit. In order to answer such a question, the students have to use Ohm's Law and Kirchhoff's loop and junction rules which are based on the conservation of energy and charge, respectively.

Figure 1. A photograph of a direct current resistive circuit with three light bulbs.
Download figure:
Standard image High-resolution imageIn recent decades extensive research has been conducted into the teaching and learning of electric circuits (e.g. [1–3] and references therein). There are two common misunderstandings students have [1]. The first is that current is used up progressively as it flows through the circuit. The second is that the battery (source of electromotive force) provides a constant current to a circuit irrespective of what other components are included in the circuit. In order to probe students' conceptual understanding of physics and to allow for comparison with other data sets, it is a common approach to use a standardized test. So, for example, there is a standardized test to probe students' understanding of the force concept inventory (FCI) [1]. Another standardized test is used to study students' understanding of kinematics and related graphs (TUG-K) [1]. There are however only a few standardized tests to probe students' understanding of DC resistive circuits. One such test was developed by Engelhardt and Beichner [1]. They used this test with high school and first-year university students from the USA, Canada and Germany.
Aims and objectives of this study
The main aim of this study is to probe students' conceptual understanding of DC circuits and the effect (if any) of the following interventions: (i) practicals, (ii) lectures and (iii) tutorials. The objectives of our study are to attempt answering the following questions:
- 1.How do Stellenbosch University students' baseline (school level) conceptual knowledge of DC circuits compare with their international counterparts?
- 2.What contribution, if any, does a university laboratory practical on DC resistive circuits, make to enhancing students' understanding of DC circuits?
- 3.What contribution, if any, do topic relevant lectures, tutorials and online videos make to enhancing students' understanding of direct current circuits beyond their school-level understanding?
Materials and methods
The setting for this project was the physics (bio) 154 module (Stellenbosch University) which ran in the third and fourth quarter (second semester; July till end of October) of 2015. This is a non-calculus-based introductory physics course with the vast majority of students from the life sciences direction. There were approximately 800 students enrolled in the course. University ethical research regulations require that any research related to students must be voluntary and thus only 366 students participated in the standardized test at the start of the semester. We will refer to this test as the 'pre-test'. The practical and tutorial timetable is shown in table 1. For future reference we note that the term 'post-test' will refer to the test taken after the practical E1.
Table 1. Time table for the practicals and tutorials running in the second semester (2015).
| Week | Start Date | Group A | Group B | Group C | Group D |
|---|---|---|---|---|---|
| 1 | 20 July | Introduction | Introduction | Introduction | Introduction |
| 2 | 27 July | E1 | E2 | E7 | K1 |
| 3 | 3 Aug | Tutorial 1 | Tutorial 1 | Tutorial 1 | Tutorial 1 |
| 4 | 10 Aug | Tutorial 2 | Tutorial 2 | Tutorial 2 | Tutorial 2 |
| 5 | 17 Aug | Tutorial 3 | Tutorial 3 | Tutorial 3 | Tutorial 3 |
| 6 | 24 Aug | E2 | E1 | K1 | E7 |
| 7 | 31 Aug | Tutorial 4 | Tutorial 4 | Tutorial 4 | Tutorial 4 |
| 7 Sep | Holiday | Holiday | Holiday | Holiday | |
| 8 | 14 Sep | K1 | E7 | E2 | E1 |
| 9 | 21 Sep | Tutorial 5 | Tutorial 5 | Tutorial 5 | Tutorial 5 |
| 10 | 28 Sep | E7 | K1 | E1 | E2 |
| 11 | 5 Oct | Tutorial 6 | Tutorial 6 | Tutorial 6 | Tutorial 6 |
| 12 | 12 Oct | Tutorial 7 | Tutorial 7 | Tutorial 7 | Tutorial 7 |
| 13 | 19 Oct | Tutorial 8 | Tutorial 8 | Tutorial 8 | Tutorial 8 |
The pre-test was completed in the week of 20 July. Students' understanding of DC resistive circuits was probed by means of a standardized test instrument developed by Engelhardt and Beichner [1]. The instrument comprises 29 multiple choice questions (each with five answer options) that students have to answer in approximately 40 min. The cohort writing in the week beginning 20 July had no prior university-level experience of DC circuits and thus their results will probe the school-level understanding of DC circuit analysis. It also forms the baseline against which any subsequent interventions are measured. From table 1 we can see that the practical relevant to this project, namely E1, is distributed throughout the semester.
From the use-case diagram in figure 2 we can see that there are four interventions which impact the students' knowledge of DC circuits. Comparing table 1 and figure 2 it is clear that a specific student's interaction with the intervention is time-dependent. For example, the cohort starting with practical in the week beginning 27 July would only have had access to the (i) online videos and (ii) laboratory work, before taking the post-test. Note that these students would not have had a formal traditional lecture on the specific topic of DC circuit analysis by the time they started with the practical E1. The online videos were created with the Explain Everything app installed on an iPad (iOS platform). The online videos discussed the theory and application of Kirchhoff's loop and junction rules. The great advantage of using Explain Everything is that the user can create a complete set of handwritten notes with voice-overs and add additional multimedia such as videos and pictures. Each Explain Everything project was saved as an mp4 file and then uploaded to the university's server called SUNLearn. Students could then download the file and view it (preferably) via QuickTime™ (Apple Inc.). The students thus had access to a complete lecture on the theory and application of Kirchhoff's loop and junction rules in either Afrikaans or English, the languages used for teaching at Stellenbosch University. Note that Tutorial 5 (see table 1) is the one dealing with circuits and that formal lectures (three 50 min lectures on Monday, Thursday and Friday) on circuits started on 14 September 2015 and ran until 23 September 2015.

Figure 2. Use-case diagram showing how the student (the actor) interacts with the physics module (the system).
Download figure:
Standard image High-resolution imageThe E1 practical involved approximately 50 students in a three hour session. The practical was repeated three afternoons per week over an eight-week period (see table 1). The experiment E1 had three parts to it: (i) an algebraic component, (ii) a simulation component and (iii) a physical component (building the circuit) (see figure 3). The simulation component involved the use of the circuit simulation app called iCircuit (http://icircuitapp.com). This app runs on both Android and iOS platforms and is one of a number of circuit simulators [4] available as apps running in standalone mode or via internet browsers. For this project the iCircuit app was installed on iPads. iCircuit is an advanced circuit simulation app that can handle both analog and digital circuits and features real-time 'always-on' analysis. With iCircuit one can add elements, connect them together, and set their properties. The supported elements include amongst others, signal generators, voltage sources, resistors, LEDs, a multimeter to instantly read voltages and currents at any point along the circuit and a virtual oscilloscope that allows the user to monitor how circuit parameters change with time (for non-steady state circuits involving resistors and capacitors for example). A screenshot of a simulated circuit with virtual multimeter and oscilloscope shown in figure 4.
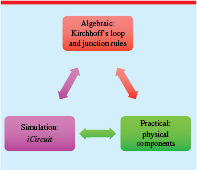
Figure 3. Three components of the practical E1.
Download figure:
Standard image High-resolution image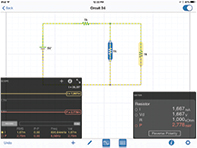
Figure 4. A screenshot of a circuit simulated with the iCircuit app.
Download figure:
Standard image High-resolution imageAfter presenting a short introduction to the iPad and the iCircuit app (see figure 5), 23 iPads were distributed among students on a practical afternoon in order for them to do the circuit simulations in groups (of 4–5 students). At the end of the afternoon session students were again required to do the standardized test on circuits and complete a survey on their experience of using the iPad and iCircuit app.
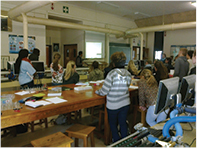
Figure 5. Photograph of students listening to a talk introducing the iCircuit app running on the iPads.
Download figure:
Standard image High-resolution imageFor the practical part of experiment E1 the students had to construct a circuit using the components provided such as batteries, light bulbs and resistors. Figure 1 illustrates a simple example of this. Following the physical construction the students had to algebraically analyze the circuit using Kirchhoff's loop and junction rules. The results of this algebraic approach would be the unknown currents which can be compared to the measured values obtained using the multimeter. Finally, the students had to construct circuits of varying degrees of complexity using the iCircuit app.
The iCircuit app was also used during three tutorial sessions with the physics (bio) 154 students in 2014 [5–8] and proved to be very successful in stimulating group discussion. This app's functionality necessarily leads to greater discussion within each group of students working together. This level of interaction cannot be achieved when students in a group are faced with a static picture in a text book.
In the context of the SAMR (Substitution, Augmentation, Modification, and Redefinition) model of Puentedura [9], this implementation of the iPad comfortably fits into the 'Modification' level since the students can now construct a circuit and see variations in physical parameters in real time. This would be impossible with a static text book problem or any of the apparatus available in the laboratory since the range of resistors used in the laboratory are limited and thus cannot be varied at will. In terms of Bloom's Taxonomy [10] this app can also be used to easily progress from 'Application' and 'Analysis' levels to the more cognitively challenging, 'Synthesis' and 'Evaluation' levels.
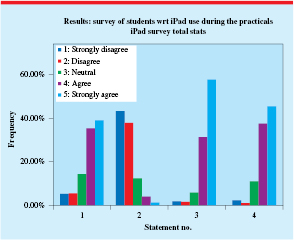
At the end of the E1 practical students were also asked to complete a survey to gauge how they felt about the use of the iCircuit app and the iPads. Students were required to rate (using a Likert scale [11]) how they felt about the following statements:
- Statement 1. I am familiar with the use of the iPad
- Statement 2. The iPad was a distraction during the practical
- Statement 3. iCircuit helped me in the analysis of circuits
- Statement 4. The iPad and app helped to enrich the learning experience
Students had to select their rating from the following options: 1. strongly disagree; 2. disagree; 3. neutral; 4. agree; and 5. strongly agree.
Preliminary results
In order to get an overview of the pre-test results we constructed a histogram of test results, in terms of number of correct answers for the 29 questions. We also performed basic statistical analyses of the pre-test data. The results are shown in figure 6. The average number of correct answers for a student who took the pre-test was 9.8 ± 0.2 (standard error). Similar analyses of the post-test data (N = 356) were done. The results are shown in figure 7. The average number of correct answers for a student who took the post-test was 12.3 ± 0.2 (standard error). Since the pre-test results really probed students' school level understanding of DC circuits, while the post-test probed students' level of understanding after various teaching and learning interventions, we compare our average test result in percentage with results of Engelhardt and Beichner for high school and first-year university students in table 2. It should be noted that the high school students forming part of their sample pool came from Canada, Germany and the USA, while the university students forming part of their sample pool came from Canada and the USA.
Table 2. A comparison of results from this study with results from the study of Engelhardt and Beichner [1].
| Study | Year | Cohort | N | Mark (%) |
|---|---|---|---|---|
| This study | 2015 | 1st year University (Pre-test) | 366 | 34 |
| 2015 | 1st year University (Post-test) | 356 | 42 | |
| Engelhardt et al | 2004 | Secondary school (Canada, Germany, USA) | 251 | 36 |
| 2004 | 1st year University (Canada, USA) | 441 | 44 | |
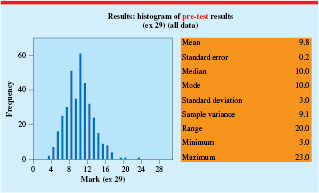
Figure 6. Histogram and statistical analysis of our pre-test data (N = 366).
Download figure:
Standard image High-resolution image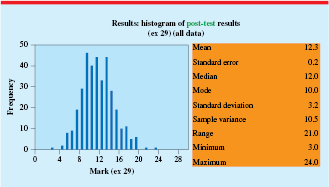
Figure 7. Histogram and statistical analysis of our post-test data (N = 356).
Download figure:
Standard image High-resolution imageIt is seen from table 2 that the average performance of Stellenbosch University students compares well with their international counterparts in Canada, Germany and the USA.
In order to gauge whether there was an improvement in student performance on the standardized test as the semester progressed and students were therefore exposed to more learning and teaching, we analyzed separately data from the various weeks when the pre-test was administered. The results of this analysis are shown in table 3. It is observed that the improvement in student performance (relative to the pre-test scores) remains almost constant at 25% as the weeks progress. This was a surprising result for us since we expected that average student performance would improve as they were being exposed to more and more learning and teaching interventions. Instead we observe only one statistically significant jump in student performance after the first group of students did practical E1. Specifically, at this stage of our analyses it appears that no statistically significant improvement in student scores can be attributed to the circuit simulations students did as part of the E1 practical.
Table 3. Average number of correct answers in pre- and post-test and improvement factor, as a function of week into the semester.
| Week | 2 | 6 | 8 | 10 |
|---|---|---|---|---|
| Pre-test mark (total: 29) | 10.5 | 9.9 | 9.8 | 9.5 |
| Post-test mark (total: 29) | 12.9 | 12.5 | 12.3 | 11.8 |
| Improvement | 22.9% | 26.3% | 25.5% | 24.2% |
The results from our survey of student perceptions about the use of iCircuit and the iPads are shown in figure 8. It is seen that the majority of students felt that the iCircuit app helped them with circuit analysis and that this app and the iPad helped to enrich their learning experience. These results are similar to those reported by Van der Ventel et al [8].
Figure 8. Histogram showing students' response to the survey on their perception of their use of the iCircuit app and the iPads.
Download figure:
Standard image High-resolution image
Summary and outlook
The main results of our study are the following:
- 1.The Stellenbosch University (SU) student baseline pre-test average performance on the standardized test is in line with results of an international study [1].
- 2.SU students show an approximate 25% (average) improvement in post-test relative to pre-test performance.
- 3.SU students' post-test performance is in line with results of the international study [1].
- 4.Surprisingly no statistically significant time dependence in (post-test/pre-results) results were observed—instead only one statistically significant jump in improvement was observed.
- 5.iPads and the iCircuit app used by students for simulating circuits were perceived by the majority of students to enrich learning and enhance their understanding of DC circuits.
Further analyses of our data are in progress and we are in the process of completing interviews with selected students. We plan to study in detail the responses of students per question to hone in on specific concepts. The results from this analysis will allow us to probe further whether any specific teaching or learning intervention contributed in any significant way to the improvement in student scores observed for specific questions.
Acknowledgments
We are grateful to Professor P Walters for managing the automated marking of the standardized test answer sheets and for collating some of the data used in this study. We are also grateful to the Centre for Teaching and Learning at Stellenbosch University for a FIRLT grant received towards this project. BvdV also expresses sincere thanks to the National Research Foundation of South Africa for an incentive grant that was used to purchase eight iPads for use in this project.