

Abstract
Manganese-doped ceria nanoparticles were prepared by hydrothermal synthesis and the prepared samples were thermally treated at 500 °C for 2 h. The samples were investigated using x-ray diffraction (XRD), high-resolution transmission electron microscopy (HR-TEM), energy-dispersive x-ray spectroscopy (EDS), N2 adsorption and x-ray photoelectron spectroscopy (XPS). XRD revealed that nanocrystalline ceria is the main phase in all samples, while a romanechite-like phase (Na2Mn5O10) appears in the sample doped with 30% of Mn. TEM coupled with EDS exposed the presence of the same phase in the sample doped with 20% Mn. While ceria particles have spherical morphology and particle size ranging from 4.3 to 9.2 nm, the rare crystals of the romanechite-like phase adopt a tubular morphology with a length of at least 1 μm. However, the decrease in the ceria lattice constant and the EDS spectra of the ceria nanoparticles clearly indicate that a substantial amount of manganese entered the ceria crystal lattice. Manganese doping has a beneficial impact on the specific surface area of ceria. XPS measurements reveal a decrease in the Ce3+/Ce3+ + Ce4+ content in the doped samples which is replaced by Mn3+. Moreover, a drastic increase in adsorbed oxygen is observed in the doped samples which is the consequence of the increase in Mn3+ species that promotes oxygen migrations to the surface of the sample. Compared to the pure sample, the doped samples showed significantly higher catalytic activity for the process of toluene oxidation.
Export citation and abstract BibTeX RIS

Original content from this work may be used under the terms of the Creative Commons Attribution 4.0 licence. Any further distribution of this work must maintain attribution to the author(s) and the title of the work, journal citation and DOI.
Introduction
Cerium dioxide, ceria (CeO2) is a technologically important lanthanide oxide known for its fluorite structure. It is used in many different applications such as catalysis and solid-state electrochemistry. It can be used as a corrosion inhibitor, polishing agent, in wastewater treatment and solid oxide fuel cells [1–5]. CeO2 is also used as a catalyst for processes like the oxidation of carbon monoxide, soot, or volatile organic compounds, and for the reduction of nitrous oxides [6–9]. As a catalyst, ceria is mostly used in the nano form since the catalytic activity of bulk ceria is not as great as that of nanoparticles [10]. Oxygen mobility, vacancies and storage are the main reasons for the use of ceria-based catalysts [11]. Numerous experiments and computational studies related to catalytic performance of ceria were studied [12]. These studies suggest great efficiency of ceria in catalysis [12, 13]. Catalytic applications rely on the shift between Ce3+ and Ce4+. In a reducing atmosphere, Ce4+ is reduced to Ce3+, which binds electrons to the structure and releases oxygen, resulting in an oxygen vacancy [14, 15]. Ceria catalysts often perform at high temperatures due to greater oxygen mobility in the crystal lattice. Particularly, three-way catalytic converters with ceria nanoparticles as one of the main components typically operate at temperatures above 300 °C. Low temperatures (<250 °C) in the start-up period result in very low conversion rates [16, 17]. On the other hand, at elevated temperatures nanoparticles are prone to grain growth leading to the reduction of properties required for good catalytic activity, such as the specific surface area or surface oxygen incidence [18].
In order to improve catalytic properties as well as thermal stability, ceria nanoparticles are often doped with metal ions [19]. Doping of ceria implies that during synthesis, ions enter the ceria crystal lattice, essentially creating a solid solution. In various studies different metal ions, including transition metals, were incorporated into the ceria crystal lattice, but not all metal ions are necessarily suitable for entry [20–23]. This too has been investigated via computational studies mostly related to redox properties of doped ceria [12]. In our previous work [22], the ability of various transition metal ions to enter the ceria crystal lattice in the course of hydrothermal synthesis was tested. The hydrothermal technique can be used in the processing of advanced materials as it provides high product purity, submicron to nanomaterials with narrow size distribution and is a single step process [24]. The ability for the improvement of ceria thermal stability, as well as its catalytic properties were assessed in the literature [22, 23]. By all criteria manganese has shown promising results. Manganese oxides (MnOx ) show good catalytic properties such as variable degrees of oxidation between different MnOx compounds [25]. Incorporation of manganese into the ceria lattice should enhance oxygen storage and release of oxygen atoms from the ceria structure [26].
Recent work shows that pure ceria and manganese doped ceria can be prepared by hydrothermal synthesis [27]. Ceria with crystallite sizes between 3.1 and 3.4 nm and specific surface areas between 183 and 212 m2 g−1 were obtained. The entry of manganese into the ceria crystal lattice was proven. However, it was established that not all of the manganese enters the ceria lattice because birnessite (Na0.55Mn2O4 × 1.5H2O) occurs in the samples in addition to ceria. In this paper, we present an investigation of the phase composition, microstructure, properties and catalytic activity of pure ceria and ceria doped with 10, 20 and 30% of manganese prepared through hydrothermal synthesis and thermally treated at 500 °C for 2 h.
Materials and methods
Nanoparticle synthesis
For the hydrothermal synthesis, analytical grade chemicals: cerium sulfate Ce(SO4)2x3H2O (p.a.) and manganese sulfate MnSO4 (p.a.) in a total amount of 0.8 mmol with the addition of 80 ml of NaOH (p.a.) with concentration of 8 mol dm−3 were placed in Teflon cups of 100 ml. The cups were then placed in a stainless steel autoclave, closed, sealed and thermally treated at 120 °C for 16 h. The product was washed with deionized water. Three cycles involving sonification in an ultrasonic bath and centrifugation were performed to obtain a pure sample. The details of the synthesis procedure have been published elsewhere [28]. Finally, the product was dried at 60 °C and thermally treated at 500 °C for 2 h. The thermal treatment has been performed since the catalyst nanoparticles are expected to work at elevated temperatures. Therefore, in order to investigate their properties and catalytic activity, thermal treatment should be performed at a temperature greater than the maximum temperature reached during the catalytic oxidation test. Both, a sample with pure ceria stoichiometry, as well as samples with 10, 20 and 30% of ceria replaced with manganese were prepared.
Nanoparticle characterization
X-ray diffraction (XRD) analysis was performed using Shimadzu XRD 6000 diffractometer operating at 40 kV and 30 mA with CuKα radiation. The crystal phase identification data were collected in step-scan mode (0.02° 2θ) at a counting time of 0.6 s in the range between 5 and 105° 2θ. The Scherrer equation: D = k λ/βcosθ, where k is the shape factor (cubic symmetry, spherical crystallites: k = 0.94), λ is the wavelength (CuKα radiation, λ = 0.15405 nm), β is the FWHM corrected for instrumental broadening, and θ is the Bragg angle, was used to calculate the crystallite sizes of the samples [29]. For the calculation of crystallite size, ceria peak at 47.54° 2θ (220) was selected due to the partial overlapping of the most intense (111) peak with the (200) peak in some samples. The unit cell constant of the cubic ceria lattice, a, was calculated via the Unitcell program [30]. The morphology and chemical composition of the gained samples was investigated using a Cs corrected scanning transmission electron microscope (STEM) on Jeol ARM 200 CF with an accelerating voltage of 80 kV coupled with Jeol Centurio 100 energy dispersive x-ray spectrometry (EDS). For the calculation of the ceria average particle size, Image J software package was used [31]. Micrometrics ASAP2000 was used to determine the surface area of the samples by means of N2 adsorption–desorption isotherms at 77 K. The Barret, Joyner, Halenda (BJH) model was used to obtain information on the pore size distribution and surface area. Samples were degassed at 100 °C under a dynamic vacuum of 7 mPa prior to analysis.
In order to determine the oxidation states of cerium and manganese in the prepared samples, x-ray photoelectron spectroscopy (XPS) with PHI-TFA XPS spectrometer produced by Physical Electronics Inc. equipped with Al-monochromatic x-ray source emitting photons at the energy of 1486.6 eV and hemispherical electron energy analyzer was used. The analyzed area was 0.4 mm in diameter. High-energy resolution XPS spectra were acquired at the resolution of 0.6 eV and pass energy of 29 eV with the accuracy of binding energies at about ±0.3 eV. A neutralizer electron gun was used to reduce surface charging. Elemental composition was then investigated via Multipak software 8.0 (by Physical Electronics) and the deconvolution into subpeaks achieved with OriginLab software using the Gaussian fitting method while considering Shirley-type background subtraction.
The catalytic properties were measured on a common model volatile organic compound, toluene. The catalytic oxidation of toluene was accomplished in an integral up-flow fixed bed reactor (inner diameter of 8 mm) under atmospheric pressure. Thermally treated samples, at 500 °C for 2 h were chosen as catalysts, as this was the highest temperature the test reactor could reach. The mass of catalyst placed in the reactor was 0.05 g and was inserted between two quartz wool plugs, while the dead volume of the reactor was filled with inert metal inserts to ensure that no gas-phase reactions occur. The gas mixture used was in fact toluene in nitrogen (242 ppm of toluene) (SOL group, Monza, Italy) mixed with an oxidant, air (SOL group, Monza, Italy). The gas flow was controlled by mass flow controllers (MFC 4800 Series, Brooks), during which time the temperature of the reactor was regulated by a thermo-controller (TC208 Series) linked to a thermocouple placed within the reactor as well as the heaters around the reactor. For the detection of toluene after oxidation at wanted temperature, an on-line gas chromatograph (GC-2014, Shimadzu) with a flame ionization detector (FID) and a Carbowax 20 M column (250/177 μm) was used.
Results and discussion
Figure 1 shows the XRD patterns of the investigated samples. All samples show characteristic peaks of ceria, CeO2 (ICDD PDF #34-0394), of which the most prominent ones appear around 28.56° (111), 33.08° (200), 47.48° (200), 56.36° (311), etc. Beside Bragg angles, peak intensities are also in concordance with the ICDD data. Careful examination of XRD patterns reveals a small shifts in peak positions, due to small changes of the lattice constant. However, the diffraction patterns of the sample doped with 30% of manganese include additional peaks associated with romanechite-like sodium manganese oxide, Na2Mn5O10 (ICDD PDF #27-0794). The mineral referred to as romanechite is in essence barium manganese oxide, (Ba, H2O)2(Mn4+, Mn3+)5O10 with tunnel structures made of edge and corner sharing MnO6 octahedra with barium cations and water molecules located within the tunnel [32]. Na2Mn5O10 has the same structure, but with sodium ions within MnO6 tunnels [33]. The appearance of this phase is a consequence of the presence of birnessite in as-prepared samples, which transforms into a romanechite-like phase upon thermal treatment [27]. The XRD patterns of the other samples do not show diffraction peaks that are different from those belonging to ceria. The ceria peaks show a slight shift to the right with the increase of dopant level, indicating the incorporation of manganese and subsequently the change in the ceria lattice constant [27]. Therefore, the unit cell constants of the cubic ceria lattice was calculated using the Unitcell [30] program and listed in table 1.

Figure 1. Diffraction patterns of investigated samples.
Download figure:
Standard image High-resolution imageTable 1. Lattice constant, crystallite size calculated by the Scherrer method, particle size determined from TEM imaging and specific surface area of the investigated samples.
| Sample | a (Å) | d crystallite (nm) | d Particle (nm) | SSA (m2g−1) |
|---|---|---|---|---|
| CeO2 | 5.4049 ± 0.0016 | 10.1 ± 0.2 | 8.8 ± 1.2 | 35.8 ± 0.4 |
| CeO2 : 10% Mn | 5.3945 ± 0.0016 | 6.1 ± 0.1 | 5.1 ± 0.6 | 65.8 ± 0.8 |
| CeO2 : 20% Mn | 5.3909 ± 0.0016 | 5.8 ± 0.1 | 4.9 ± 0.9 | 72.6 ± 0.9 |
| CeO2 : 30% Mn | 5.3879 ± 0.0016 | 5.4 ± 0.1 | 4.7 ± 1.0 | 75.7 ± 0.9 |
Interestingly, the calculated lattice constant of pure ceria is smaller than the literature value for bulk ceria, a = 0.5411 nm (ICDD PDF #34-0394). The phenomenon of decreased lattice constant in ceria nanoparticles was noted previously [34, 35] and explained as a consequence of decreased surface relaxation [35]. A decrease in the lattice parameter a can be observed in the doped samples indicating the incorporation of Mn atoms into the ceria lattice. This is a consequence of the substitution of the larger Ce3+ (1.143 Å) and Ce4+ (0.97 Å) cations by smaller Mn2+ (0.80 Å), Mn3+ (0.64 Å) and Mn4+ (0.53 Å) cations [36]. A considerable decrease of lattice constant can be observed from the pure sample to the sample doped with 10% of manganese and further, although not as great decrease, for the 20% and 30% doping level. It is known that the presence of aliovalent dopants leads to oxygen vacancies and structural distortions [37], which cause an increase in the lattice constant [38]. So one possible explanation for such dynamics of lattice constant reduction would be the combination of the entry of managanese into the lattice (leading to shrinkage) and the occurrence of vacancies (leading to expansion). However, this effect is mainly reported for divalent metal ions [37, 39], whilst in the present case a much more plausible explanation is the appearance of a secondary manganese phase that reduces the amount of manganese available for incorporation into the ceria. So, only part of the manganese enters the ceria crystal lattice, while the other part forms a manganese-rich phase. This is evident in the sample doped with 30% of manganese, in which the presence of a romanechite-like phase was indicated through XRD analysis. On the other hand, no peaks attributable to a romanechite-like phase were observed in the XRD pattern of the sample doped with 20% of manganese and the possible presence of this phase remains to be proven by other methods. Nevertheless, the nonlinear decrease of the ceria lattice constant with the doping level strongly suggests that there is some distribution of manganese between the phases and that this distribution changes with increasing doping level in favour of the romanechite-like phase. While all manganese ions enter the ceria lattice in the sample doped with the lowest doping level, the amount of manganese incorporated into the ceria in samples with higher doping levels increases in smaller fractions. The most probable reason for such distribution is the growth of system instability with the increase of dopant level [40].
Manganese doping also affects the size of the crystallites, which can be seen from the peak broadness. The crystallite size was calculated using Scherrer's method [29] and is given in table 1. A decrease in crystallite size is observed with the increase of Mn doping level. The largest decrease in crystallite size is observed from pure ceria to ceria doped with 10% manganese (10.1 to 6.1 nm). This can be explained by the positive effect of manganese on the thermal stability of the annealed samples [18]. In the other doped cases, the size difference is not as great, which could be a consequence of the smaller increase in the amount of manganese in the lattice due to the appearance of a second crystal phase containing manganese.
In order to gain insight into morphology, structure, particle size and chemical composition; TEM, SAED and EDS analyses were performed. TEM bright field micrographs of the investigated samples are shown in figure 2. All micrographs show nanosized spherical particles. Although, the shape and size can be greatly influenced by the reaction parameters, the sphere-like structure is a desirable result of the low synthesis temperature, which prevents the crystallite structure from achieving its equilibrium shape [41, 42]. The nanoparticles are highly agglomerated due to surface energy reduction.
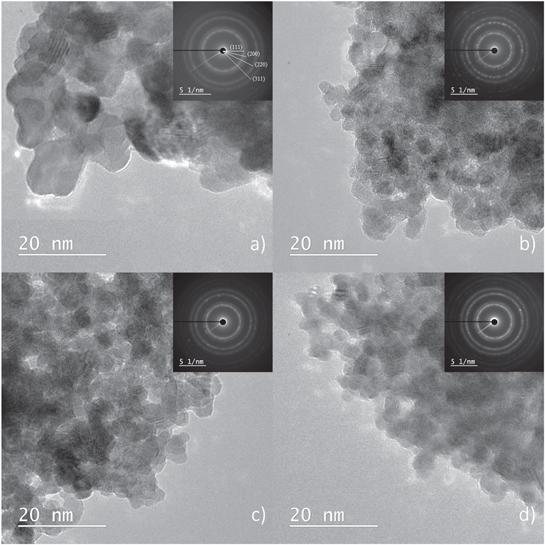
Figure 2. TEM micrographs of investigated samples: (a) CeO2, (b) CeO2:10% Mn, (c) CeO2:20% Mn, (d) CeO2:30% Mn. Insets: SAED patterns obtained from area displayed in appropriate figures.
Download figure:
Standard image High-resolution imageThe SAED patterns of corresponding samples are shown as insets in figures 2(a)–(d). Crystal plane distances were calculated to be 0.31, 0.27, 0.19 and 0.16 for (111), (200), (220) and (311) planes, respectively. The diffraction rings were indexed to the ceria structure (ICDD PDF #34-0394), confirming the XRD findings of the dominance of ceria in the studied samples.
The ImageJ software was used to evaluate the particle size. The nanoparticle size was calculated as the average value of 30 randomly selected particles from the TEM images shown in figure 2 and the results are given in table 1. The TEM-derived particle sizes agree very well with the crystallite sizes derived from XRD, indicating that one particle consists of a single crystallite. All of the calculated particle sizes are below 10 nm and, while the pure sample has the greatest particle size, with the increase of the doping level, the decrease of particle size is observed indicating that manganese doping of ceria inhibits grain growth upon thermal treatment.
The appearance of a romanechite-like phase, as a secondary crystalline phase detected by XRD analysis in the sample doped with 30% manganese, was confirmed by STEM analysis. As can be observed in figure 3(b), a phase whose morphology significantly deviates from spherical ceria nanoparticles was found in a sample doped with 30% manganese. The morphology of this phase is consistent with the morphology of a romanechite-like phase appearing in the form of nanorods [33], or even more accurately described as a sheet-like structure consisting of tubular nanounits [43]. However, after a careful STEM analysis of the sample doped with 20% manganese, the presence of a romanechite-like phase was also established (figure 3(a)). Obviously, the proportion of this phase in this sample is so small that the phase remained undetectable to the XRD. After all, even in the XRD pattern of the sample doped with 30% manganese, the diffraction maxima of the romanechite-like phase are of very low intensity. The chemical composition of this phase in both samples was investigated using the EDS technique. Elemental distribution maps of cerium, manganese and oxygen were obtained and are shown in figure 3. As can be observed, greater density of cerium, as well as oxygen atoms is noticeable only in places where clusters of spherical ceria particles are visible in the STEM micrographs, while the homogeneous distribution of manganese and oxygen indicates that tubular units are built of these elements. Now, when the occurrence of a romanechite-like phase in the sample doped with 20% manganese was established, the attribution of the nonlinear changes in the lattice constant to only partial entry of manganese into the ceria lattice could be confirmed. In the course of hydrothermal synthesis, manganese is consumed in two processes, incorporation into the crystal lattice of ceria and formation of birnessite, which transforms into a romanechite-like phase upon thermal treatment. The higher the doping level is, the more manganese is utilized for the crystallization of the romanechite-like phase. Therefore, no romanechite-like phase could be found in the sample doped with 10% manganese, while the amount of romanechite-like phase in the sample doped with 20% manganese is so small that the phase is undetectable by XRD, but observable on STEM micrographs. Finally, in the sample doped with 30% of manganese, the amount of romanechite-like phase is great enough to allow both detection methods, XRD and STEM.
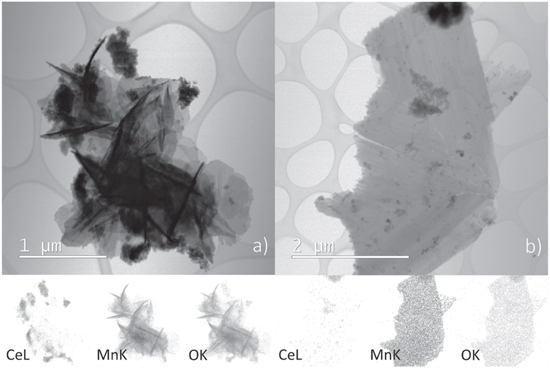
Figure 3. Secondary phase in: (a) 20% Mn doped sample; (b) 30% Mn doped sample. BF-STEM micrographs of EDS elemental (Ce, Mn and O) distribution maps are given below.
Download figure:
Standard image High-resolution imageOn the other hand, the EDS cerium elemental map of the ceria agglomerate, shown in figure 4(a), clearly indicates a much larger presence of cerium in the sample doped with 10% Mn. The mapping also proves the presence of manganese, indicating the entry of manganese into the ceria lattice. Quantitative analysis revealed an amount of manganese close to the nominal value.
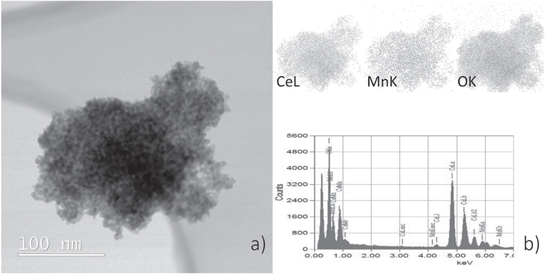
Figure 4. (a) BF-STEM micrograph and EDS elemental (Ce, Mn and O) distribution maps and (b) EDS spectrum of ceria nanoparticles agglomerate of ceria particles in sample with 10% of Mn.
Download figure:
Standard image High-resolution imageThe agreement between crystallite and particle size suggests that each particle consists of only one crystallite. This could easily be corroborated from the HR-STEM micrographs of the investigated samples at higher magnification (figure 5). The HR-STEM micrographs reveal particle lattice fringes, with uniform orientation of the fringes within the particles confirming their single-crystalline character. At the same time, on the basis of the fringes of different orientations, it can be seen that particles are randomly oriented. Interlayer distance of 0.31 ± 0.01 nm, for thermally treated samples consistent with (111) crystal plane spacing of cubic ceria (ICDD PDF #34-0394) could be observed in some of the particles in all samples, which is in concordance with the as prepared samples [27]. HR-STEM shows the planes which are perpendicular to the electron beam even though the appearance of {111} planes on ceria nanoparticles is most common due to its lowest surface energy [34].

Figure 5. High resolution BF-STEM micrographs of thermally treated samples: (a) CeO2; (b) CeO2:10% Mn; (c) CeO2:20% Mn; (d) CeO2:30% Mn.
Download figure:
Standard image High-resolution imageThe N2 adsorption–desorption isotherms and pore size distribution are shown in figure 6, while the specific surface area calculated by the Brunauer–Emmet–Teller is given in table 1. The volume of nitrogen adsorbed on investigated samples is displayed in figure 6(a). All of the annealed samples show similar adsorption–desorption isotherms, which according to the IUPAC classification, are type IV isotherms with H3 hysteresis loops generally associated with microporous or mesoporous materials [44]. As can be observed in figure 6(b), the pore sizes are predominantly in the mesopore range, between 2.5 and 3.9 nm, and the pore volume increases with the doping level. Both facts indicate that the porosity in the studied samples is mainly a consequence of the interparticle areas among stacked particle aggregates [45]. This conclusion is in agreement with STEM micrographs and particle sizes derived from STEM. The specific surface areas of the studied samples are listed in table 1. Taking into consideration that the samples were thermally treated at 500 °C for 2 h, which inevitably led to some sintering, the values obtained are satisfactory. The doping obviously increases the SSA, however, the reduction is not linear following a trend established for gained particle size.

Figure 6. (a) N2 adsorption–desorption isotherms and (b) pore size distribution of investigated samples.
Download figure:
Standard image High-resolution imageXPS analysis has been performed to investigate the prepared samples' chemical configuration and oxidation states (figure 7). The XPS results indicate that the elemental composition of nanomaterials consists of carbon, cerium, oxygen, manganese and sodium. A pure ceria oxide sample exhibits a contribution of cerium and oxygen peaks accompanied by a small carbon peak. The amount of Na is negligible. Carbon peaks centered at about 284.5 eV appear from contamination with the carbon adsorbed from the ambient air. The three doped samples display the same peaks with the clear addition of manganese and sodium peaks. With the increase of doping level, the intensity of cerium peaks decreases, while for Mn 2p, Na 1s and O 1s ones, it increases. Carbon peaks grow larger due to better adsorption on doped samples attributed to greater specific surface areas of the nanocrystallites. The elemental surface composition determined via XPS is given in table 2, discarding a contribution of carbon C 1s peak.
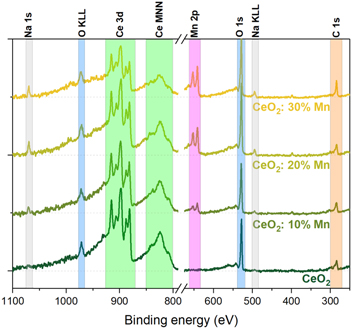
Figure 7. XPS spectra of investigated samples with main chemical elements marked.
Download figure:
Standard image High-resolution imageTable 2. XPS results revealing surface elemental composition.
| Sample | Ce (at.%) | O (at.%) | Mn (at.%) | Na (at.%) |
|---|---|---|---|---|
| CeO2 | 26.5 | 72.2 | / | 1.3 |
| CeO2 : 10% Mn | 19.6 | 69.9 | 5.9 | 4.6 |
| CeO2 : 20% Mn | 15.7 | 65.0 | 13.2 | 6.1 |
| CeO2 : 30% Mn | 11.8 | 62.7 | 19.2 | 6.3 |
According to the data given in table 2, the surface concentration of manganese is far greater than nominal with the Mn/(Ce+Mn) ratio of 23.1%, 45.7% and 61.9% for samples doped with 10, 20 and 30% of manganese, respectively. The presence of sodium, found in all doped samples, could be attributed to the romanechite-like phase detected by the XRD analysis for sample doped with 30% Mn and/or STEM/EDS measurements for samples doped with 20 and 30% of Mn. The amount of romanechite-like phase was too low for detection in the sample doped with 10% of Mn. However, the small percentage of sodium found in the pure ceria sample could be due to the inability of complete elimination of Na during the washing cycles, as no romanechite-lik phase can occur in this sample. The observed oxygen atomic share slightly decreases with the samples dopant level, which is consistent with the decrease of ceria (presumably mostly in 4+ oxidation state) and the increase of manganese (presumably mostly in 3+ oxidation state). The high-resolution XPS spectra of Ce 3d and Mn 2p peaks were Gaussian deconvoluted to obtain a deeper insight into their oxidation states. Also, a detailed analysis of the O 1s peak could provide relevant information sensitive to the nature of detected oxygen by comparing the Mn-containing sample with the non-doped one.
Considering the complex nature of the Ce 3d peak appearing in two oxidation states (Ce3+ and Ce4+) and their 4f orbital configurations, accompanied by a spin–orbit splitting (3d5/2 and 3d3/2), only two samples were characterized, namely the pure sample (CeO2) and the sample with the highest dopant concentration (CeO2: 30%Mn). Typically, five sets of spin–orbit doublets can describe properly the Ce 3d core levels peak relief bringing an insight to components contribution [26]. Following the XPS spectra nomenclature, the peaks corresponding to 3d5/2 spin–orbit are assigned as 'v', while those that are related to higher binding energies of Ce 3d3/2 component are labelled as 'u' (figures 8(a), (b)). For the sake of clarity, the peaks due to different oxidation states of cerium defined by fitting are marked as follows: Ce3+ peaks—solid lines and Ce4+ components—dotted lines. After a careful inspection of both spectra, a reduced contribution of Ce3+ portions to overall spectrum in the manganese enriched sample could be observed. The reactions of Ce3+ peak areas calculated via the formula  [46] for pure and doped nanocrystallites are 15.1% and 11.4%, respectively. Also, the peak area reduction of v0 and v' Ce3+ components causes width narrowing of the mutual peak located at 882 eV in the Mn-doped sample. A lower Ce3+ share could be related to the oxygen chemically bonded with Mn in the structure, tending to oxidize it. The areas of cerium components after deconvolution accompanied with peak positions are collected in table 3.
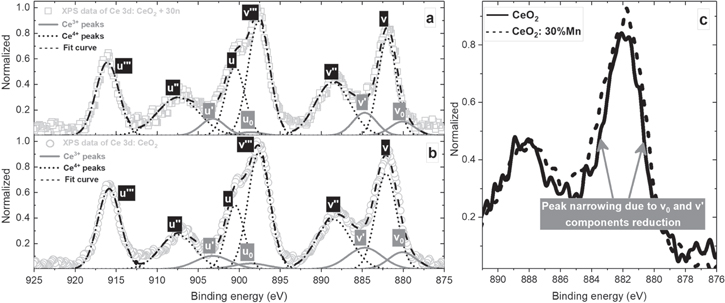
Figure 8. The deconvolution of Ce 3d core levels XPS spectra of (a)—sample doped with 30% of Mn, (b)—pure sample, (c)—a mutual (v0/v/v') XPS peak, indicating its width narrowing due to Ce3+ components peak area reduction in the doped sample. Shirley background subtraction was applied before data fitting.
Download figure:
Standard image High-resolution imageTable 3. Labelling and fitting parameters of cerium peaks in figures 8(a), (b).
| Peak | Oxidation state | Peak area CeO2 | Peak area CeO2:30%Mn | Peak position (eV) |
|---|---|---|---|---|
| v0 | Ce3+ | 0.552 | 0.407 | 880.1 |
| v | Ce4+ | 2.408 | 2.123 | 882.1 |
| v' | Ce3+ | 0.890 | 0.650 | 884.7 |
| v'' | Ce4+ | 2.056 | 2.221 | 888.5 |
| v''' | Ce4+ | 3.022 | 2.945 | 897.6 |
| u0 | Ce3+ | 0.232 | 0.101 | 898.6 |
| u | Ce4+ | 1.362 | 1.583 | 900.5 |
| u' | Ce3+ | 0.552 | 0.492 | 903.2 |
| u'' | Ce4+ | 1.438 | 1.901 | 907.5 |
| u''' | Ce4+ | 2.181 | 1.996 | 915.8 |
Following a similar procedure, the sample with the most developed and intense Mn 2p region was investigated (figures 9(a)–(d)). It should be pointed out that there is no need to analyze intermediately doped samples due to lower peak intensity, leading to possible data misinterpretation. Two peaks placed at 653.5 and 642.0 eV are attributed to the Mn 2p1/2 and Mn 2p3/2 spin–orbit coupling, respectively. At first, based on the symmetrical peaks shape and their position observed at energies higher than that of metallic manganese, it could be claimed the Mn appears in multiple oxidation states [47–49]. From the fitting (figure 9(a)), it could be observed that the Mn3+ (dotted line) valence dominates the manganese chemical environment. Regardless, contributions of lower Mn2+ (dashed line) and higher Mn4+ (solid line) oxidation states are present and cannot be disregarded (table 4). A synergy of multiple valences might result from the imperfection of crystalline stoichiometry and the presence of structural defects. The occurrence of manganese as Mn3+ species is probably the reason for the observed Ce3+ share decrease in the doped sample. The occurrence of Na2Mn5O10 in the mixed CeO2:30% Mn compound is reflected in the overall oxygen content decrease (table 2).
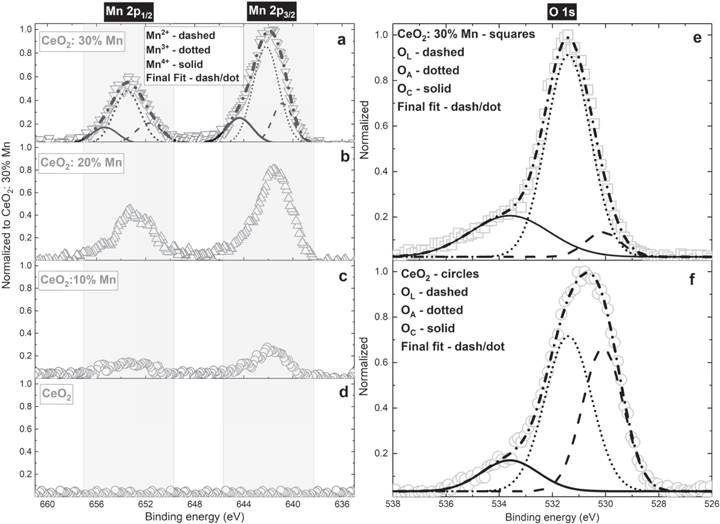
Figure 9. (a)–(d)—High-resolution XPS region representing Mn 2p core levels with corresponding peaks deconvolution of the most doped sample; (e)–(f)—XPS of O 1s for doped with 30% of Mn and pure samples, accompanied by Gaussian fits.
Download figure:
Standard image High-resolution imageTable 4. Surface ratio of different manganese states in sample doped with 30% of Mn.
| Fitted peak area | Position | Fitted peak area | Position | Valence ratio | |
|---|---|---|---|---|---|
| Component | 2p3/2 | eV | 2p1/2 | eV | % |
| Mn2+ | 0.713 | 640.8 | 0.459 | 651.7 | 21.4 |
| Mn3+ | 2.176 | 642.2 | 1.187 | 653.5 | 61.5 |
| Mn4+ | 0.574 | 644.3 | 0.362 | 655.3 | 17.1 |
Regarding the oxygen, it could be observed that the raw data peak width of the doped sample is smaller than that recorded for the pure sample (figures 9(e), (f)). Also, despite being equally shifted (normalized) considering carbon C 1s peak as a reference, the maxima do not coincide, which might indicate evident chemical changes in this element. The deconvoluted O 1s spectra for the doped and the pure sample are given in figures 9(e), (f). A shouldered peak shape designates the contribution of different oxygen species to the core-level spectra of investigated samples. Three distinct peaks, centered at 530.1, 531.4 and 533.6 eV, reveal an input of lattice oxygen atoms, surface adsorbed oxygen, and chemisorbed water and/or carbonates (table 5) [26]. An increased amount of manganese causes a drastic relative growth of the adsorbed oxygen (dotted lines in figures 9(e), (f)). This is in concordance with the decrease of Ce3+ fraction and increase of Mn3+ species at the catalyst surface, which should promote the migration of oxygen to the surface due to creation of oxygen vacancies and unsaturated chemical bonds at the particle surface [50]. The creation of dangling bonds might also be related to the higher SSA of nanocrystallites. An enlarged SSA in the Mn-enriched (30%) sample also results in a higher intensity of carbon C 1s peak (figure 7) and produces an increment in carbonate-related peak area (figures 9(e), (f), green curves).
Table 5. Surface ratios of lattice, adsorbed and chemisorbed oxygen.
| Fitted peak area | Area ratio % | Peak position | |||
|---|---|---|---|---|---|
| Component | CeO2 | CeO2: 30%Mn | CeO2 | CeO2: 30%Mn | eV |
| OL | 1.021 | 0.178 | 35.4 | 6.6 | 530.1 |
| OA | 1.496 | 1.856 | 51.9 | 68.5 | 531.4 |
| OC | 0.365 | 0.674 | 12.7 | 24.9 | 533.6 |
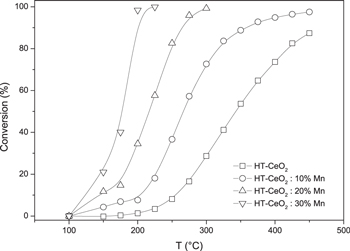
Cerium oxide nanoparticles are known to act as a catalyst for the oxidation of toluene [51], therefore toluene was used as a model VOC. The catalytic activity of the prepared samples was tested at various temperatures and the results are presented in figure 9. The curves of all of the samples are S-shaped as the conversion increases exponentially with temperature. The doped samples showed much greater oxidation activity than the pure ceria sample. The most characteristic temperature for the catalyst test is T95, which indicates the temperature at which 95% conversion was achieved. While 95% conversion was not obtained for the pure ceria sample, the doped samples achieved 95% conversion at temperatures of 400 °C, 276 °C and 190 °C for 10%, 20% and 30% doped ceria samples, respectively. As can be observed from the figure 10 and T95, the sample with the highest doping level was the most active, with the activity decreasing with the decrease of doping level being the lowest in the pure sample.
Figure 10. The influence of reactor temperature on toluene conversion in the presence of investigated samples. The lines are added as a guidelines for the eye.
Download figure:
Standard image High-resolution image
Various factors are associated with catalyst activity, such as specific surface area, surface oxygen, exposed facets, and composition [52]. As can be observed in table 1 and figure 10, both the specific surface area and the catalytic activity increase with the doping level. Therefore, it is obvious that some contribution to the catalytic activity must come from the increased specific surface area since greater surface area leads to a larger number of active catalytic sites. The increase in SSA with doping also agrees well with the larger contribution of adsorbed oxygen under the influence of doped Mn, which favors the improvement in catalytic activity. The enhanced catalytic activity could also be due to the introduction of lower valence Mn3+ ion into the ceria lattice, which cause the formation of active dangling bonds and surface vacancies that balance the negative charge [37]. Finally, there is a possibility that the romanechite-like phase exhibits some catalytic activity for the toluene oxidation process, and that should not be disregarded.
Conclusion
The hydrothermal synthesis of pure and manganese doped ceria was successfully accomplished. The final product after relatively high temperature thermal treatment were spherical particles of small crystallite size appropriate for further catalysis use. Larger amount of manganese doping causes the formation of another manganese phase competing with manganese entrance in the ceria crystal lattice. While all samples are composed of ceria particle agglomerates, a romanechite-like phase is present in the 20% and 30% doped samples. The morphology of this phase can be best described as nanorod structures grouped into sheets. The presence of this phase does not contradict the fact that a substantial amount of manganese enters the ceria crystal lattice, which is proven with lower cubic lattice constants for the doped samples. Particle size of yielded samples is in excellent agreement with the crystallite size, indicating that each particle is made of one crystallite. Even the presence of the romanechite-like phase does not disrupt the specific surface area growth trend of the doped samples which are in concurrence with particle size of said samples. This leads to greater catalytic potential for the oxidation of toluene. The decrease in Ce3+/(Ce3+ + Ce4+) ratio for the doped sample is attributed to the entry of manganese ions into crystal lattice which are also predominately in the Mn3+ oxidation state. Best conversion rate of the 30% doped sample can be linked to the smallest particle size, greatest specific surface area, less oxygen in the lattice enabling greater oxygen mobility and more oxygen on the surface available for oxidation.
Acknowledgments
This work has been fully supported by Croatian Science Foundation under the project IP-01-2018-2963. The sustenance of the University of Zagreb is gratefully acknowledged. Uroš Cvelbar and Vasyl Shvalya appreciate NATO MYP grant G5814-NOOSE.
Data availability statement
All data that support the findings of this study are included within the article (and any supplementary files).
Conflicts of interest or competing interests
No conflict of interest.