
Abstract
Ion bombardment (IB) is a promising nanofabrication technique for producing nanoripples. A critical issue that restricts the application of IB is the limited quality of IB-induced nanoripples. Photoresist (PR) and antireflection coating (ARC) are of technological relevance for lithographic exposure processes. Moreover, to improve the quality of IB-induced self-organized nanoripples, in this study, a PR/ARC bilayer was bombarded at an incidence angle of 50°. The surface normalized defect density and power spectral density, obtained via scanning atomic force microscopy, indicate the superiority of the PR/ARC bilayer nanoripples over those of single PR or ARC layers. The growth mechanism of the improved nanoripples, deciphered via the temporal evolution of the morphology, involves the following processes: (i) formation of a well-grown IB-induced nanoripple prepattern on the PR, (ii) transfer of nanoripples from the PR to the ARC, forming an initial ARC nanoripple morphology for subsequent IB, and (iii) conversion of the initial nonuniform ARC nanoripples into uniform nanoripples. In this unique method, the angle of ion-incidence should be chosen so that ripples form on both PR and ARC films. Overall, this method facilitates nanoripple improvement, including prepattern fabrication for guiding nanoripple growth and sustainable nanoripple development via a single IB. Thus, the unique method presented in this study can aid in advancing academic research and also has potential applications in the field of IB-induced nanoripples.
Export citation and abstract BibTeX RIS

Original content from this work may be used under the terms of the Creative Commons Attribution 4.0 licence. Any further distribution of this work must maintain attribution to the author(s) and the title of the work, journal citation and DOI.
1. Introduction
Ion bombardment (IB)-induced nanoripples [1–9], similar to periodic nanogratings, have gained increasing attention in different fields [10–16] because IB is a one-step, mask-less, and cost-effective method. An outstanding issue that restricts the application of IB is the limited quality of IB-induced nanoripples [17–27]. Although several techniques have been considered to improve IB-induced nanoripples, e.g. upgrading the bombardment strategies by moving [20] or rocking [22, 23] substrates, prepatterning the substrates through advanced lithography to guide the growth of nanoripples [24], sequential bombarding of nanoripples with a low-flux ion beam [19], bombarding germanium with a beam of gold ions with the coupling between the surface morphology and composition [21], or bombarding GaAs above the recrystallization temperature [27], the development of a new method to improve nanoripple quality is still essential and urgent. Investigating the defect annihilation of IB-induced nanoripples is important from the perspective of academic understanding and technical applications.
IB-induced nanoripple masks have been transferred to underlying materials to form nanowires [28–30]. However, the latent advantage of improving nanoripple quality during IB of a bilayer at specific conditions has not yet been reported. It is well known that IB-induced morphologies are associated with initial surface roughness [30–33]. Moreover, photoresist (PR) and antireflection coating (ARC) are of technological relevance for lithographic exposure processes. The IB-induced nanostructures on PR and ARC may improve understanding of the effect of the initial morphology on the pattern evolution during IB and offer potential uses of nanostructures in other materials. In this study, we developed and demonstrated a method of improving the nanoripple quality based on the IB of a PR/ARC bilayer, under the condition that similar nanoripples can be formed on each material of the bilayer at an identical incidence angle. The improved order that results from erosion of the bilayer can be understood using a theory developed by Harrison and Bradley [22, 34].
2. Experiment
Commercially available AZ® MiRTM 701 (14 cps) PR and AZ BARLi®II200 ARC were used [35, 36]. A single PR, single ARC, and PR/ARC bilayer were spin-coated on clean SiO2 substrates and baked, as shown in the right insets of figures 1(a)–(c), respectively. The initial root mean square roughness of the PR and ARC was ∼0.4 nm. To ensure that complete bombardment did not occur on the SiO2 substrates, the thicknesses of the single PR and ARC layers were maintained at approximately 1500 and 430 nm, respectively. Regarding the bilayer system, sufficiently thick PR (∼560 nm) and ARC (∼430 nm) layers were deposited. All the samples were bombarded with 400 eV Ar+ [37] at an incidence angle of 50°. The ion current density was 240 μA cm−2 measured at normal incidence.
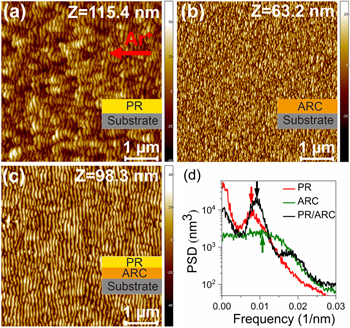
Figure 1. AFM images of the representative morphology on the (a) PR, (b) ARC, and (c) PR/ARC bilayer surfaces. The bombardment time is (a) 20, (b) 5, and (c) 22 min. The red arrow in (a) marks the projection of ion beam direction. The direction of ion beam in other AFM images is the same as that in (a). Right insets in (a)–(c) show the schematic diagram of each sample. (d) PSD curves of the AFM images shown in (a)–(c). The arrows show the ripple wavelengths for the three different cases studied.
Download figure:
Standard image High-resolution imageAn atomic force microscope (AFM) operating in ScanAsyst mode (Bruker Dimension ICON) was used to characterize the surface topography. The 5 μm × 5 μm AFM images were analyzed using SPIPTM software [38]. The evaluation parameters of each AFM image included wavelength (λ), roughness (σ), and power spectral density (PSD). The nanoripple defects were characterized using the normalized defect density (ND) [24, 25], which was expressed as  where N is the number of endpoint defects and A is the scan area. First, a quadratic background including corrugations was subtracted from each AFM image. The flattened AFM image was reduced to a binary black-white image. Then the binary image was thinned to black lines with one-pixel width. For the thinned image, the line segment endpoints, i.e. was determined as defects. The number of black pixels with less than two black neighbor pixels were denoted as N, i.e. the number of endpoint defects.
3. Results and discussion
3.1. Comparison of well-formed morphologies of PR, ARC, and PR/ARC layers
Figures 1(a)–(c) show the AFM images of well-formed ripples on the PR, ARC, and PR/ARC surfaces after IB, respectively. Due to the different morphological evolution rates, the PR, ARC, and PR/ARC surfaces were bombarded for ∼20, ∼5, and ∼22 min, respectively, and the removed thicknesses of the PR, ARC and PR/ARC were approximately 620, 185, 560 (PR)/150 (ARC) nm, respectively. The morphologies of the bilayer were observed on the underlying ARC surface. The nanoripples on the irradiated PR/ARC bilayer are longer and more uniform than those on the PR or ARC. In contrast, the morphology of the irradiated PR consists of curved nanoripples (figure 1(a)), and that of the ARC is mixed with long and short ripples (figure 1(b)). These are also indicated in the comparison of the PSD curves of the three AFM images. The high (low)-frequency peak of each PSD curve is defined as a frequency more (less) than 0.005 nm−1, corresponding to a spatial wavelength of 200 nm. The arrows in figure 1(d) show the dominant frequencies of ripples in units of nm−1 for the three different cases studied. The peak height and full width at half maximum (FWHM) of the high-frequency peak of each PSD curve reflects the order of the ripples. The low-frequency portion of a PSD curve indicates the long-wavelength corrugations of the ripple pattern, which are usually taken as defects. Thus, a higher peak value and narrower FWHM of the high-frequency component, and a lower peak value of the low-frequency component of a PSD curve corresponds a better quality of ripples. The PSD curve in the high-frequency region of the bilayer exhibits a higher peak value and a narrower FWHM than the others. Moreover, the low-frequency peak of the bilayer is much lower than that of the PR. Note that the dominant wavelengths of the three cases are approximately 100 nm, which are larger than those of inorganic materials bombarded at similar ion energies. (Please see comparison and explanation in supplementary (available online at stacks.iop.org/NANO/32/385301/mmedia).)
3.2. Temporal evolution of nanoripples on the PR/ARC bilayer
To compare with the bombardment of the PR/ARC bilayer, we first conducted the bombardment of single PR and ARC layer with the same ion parameters for the bilayer. Figures 2(a)–(e) and (f)–(j) show the AFM images of the irradiated single PR and ARC layers for different bombardment times, respectively. To monitor the nanoripple development on the PR/ARC bilayer (560 nm PR layer, 430 nm thick ARC layer), the temporal change in the surface morphology was measured (figures 3(a)–(e)). The corresponding PSD curves are shown in figures 3(a')–(e'), and the corresponding wavelength (λ), roughness (σ), and ND are plotted in figure 4(c). For comparison, the temporal evolutions of λ, σ, and ND of the single PR and ARC layers (figure 2) are also shown in figures 4(a), (b). The different x-axis scales in figures 4(a)–(c) result from the different morphological evolution rates of the materials. For the bilayer system, based on the thicknesses and etching rates of the PR and ARC layers, we can deduce that figure 3(a) shows the nanoripples on the PR surface, and figures 3(b)–(e) show those on the ARC surfaces.
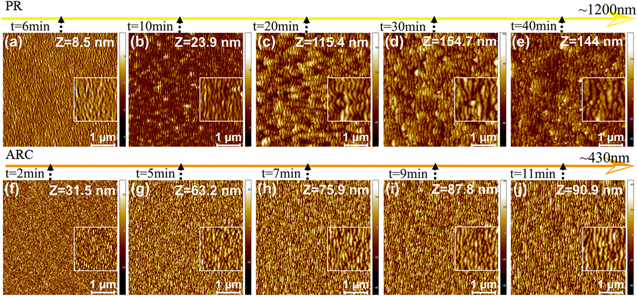
Figure 2. First row: AFM images of PR material in figures (a)–(e) for different bombardment times: (a) 6, (b) 10, (c) 20, (d) 30, and (e) 40 min. Second row: AFM images of ARC material in figures (f)–(j) for different bombardment times: (f) 2, (g) 5, (h) 7, (i) 9, and (j) 11 min. An ion energy of 400 eV and ion-incidence angle of 50° were applied. The height scale Z is specified in each image.
Download figure:
Standard image High-resolution image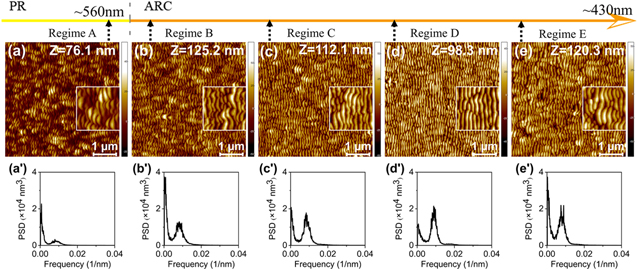
Figure 3. AFM images of the irradiated PR (560 nm)/ARC surface at 400 eV ion energy and ion-incidence angle of 50° for different bombardment times: (a) 16, (b) 18, (c) 20, (d) 22, and (e) 24 min. The height scale Z is specified in each image. (a')–(e') PSD curves of the AFM images shown in figures 3(a)–(e).
Download figure:
Standard image High-resolution image
Figure 4. Wavelength (λ), roughness (σ), and normalized defect density (ND) of the (a) PR, (b) ARC, and (c) PR/ARC bilayer surfaces obtained from AFM morphologies as a function of bombardment time.
Download figure:
Standard image High-resolution imageThe five AFM images (figures 3(a)–(e)) demonstrate the five representative regimes of the temporal evolution of the bilayer morphologies. In regime A, a well-grown curved ripple morphology is formed on the PR layer (figure 3(a)). The corresponding morphological features (figure 3(a)) and the structural parameters (σ, λ, and ND, figure 4(c)) are all similar to those of the single PR (figures 1(a) and 4(a)). In regime B, the PR patterns, behaving like a mask (figure 3(a)), were transferred onto the underlying ARC layer. Thus, the curved ARC nanoripples (figure 3(b)) and the corresponding PSD curves show similarities with the curved PR nanoripples and the corresponding PSD curves in regime A. The increased PSD and σ in regime B can be attributed to the lower etching rate of the PR layer (∼(31.2 ± 5.8) nm min−1) than that of the ARC layer (∼(36.5 ± 2.4) nm min−1). The ARC nanoripples in regime B become the initial morphological structures for the subsequent regimes.
As observed in figures 3(b)–(d), the nanoripples become uniform with more continuity and the nanoripple order is gradually enhanced, which can be verified from the corresponding PSD curves and reduced ND. This reflects also in the increasing high-frequency and decreasing low-frequency parts in the PSD curves (figures 3(b')–(d')). The narrow FWHM indicates increasing uniformity of λ. The constantly decreasing ND implies better continuity of the ripples. Thus, regimes C and D are called the developing and developed regimes, respectively. In regime D, the best ripple ordering (figure 3(d)) is achieved.
In regime E, the wavelength (λ), roughness (σ) and normalized defect density (ND) are starting to rise again (figure 4(c)). Ripple evolution has been saturated in regime D. For longer erosion times the well-grown nanoripples degrade and more defects develop (regime E). The increase of λ, σ and ND are attributed to the increasing growth of long-wavelength corrugations, corresponding to the increase of the low-frequency PSD curve (figure 3(e')). This evolution trend also occurs in saturation IB of other monolayer materials [39–43].
In summary, we illustrated the typical regimes (regimes A, B and D) of the irradiated bilayer, as shown in figures 5(a)–(c). Figures 5(d)–(f) show typical 3D AFM images of the result in figure 3 of the bilayer in regimes A, B, and D. As shown in figures 5(a), (d) and (b), (e), transitions occurred from the PR to the ARC layer between regimes A and B. The prepatterned PR formed in regime A induced and guided the initial ARC ripples in regime B. These initial ARC nanoripples were further developed in regimes C and D, and the order of the ARC nanoripples was gradually enhanced. In particular, as shown in figures 5(c), (f), the most uniform nanoripples were formed on ARC in regime D. This order enhancement corresponds to the uniformity in the structural parameters of the nanoripples. As shown in figure 4(c), the wavelength of the bilayer is close to that of the single ARC layer (figure 4(b)) with the increasing bombardment time. This indicates that the growth mechanism of the ARC plays an important role in the further nanoripple growth during regimes B–E.
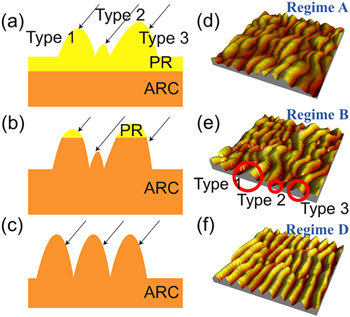
Figure 5. (a)–(c) Schematics of the typical regimes (regimes A, B, and D) of the irradiated bilayer with three representative ripple profile types, 1, 2 and 3. (d)–(f) Typical 3D AFM images of those shown in figures 3(a), (b), and (d), i.e. the 3D AFM images of the bilayer in regimes A, B, and D, respectively.
Download figure:
Standard image High-resolution image3.3. Statistics and analysis of nanoripple temporal evolution on the PR/ARC bilayer
To verify the uniformity of the nanoripples, we further analyzed the evolution of the cross-sectional parameters of each ripple profile (figure 6). A specific ripple profile, above a threshold height, was characterized by a pair of height and width values, (h, w) (figure 6(a)). Particularly, the particle-capture function of the SPIP software was used to capture and analyze these ripples. The distribution of (h, w) can be grouped into three types, which are also shown in figure 5. Types 1–3 represent nanoripples whose (h, w) values are close to, lower, and higher than those of the improved ripple pattern on the irradiated surface of the PR/ARC bilayer (figures 1(c) or 3(d)). For example, based on the scatter diagram of (h, w) shown in figure 6, types 1, 2, and 3 correspond to ripples with (15 nm < h < 30 nm) ∩ (40 nm < w < 120 nm) (the red-dashed-square region in figure 6(c)), (h < 30 nm ∩ w < 40 nm) ∪ (h < 15 nm ∩ w < 120 nm) (the blue-dashed-square region in figure 6(c)) and (h > 15 nm ∩ w > 120 nm) ∪ (h > 30 nm ∩ w > 40 nm) (the green-dashed-square region in figure 6(c)), respectively.

Figure 6. (a) Schematic of the definition of the parameter pair (h, w) of the cross-sectional profile of an AFM image. A horizontal line is shown as the height threshold for the parameter statistics. (b)–(f) [Left y, lower x] Scatter diagrams of (h, w), and [right y, upper x] height histograms of h of the AFM images shown in figures 3(a)–(e).
Download figure:
Standard image High-resolution imageAt first, the distribution of (h, w) is dispersive (figure 6(b)). Figures 6(c)–(f) show that with the increasing bombardment time, the scattered distribution of (h, w) gradually focuses to a parameter range of (23 ± 6.5 nm, 80 ± 40 nm), centered at (23 nm, 80 nm) in regime D. In detail, to directly demonstrate the evolution of height, height histograms were extracted and shown in the right y-/upper x-axis of figures 6(b)–(f). For well-grown curved PR ripples (figure 3(a)), the corresponding height histogram shows a positively skewed distribution and large FWHM (figure 6(b)). For regimes B–D, the height distributions evolve from a positive to a normal distribution and become more uniform. In regime D, the peak height (h0) and its standard deviation (Δh0) are 23 nm and 6.5 nm, respectively. The newly evolved nanoripples with a height within the average range of (23 ± 6.5) nm may originate from the nanoripples with 0 < h < 15 nm and h > 30 nm. The proportion of ripples with 0 < h < 15 nm significantly reduced by two-thirds from regime B to D, and that of ripples with h > 30 nm was almost non-existent. Both evolutions, especially the ripples of height 0 < h < 15 nm, contribute to the improved height uniformity in regime D. Further, this indicates sustainable development of nanoripples on the ARC surface in regimes B–D.
The evolution of the width histogram (figure S1) is similar to that of the height histogram. The width histogram of the well-formed nanoripples in regime D shows a normal distribution with a peak width and corresponding standard deviation of 80 and 40 nm, respectively. Although the overall roughness decreases in regimes B–D, as shown in figure 4(c), filtering the roughness of the low-frequency morphologies, the roughness of the high-frequency nanoripples slightly increases (figure S2). This also indicates the ripple development in regimes B–D.
3.4. Effect of initial PR thickness on PR/ARC morphology
To demonstrate the effect of initial prepatterned PR ripples due to different PR thickness, we further conducted IB on the bilayer using different PR thicknesses. According to the temporal evolution of λ, σ, and ND for the single PR layer shown in figure 4(a), the thickness of the top PR layer affects the size of the initial prepatterned PR ripples, and this in turn influences the size of the initial ARC ripples. The thicknesses of the top PR layer were chosen as ∼230, 380, and 730 nm, corresponding to weak, developing, and overdeveloped PR ripples, similar to those as shown in figures 2(a), (b), and (d). The thickness of the underlying ARC layer of all these three samples was ∼430 nm, which was the same as that of the bilayer sample discussed in section 3.2. Moreover, based on the erosion rate of the ARC, the removed thicknesses of the ARC layers were intended to be the same after IB (∼155 nm). Figures 7(a)–(c) show the AFM images of well-formed nanoripples on the ARC layer of the bilayer on the PR layer thickness. Figure 7(d) shows the corresponding PSD curves, together with that of the bilayer with a PR thickness of ∼560 nm (figure 1(c)). The PSD for the 560 nm thick PR shows the maximal peak value and minimal FWHM. This indicates the superior quality of the bilayer ripples formed with the 560 nm thick PR. Thus, we can deduce that the quality of underlying ARC ripples is strongly correlated to that of the initial PR nanoripples. Because bombardment with the 730 nm thick PR resulted in degraded prepatterned PR ripples, the defect amplification in subsequent bombardment caused worse nanoripples on the underlying ARC. Thus, the quality of the underlying ARC ripples is degraded.

Figure 7. AFM images of the irradiated PR/ARC bilayer surfaces at 400 eV ion energy and ion-incidence angle of 50° for different thicknesses of the PR layer: (a) 230, (b) 380, and (c) 730 nm. The bombardment times of the result were: (a) 10, (b) 15, and (c) 30 min, respectively. (d) PSD curves of the AFM images shown in (a)–(c) and figure 1(c).
Download figure:
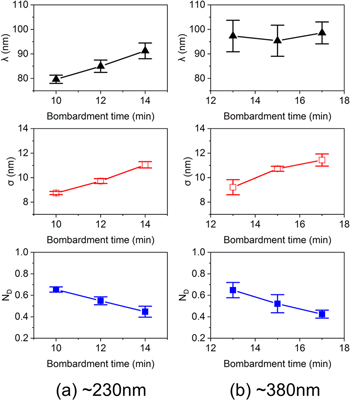
Standard image High-resolution imageFigure 8 shows the temporal evolution of the bilayer profile with PR thicknesses of 230 and 380 nm. In principle, the ripple evolution of the underlying ARC of a PR/ARC depends on the initial ARC ripples obtained from the PR ripple mask. The wavelength of well-formed ARC ripples λARC of ∼100 nm, as shown in figure 4(b). For the sample with the top PR thickness of ∼230 nm, as shown in figure 8(a), the wavelength of the ripple patterns is ∼80 nm for the bombardment time of 10 min, smaller than λARC. Thus, a mostly monotonic increase of λ with the bombardment time for the PR thickness of 230 nm can be seen in figure 8(a). For the sample with top PR thickness of ∼380 nm, as shown in figure 8(b), since the wavelength of the initial ARC ripples is close to λARC, a weak fluctuation close to λARC can be seen in figure 8(b). For the sample with top PR thickness of ∼560 nm, as shown in figure 4(c), since the wavelength of the initial ARC ripples is larger than λARC, a mostly monotonic decrease to λARC can be seen in front end of figure 4(c). As shown in figure 8, because the roughness σ of the underlying ARC ripples on the bilayers bombarded for ∼10 and 13 min, both smaller than the saturated roughness of the single ARC layer (see figure 4(b)), a monotonic increase of σ with the bombardment time for the PR thicknesses of ∼230 and 380 nm is obtained.
Figure 8. Temporal evolution of wavelength (λ), roughness (σ), and normalized defect density (ND) of the irradiated PR/ARC bilayer surfaces for different thicknesses of the PR layer: (a) 230 and (b) 380 nm.
Download figure:
Standard image High-resolution image
3.5. Heuristic explanation of the enhanced order produced by bombarding the PR/ARC bilayer
In this subsection, we will give an intuitive explanation of why bombarding the PR/ARC bilayer leads to ripples with better order than can be obtained by bombarding a PR or ARC film. First, however, it will be necessary to provide some background.
Harrison and Bradley have carried out simulations of the time evolution of the surface of an elemental solid that is bombarded by a broad beam of noble gas ions with a polar angle of incidence θ that varies periodically in time [22]. In an experiment, the periodic variation of θ can be achieved by rocking the sample about an axis orthogonal to the surface normal and the incident ion beam. The coefficients in the equation of motion (EOM) for the surface depend on the angle of incidence, and so periodic rocking of the sample has the effect of making these coefficients periodic in time. Harrison and Bradley's simulations showed that a remarkable degree of order emerges for a broad range of parameters. Thus, temporally periodic variation of the parameters in the EOM can lead to near perfect spatial periodicity. Recent experiments have confirmed that the order in the surface ripples can be dramatically enhanced by rocking the sample during IB [23].
In the simplest scenario that leads to improved order, the angle of incidence θ is periodically and suddenly switched between two different values, θ1 and θ2 [22]. When θ has one of these two values, say θ = θ1, the amplitude of the ripples grows rapidly and the order in the ripples increases. Conversely, when θ is equally to θ2, the amplitude of the ripples decreases. As the rocking continues, the order steadily increases. It is important that the period of time in which θ is equal to θ1 not be taken to be too long, however, because otherwise after the ripple amplitude has grown rapidly and the order has improved, the amplitude begins to saturate and the order begins to deteriorate. θ1 and θ2 must also be selected so that ripples would develop if the angle of incidence were held fixed at either of these two angles.
There is another way in which periodic variation in the parameters in the EOM can be achieved [34]. In this alternate approach, the sample is held fixed and the angle of ion-incidence θ is constant. The sample, however, is a superlattice composed of alternate layers of two different materials which we will call A and B. Roughly speaking, as erosion of the superlattice proceeds and the average surface height decreases, the parameters in the EOM oscillate between the values for material A and the values for material B. Simulations have shown this type of periodic variation of the parameters in the EOM can also lead to improved ordering if the materials A and B and the thicknesses of the two types of layers are chosen appropriately [34]. There is in fact a close analogy between how improved order develops during bombardment of a superlattice and how it develops during bombardment of a rocked elemental target. In particular, when most of the surface is within one of the two materials, say material A, the amplitude of the ripples grows rapidly and the order in the ripples grows. Conversely, when most of the surface is in material B, the amplitude of the ripples is reduced. The order steadily improves as the solid surface alternately passes through materials A and B.
In fact, some of the improved order that can be realized by bombarding an A/B superlattice can be obtained by bombarding a single B/A bilayer [34]. First, ripples develop as the film of material B is eroded away. Then, as the surface enters material A, the ripple amplitude grows and the order in the ripples improves. The erosion of material A should not be continued for too long, however, because past a certain point the ripple amplitude begins to saturate and some of the improved order is lost.
The scenario described in the preceding paragraph was realized in the experiments in which we bombarded a PR/ARC bilayer. In our experiments, PR played the role of material B, while ARC played the role of material A. After ripples developed as the PR layer was eroded, their amplitude grew and the order improved as the surface entered the ARC layer, as seen in figures 3(b')–(d') and in the plots of σ and ND in figure 4(c). If the bombardment was continued too long, the order began to deteriorate, as shown in figure 3(e') and in the plot of ND in figure 4(c).
3.6. Comparison of results to former reports on ripple improvement
The ripple improvement occurred in our bilayer system because two key conditions were satisfied. First, in regimes B–D, sustained ripple growth on the ARC occurred, in contrast to what has been reported for other bilayers. At first sight, the ripples transferred from the PR to the ARC layer seem similar to those transferred from Au to glass at θ = 82° in the experiments of Chiappe et al [28]. However, the quality of the ripples did not improve in the glass, which we attribute to the fact that ripples do not form on the glass used by Chiappe et al at θ = 82°. Second, the wavelength [24, 26] and amplitude [44] of the prepattern play an important role in guiding the pattern growth. In particular, the order in nanodots arrays can improve if a prepattern is used that has a period that is approximately equal to or double the wavelength of the nanodots grown on a smooth substrate [26]. In this study, the wavelengths of ripples on PR and ARC are close to each other, as seen in figure 1(d). This is crucial to inducing a strong interaction between the morphology of the prepatterned PR ripples and ripples that subsequently develop on the ARC film. Compared to the prepatterns produced by traditional lithography [24, 45], our method of fabricating prepatterns via IB is simple and cost-effective.
4. Summary
In conclusion, we developed and demonstrated an IB-based growth method for improving the nanoripple quality on a PR/ARC bilayer with an identical ion beam incidence angle. Uniform nanoripples with a markedly reduced density of defects were achieved, as is evident from the AFM images and corresponding statistical analyses. This method can be considered as an integration of IB-induced PR ripples through prepattern formation and sustainable evolution of ripples on ARC. A remarkable synergy between the two processes was obtained under conditions of comparable wavelengths and suitable amplitudes.
In future, matching conditions and material types for fabricating the prepattern and underlying layer will be studied for wider applications. Moreover, future studies will also need to investigate in detail the interface transitions owing to the surface complexity near the PR/ARC interface.
Acknowledgments
This work was supported by the National Natural Science Foundation of China (Grant No. 11675169) and by Grant DMS-1814941 awarded to RMB by the US National Science Foundation.
Data availability statement
All data that support the findings of this study are included within the article (and any supplementary files).