

Abstract
In the present work, a fluorescent gold nanoclusters (GNCs)/superparamagnetic (Fe3O4/GNCs) nanoprobe was prepared via a facile approach for the selective detection and imaging of human leukemica cancer cells (HL-60). (γ-Mercaptopropyl)trimethoxysilane (MPS) was used as a stabilizer to prepare functionalized GNCs. The prepared GNCs@MPS was then self-assembly decorated on the surface of Fe3O4@SiO2 nanoparticles followed by poly(ethylene glycol) dimethacrylate (PGD) addition at room temperature to form Fe3O4/GNCs nanoprobe. Surface functionalization of the Fe3O4/GNCs with the thiol-modified KH1C12 aptamer was done through thiol-en click reaction between PGD and the thiol group of the aptamer. An extensive characterization of the Fe3O4/GNCs revealed strong red fluorescence (λem = 627 nm), T2-based contrast agent for MRI and excellent colloidal and photo stability in buffer medium. So, the aptamer-functionalized Fe3O4/GNCs nanoprobe (Fe3O4/GNCs/Aptamer) is capable to uptake and dual-image HL-60 cancer cells from a mixture. Furthermore, the MRI signal intensity of the pictures decreased linearly with an increase in the concentrations of the nanoprobe. It is also enable to detect cancer cells from a range of concentrations 10 up to 200 cells μL−1. The fluorescent/magnetic characteristics of the nanoprobe are of great significance for MRI-based and fluorescence imaging and collection of HL-60 cancer cells which implies potential help for the development of early diagnosis of highly malignant human leukemia.
Export citation and abstract BibTeX RIS
1. Introduction
In cancer theranostics, it is extremely important to detect cancer cells in their early stages using high sensitive methods [1, 2]. Effective strategies for cancer diagnosis help scientists to select accurate therapeutic pathways [3]. In addition, finding methods for early detection of diseases is essential to distinguish and monitor diseases especially those which are susceptible to return. Current methods for detection of leukemia include karyotyping [3, 4], flow cytometric immunophenotyping [5] or microarray [6], and PCR (polymerization chain reaction) [7]. Immunophenotyping of cancer cells employs antibodies to monitor the changes of the cell antigens which helps to differentiate leukemia cells from normal cells [3]. The sensitivity of this method is limited by the fact that the antigens used for cell detection do not particularly exist on any individual cells which results in inaccurate signals [3]. Therefore, multiple antibody probes are often used in immunophenotypic analyses for accurate cellular recognition which enhances the cost, complexity and time of the assay [3]. PCR-based analysis can be used as a highly sensitive diagnostic tool for cell detection [3, 8, 9]. However, in this method, the cells are indirectly detected by monitoring their RNA expression. In fact, PCR analysis requires several consequent isolation steps which is really time-consuming [3]. Furthermore, the effectiveness of this method is limited by its variable sensitivity leading to false-negative results, where low-level signals are expected with those tumor cells that are oracular [7]. Therefore, development of sensitive, rapid and cost-effective cell recognition methods has paramount importance in cancer diagnostics [3].
Unlike normal cells, cancer cell lines often show significant variations in their surface which can be monitored to study the state and progression of the disease [10, 11]. It is well-known that the molecular recognition of cancer cells increases the sensitivity and selectivity of the diagnostic method and it is an alternative for traditional assays [12]. In recent years, aptamers have been successfully employed for such specific recognition of cancer cells. These novel recognizing molecules are single-stranded (or double-stranded) oligonucleotides which demonstrate high affinity to cancer cells with excellent specificity [13]. These smart molecules are synthesized using an in vitro process called systematic evolution of ligands by exponential enrichment (SELEX) and can be designed against various cancer cells [12, 14, 15]. For molecular recognition of cancer cells, aptamers have several advantages compared with antibodies, including easier synthesis routes and molecular modification, more stability, and compatibility with the immune system. So, aptamers are considered as excellent candidates to be employed for diagnostic applications [16, 17].
The noble metal nanoclusters consist of a few to several hundred atoms [18, 19] with dimension close to the Fermi electron wavelength [20]. The size of these nanostructures is larger than metal atoms and smaller than nanoparticles [21]. In this case, there is a strong quantum confinement effect in metal nanoclusters resulting in breaking up their density of states. This indicates the molecular-like and attractive optical properties for metal nanoclusters [22, 23]. In cancer research, gold nanoclusters (GNCs) have been widely employed to detect cancer cells through the conjugation of suitable targeting molecules (such as aptamers and antibodies) on the surface of nanoclusters.
Apart from the fluorescent nanoclusters, magnetite nanoparticles have shown remarkable applications in biology [24, 25]. They possess excellent magnetic properties which is of great importance for biological applications such as contrast agent in magnetic resonance imaging (MRI) diagnostic technique, drug delivery and hyperthermia [26, 27]. Cell collection and separation are other interesting applications of magnetic nanoparticles in biology.
For the goal of in vitro or in vivo imaging and targeting cancer cells, high attention has been given in developing multi-functional nanoparticles especially hybrid nanomaterials by fusing fluorescent nanoclusters with magnetite nanoparticles [24, 28–30]. Hybridization of magnetite nanoparticles with GNCs results in a multimodal platform which benefits from the unique properties of both materials [31, 32]. The GNCs as exterior layer can also provide sites for conjugation of desired biomolecules [31]. With the development of synthetic methods in nanotechnology, a wide range of magnetic nanoparticles and GNCs have been synthesized in recent years [33]. For example, Durgadas et al [24] reported the synthesis of GNCs/superparamagnetic nanoparticles for selective removal of C6 glioma cells from a mixture. Also, the ability of the hybrid for imaging of the separated cells was investigated. Bao et al [34] synthesized bifunctional Au-Fe3O4 nanoparticles and modified their surface with nitrilotriacetic acid as a targeting molecule using Au–S chemistry for separation of proteins. Araujo and his co-workers [35] synthesized a magnetite nanoparticles decorated with strawberry-like gold nanoparticles. The nanocomposite is able to detect and separate the plasma protease C1 inhibitor and heat shock protein HSP75 which are considered as the two biomarkers to study of myeloma progression. Hoskins et al [31] reported the fabrication of a nanohybrid comprising of magnetite and gold nanoparticles. Their results showed the potential of the nanohybrid as a dual-functional nanomaterial (MRI contrast agents and nanoheaters) for cancer therapy. To date, the synthesized Fe3O4-Au nanostructures show excellent colloidal stability, but most of them have not been functionalized with aptamer for simultaneous selective separation and imaging of highly malignant cancer cells from a mixture.
In this research, a Fe3O4/GNCs/Aptamer nanoprobe was synthesized for both MRI-based and fluorescence imaging and cell separation applications. First, magnetic nanoparticles with suitable size were synthesized and silica coated. The freshly prepared GNCs with thiol-decorated silica layer were attached to the surface of the Fe3O4 NPs through expansion of silica networks in the present of poly(ethylene glycol) dimethacrylate (PGD). The nanocomposite was self-assembly covered with thiol-modified KH1C12 aptamer for specific detection of the HL-60 cells in the presence of HepG2 cells. In addition, we used a serial dilution method to show the sensitivity of the designed nanoprobe to detect a various range of HL-60 cells.
2. Experimental section
2.1. Materials and methods
See supporting information, available online at stacks.iop.org/NANO/31/025605/mmedia.
2.2. Synthesis of silica-modified Fe3O4 nanoparticles
Fe3O4 NPs were synthesized according to the literatures with some modifications [36]. Briefly, 4.0 g of iron(III) nitrate and 1.0 g of iron(II) chloride were added to 100 ml of deionized water in a three-necked flask under N2 atmosphere. Then, 16.0 g of trisodium citrate salt was added to the solution in one portion under mechanical stirring. The temperature of the reaction was raised to 80 °C and a solution of sodium hydroxide (2.0 M) was added quickly. The pH of the solution was checked frequently to stay at 9.0. The reaction mixture was stirred for 1 h, followed by cooling down at room temperature. The synthesized Fe3O4 NPs were easily separated from the solution using a magnet and washed three times with deionized water. For silica coating, 0.2 g Fe3O4 NPs were redispersed in a mixture of 100 ml ethanol and 0.5 mL ammonium hydroxide in a round-bottom flask. Then, 800 μL of tetraethyl orthosilicate (TEOS) was added slowly at room temperature under stirring. After passing 1 h, deionized water (1.0 mL) was added to the mixture. The product was magnetically separated, washed three times and dried overnight.
2.3. Synthesis of MPS-modified GNCs
Preparation of the GNCs with MPS (MPS = (γ-Mercaptopropyl)trimethoxysilane) shell was done according to the following procedure. First, 10 μL of tetrachloroaurate(III) was added to 5.0 mL of methanol and then 13 μL of MPS was added under continuous stirring at room temperature. Amount of 3.0 mg of sodium borohydride was dissolved in 2.0 mL of methanol and added in one portion to the above mixture. It was then allowed completing the reaction for 1 h. The final reddish-brown solution was magnetically separated to remove the unreacted materials and redispersed in PBS- buffer (1.0 ml, 10 mM, pH 7.4).
2.4. Synthesis of Fe3O4/GNCs/Aptamer
First, the freshly prepared GNCs were conjugated to the Fe3O4@SiO2 NPs. For this purpose, 3.0 mL of the GNCs@MPS solution (200 μg mL−1) was added to 3.0 mL of 16 μg mL−1 Fe3O4@SiO2 aqueous solution. Subsequently, (polyethylene glycol) dimethacrylate (PGD) was added to the mixture. This solution was stirred for 2 h to complete the reaction, after which the Fe3O4/GNCs nanoparticles were magnetically collected, washed with deionized water, and finally redispersed in PBS- buffer (1.0 mL, 10 mM, pH 7.4). Immobilization of thiol-functionalized KH1C12 aptamer on the surface of Fe3O4/GNCs was done according to the following procedure. For aptamer activation, 15.0 μL (5.0 μM) of the aptamer solution (in PBS-, 10 mM, pH 7.4) was incubated with 100 μL of 1.0 mg mL−1 DTT at 30 °C for 30 min. To conjugate aptamer with the nanoprob, the activated aptamer solution was mixed with the nanoprobe and thermal initiator V50 (1 mg) and they were incubated at 55 °C for 5 h. The Fe3O4/GNCs/Aptamer nanoparticles were magnetically collected and the concentration of unreacted aptamer (in the supernatant) was measured by spectrophotometry.
2.5. Cell culture and cytocompatibility assay
MTS assay was employed to study the cytotoxicity of the synthesized nanoprobe. The HL-60 cancer cells were cultured in a 96-well plate to reach about 70% confluency. Before addition of the nanoprobe to cancer cells, the culture medium was aspirated and replaced with 150 μL of fresh medium, followed by cell incubation for 30 min. Then, the nonoprobe (1–4 nM) was incubated with the cells for 48 h. Untreated cells and doxorubicin (DOX, 7.5 μM) were also considered as negative and positive controls, respectively. After the nonoprobe incubation, an aliquot of 15 μL MTS solution was added to each well and incubated for a further 4 h at 37 °C. To estimate the cell viability, the absorbance of each well was recorded with a microplate reader at 490 nm.
2.6. Flow cytometry analysis
To investigate specific internalization of KH1C12 aptamer-functionalized nanoprobe into the cancer cells, flow cytometry analysis was performed. HL-60 and HepG2 cells were cultured in a 12-well plates for 24 h (i.e. 2.5 × 10⁵ cells well−1), followed by their incubation with 75 nM of the nonoprobe for 2 h at 37 °C. Then, the cells were centrifuged at 1800 rpm for 7 min. After removing the supernatant of each well, the cells were redispersed in PBS–. Internalization of the nanoprobe was evaluated by monitoring the fluorescence of GNCs in 627 nm.
2.7. Cell imaging
HL-60 and HepG2 cells were grown in a 24-well plate for 24 h (i.e. 2 × 10⁴ cells well−1). Then, the nanoprobe (60 nM) was added to each well and incubated for 2 h at 37 °C. The cells were washed three times with PBS– to remove the excess nanoprobes in advance.
2.8. Cell sensing with GNCs/Fe3O4/Aptamer
A 96-well plate was prepared by dispensing into each well a range of 10–200 cells of HL-60 along with 20 μL of a 450 nM of Fe3O4/GNCs/Aptamer nanoprobes. The final volume in each well reached to 150 μL. The experiments also included a negative control (the wells containing the culture medium along with untreated cells) and each concentration was repeated three times. The plate was placed in the incubator at 37 °C for 2 h. The emission of the fluorescent nanoprobes was monitored at 627 nm in refer to the emission of culture medium and the background emission of the cells.
2.9. Magnetic resonance imaging (MRI)
Different concentrations of the nanoprobe (0.01, 0.02, 0.03, 0.04, and 0.05 mM) were prepared in deionized-water. T2-weighted images were obtained under a 1.5 T clinical MRI scanner (Siemens MAGNETOM Trio Tim) at room temperature. The relative light intensity of the spots was compared using ImageJ software.
3. Results and discussion
3.1. Characterization of the fluorescent/magnetic nanoprobe
A facial approach was used to prepare multi-functional nanoprobe with simultaneous fluorescent and magnetic properties for selective detection and collection of suspended cancer cells from a mixture. In this regard, as shown in scheme
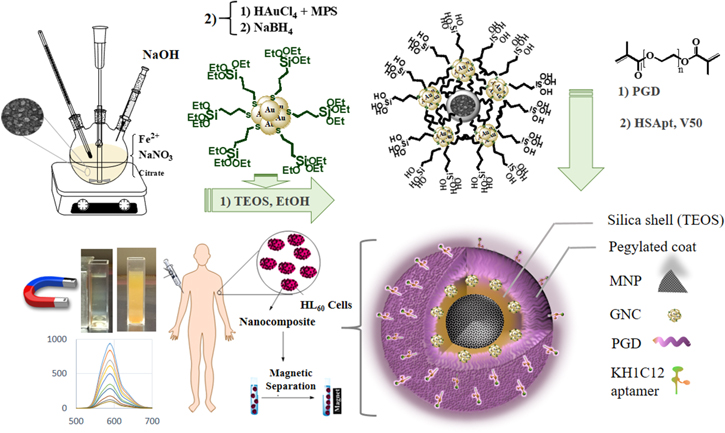
Scheme 1. Schematic illustration for the preparation of Fe3O4/GNCs/Aptamer nanoprobe.
Download figure:
Standard image High-resolution imageThe highly dispersed magnetic NPs were prepared in an aqueous solution based on our previous report [37]. As shown in figures 1(A), (C), highly monodispersed magnetic NPs with an average diameter of 17 ± 4 nm were synthesized with a narrow size distribution as shown in the histogram. This synthesis route produces a gram-scale of hydrophilic Fe3O4 NPs that can be redispersed in water [38]. The FESEM image (figure 1(B)) approves the spherical morphology of the Fe3O4 NPs. Silica-coated Fe3O4 NPs (Fe3O4@SiO2) were prepared by sol-gel reaction with an organosilicon coupling agent (TEOS) [39]. Figures 1(D), (E) shows TEM and FESEM images of the Fe3O4@SiO2 NPs. In figure 1(D), silica shell can be seen as a translucent region around the Fe3O4 NPs [40]. According to our previous experiment [37] the thick silica shell can reduce the magnetic property of the Fe3O4 NPs and also increases the overall particle size. So, in this experiment, the silica shell thickness was adjusted to be 3 ± 1 nm and the mean particle diameter of the prepared Fe3O4@SiO2 NPs is 20 nm with a narrow size distribution range (figure 1(F)).
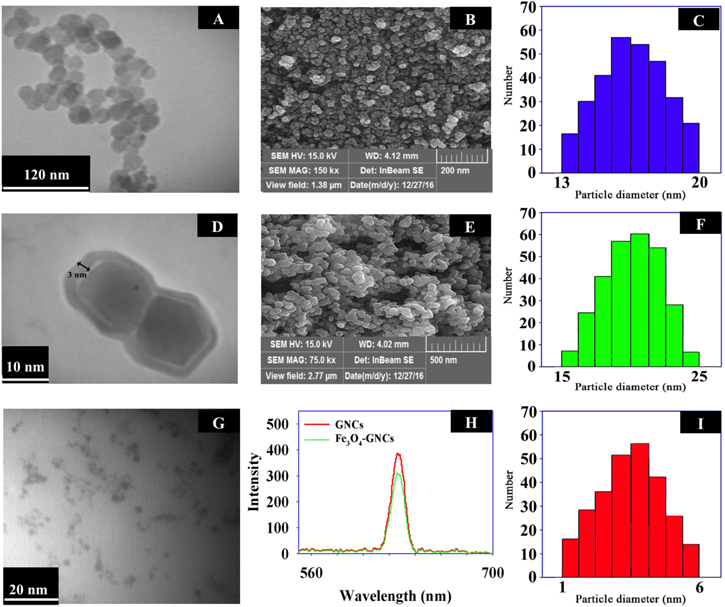
Figure 1. TEM and FESEM images of Fe3O4 (A), (B) and Fe3O4@SiO2 (D), (E) nanoparticles. The corresponding size distribution histogram of Fe3O4 (C) and Fe3O4@SiO2 (F) nanoparticles. TEM and size distribution histogram of GNCs (G), (I). Fluorescence spectra of GNCs before and after conjugation with Fe3O4 NPs (H).
Download figure:
Standard image High-resolution imageThe GNCs@MPS nanoclusters, as the fluorescent component of the nanoprobe, were synthesized in a facial method. The TEM image and particle size dispersity of the synthesized GNCs are given in figures 1(G), (I). According to the histogram, the nanoclusters demonstrate a narrow size distribution range with a mean particle size of about 3.5 ± 0.5 nm. Fluorescent property of the synthesized GNCs was also studied and the result indicates an emission peak at around 627 nm (λex = 520 nm) (figure 1(H)), which is consistent with previous reportes [24, 41, 42]. To estimate fluorescence quantum yield (QY) of the GNCs, rhodamine 6 G (QY: 0.95 in ethanol) was used as the standard. The results show a QY of about 1.1% for the GNCs at room temperature.
In situ generation of the gold nanoparticles in the presence of high affinity ligands results in formation of small particles, because of the growth quenching of the primary particles by the ligands keeping the size dependent optical property [43]. It is well known that thiols can lead to the formation of GNCs due to the soft-soft interactions between Au and S atoms [18, 43]. In addition, the thiol-capped GNCs represent a long-time emission which reduces auto-fluorescence interferences in biological experiments through time-resolved luminescence techniques [44]. An intermediate of Au(I)-S complex is formed after addition of H[AuCl4] complex to the MPS solution [45]. In this case, thiol group in the MPS partially reduces the Au(III) ions. Then, to complete the formation of the GNCs, a strong reducing agent (such as NaBH4) is added to the reaction medium. Conjugation of MPS with the GNCs was evaluated by FT-IR spectroscopy. Figure S1 (supporting information) shows the spectra of MPS and GNCs@MPS. In the MPS spectrum, the presence of two bands at 1112 and 985 cm−1 are assigned to the Si–OH and Si–O–Si groups, respectively [45]. The band of 2500 cm−1 is attributed to the H–S stretching vibration of MPS [46], which is not observed in the GNCs@MPS spectrum confirming the successful conjugation of MPS with the GNCs [45].
Next, to the Fe3O4@SiO2 NPs, a solution of the freshly prepared GNCs was added at room temperature to synthesize the desired nanoprobe through silanization reaction between Si–OH groups of MPS and TEOS [45]. Finally, the PGD was used to functionalize the surface of the nanoprobe for further conjugations. A slight decrease in the fluorescent intensity of the prepared nanoprobe can be seen in figure 1(H) which is related to the quenching effect of the Fe3O4 NPs due to some intrinsic properties of the Fe3O4 NPs [47]. Figures 2(A), (C) show the TEM image and the size distribution histogram of the Fe3O4/GNCs nanoprobe and illustrate that majority of the nanoprobes have particle size of about 26 nm. From the TEM image, it can be clearly seen that some darkened GNCs with a particle diameter of about 3 nm are surrounded on the surface of Fe3O4 core NPs. In the TEM image, some aggregated of interconnected particles are appeared. The FESEM image of the Fe3O4/GNCs nanoprobe (figure 2(B)) shows that the gold shell decorated on the surface of the Fe3O4 NPs and consists of a few adjacent GNCs [48]. The XRD method was used to characterized the crystalline structure of Fe3O4/GNCs (figure 2(D)). The lattice spacing estimated from the diffraction peaks located at 30.2, 35.4, 43.5, 53.4, 57.1 and 62.7° well matches with the [220], [311], [400], [422], [511] and [440] Fe3O4 planes, respectively. The peaks of the gold crystals are clearly observed at 38.1, 44.2, 64.6, 77.5 and 81.8°, which are assigned to the [111], [200], [220], [311] and [222] gold planes, respectively [33]. The results obtained from XRD patterns indicate the existence of Fe3O4 and gold nanocrystals in the nanoprobe structure [33]. A broad peak from θ = 23.66 to 28.99° can be related to the amorphous silica confirming the presence of the silica in the nanoprobe structure [40]. The EDAX data (figure 2(E)), indicate the existence of Cu, Fe, Au, O, C, Si and S elements in the Fe3O4/GNCs structure, demonstrating the formation of the nanoprobe. The Cu element can be related to the copper grid used for the preparation of TEM sample. In addition, the magnetic property of nanoprobe (figure 2(F)) was investigated using VSM method. There is not any hysteresis loop in the magnetization curves, indicating a superparamagnetic behavior of Fe3O4/GNCs nanoprobes. The VSM curves also show that the magnetization of Fe3O4/GNCs decreased from 50 to 30 emu g−1 after wrapping with silica and GNCs layers, respectively [28]. This result shows that the nanoprobe is covered with non-magnetic silica and GNCs layers. In this study, ICP-OES technique was employed to quantitate the metal composition of the Fe3O4/GNCs nanoprobe. According to the obtained results, the molar ratio of GNCs:Fe3O4 in nanoprobe composition is 54:1. At this optimized ratio, the surface of the Fe3O4 NPs is covered uniformly with GNCs.

Figure 2. Characterization of the Fe3O4/GNCs, TEM image (A), FESEM image (B), size distribution histogram (C), XRD spectrum (D), EDAX analysis (E) and VSM curves of (1) Fe3O4, (2) Fe3O4@SiO2 and (3) Fe3O4/GNCs nanoprobe (F).
Download figure:
Standard image High-resolution image3.2. Bioconjugation of Fe3O4/GNCs nanoprobes
Due to the optical and magnetic properties of the nanoprobe, in the next step, the nanoprobe was functionalized with aptamer for cell imaging and separation. Conjugation of thiol-functionalized KH1C12 aptamer was done via a fast click reaction between the thiol group of the aptamer and the double bond in PGD. Figure S2 shows the two-dimentional structure of the aptamer predicted by bioinformatics software (mfold). First, the conjugation of PGD with the nanoprobe was studied by FT-IR spectroscopy. The strong vibrational bands of PGD are clearly seen at 1622, 1588 cm−1 and 955 cm−1, which are assigned to C=O, C=C and C=C–H of PGD, respectively (figure S3). After conjugation of aptamer with the Fe3O4/GNCs nanoprobes via PGD, a new peak at 625 cm−1 appears in the spectrum. This shows that the aptamer was successfully conjugated to the surface of the nanoprobe.
Before the biological application, stability of the prepared Fe3O4/GNCs/Aptamer was evaluated using dynamic light scattering in different pH conditions. According to the literature reports, the extracellular pH (6.2–6.9) is more acidic than intracellular pH (7.12–7.65) [37]. So, the stability of the nanoprobe was examined at three different pHs (6.2, 7.4 and 7.6) in PBS– medium. As can be seen in figure S4, the size of Fe3O4/GNCs/Aptamer nanoprobe does not change significantly at these three pHs.
3.3. Cytocompatibility and specificity assay
The outstanding application of the Fe3O4/GNCs/Aptamer nanoprobe is selective cell separation from a mixture. For this purpose, the biocompatibility of nanoprobe is very important and must be evaluated. In the next step, we explored these features of the Fe3O4/GNCs/Aptamer nanoprobe using two cell lines before they were used for in vitro separation application. MTS assay was performed to measure the biocompatibility of the nanoprobe. After incubation with Fe3O4/GNCs/Aptamer nanoprobe for 24 h, an MTS viability assay of HL-60 and HepG2 cells was carried out. From figure 3(A) it is observed that the cell viability does not change significantly after treatment with Fe3O4/GNCs/Aptamer. These results suggest that the prepared Fe3O4/GNCs/Aptamer nanoprobe has excellent cytocompatibility at the tested concentrations.

Figure 3. Cytocompatibility assay of HL-60 and HepG2 cancer cells treated with different concentrations of Fe3O4/GNCs/Aptamer (A), and flow cytometry histograms of the mentioned two cells after incubation with the nanoprobe (B).
Download figure:
Standard image High-resolution imageSelectivity of the nanoprobe was investigated by flow cytometry analysis. In this study, HepG2 was selected as a KH1C12 negative cell and the two cell lines were treated with Fe3O4/GNCs/Aptamer nanoprobe and the fluorescence of GNCs was used to evaluate the nanoprobe uptake by both cancer cells. According to the obtained histograms (figure 3(B)), in comparison to the untreated cells (Unt cells), a shift toward higher far-red fluorescent intensities in FL-3 channel can be seen for HL-60 as KH1C12 positive cells, while for HepG2 cells, the fluorescent signals generated by nanoprobe and the untreated cells are similar. The results show that Fe3O4/GNCs/Aptamer could be selectively taken up by the HL-60 cancer cells. The results obtained from MTS and flow cytometry analyses show that the Fe3O4/GNCs/Aptamer nanoprobe is cytocompatible and can recognize the desired cancer cells specifically. ICP-OES was employed to quantitate the amount of nanoparobe taken up by the HL-60 and HepG2 cells. As shown in figure S5 the uptake of the nanoprobe in HL-60 cells is about 10.4 times higher than that in HepG2 cells.
3.4. Fluorescent microscopy imaging and cell separation capability
Fluorescent microscopy imaging was utilized to demonstrate the selective uptake of Fe3O4/GNCs/Aptamer nanoprobe in a mixture containing equal number of HL-60 and HepG2 cells using fluorescent property of GNCs. Bright-field images of the cells (figure 4(A)) show no changes in the morphology illustrating the biocompatibility of the prepared nanoprobes which is in accordance with the MTS data [41]. The dark-field images show that the fluorescence intensity of the Fe3O4/GNCs/Aptamer nanoprobe in the desired cells (HL-60) is significantly higher than that of the control cells (HepG2). Next, for both cancer cell suspensions, the cells were separated by a magnet. Then, both separated and remained cancer cells were characterized using fluorescent imaging. The nanoprobe bound only to HL-60 cells which shows high red emission and not to the HepG2 cells. This experiment also confirms the selectivity of the nanoprobe.

Figure 4. Bright-field and dark-field fluorescent microscopic images of HepG2 and HL-60 after incubation with Fe3O4/GNCs/Aptamer nanoprobe (A), fluorescent intensity of the uptaken nanoprobe incubated with various concentrations of HL-60 cells (B), T2-weighted MRI with their related light intensities at different concentrations (C).
Download figure:
Standard image High-resolution image
To evaluate the sensitivity of our multifunctional nanoprobe with the assistance of fluorescent GNCs, we introduced different concentrations of HL-60 cells to the prepared nanoprobe and monitored their fluorescent intensity and sensitivity by increasing the number of cells. As shown in figure 4(B), the fluorescent intensity enhances along with increasing the number of cells. As the nanoparticles enter to the cells, they may encounter with the biomolecules inside of cells that are able to form corona around them [49, 50]. Corona coating could stabilize nanoparticles and prevents their aggregation that leads to self-quenching of GNCs [51]. Therefore, the fluorescent intensity rises as the number of cells increases. Our result also clearly shows that the sensitivity of the fluorescence assay is about 10 cells.
3.5. MRI ability of the nanoprobe
It is known that most biological environments do not show magnetic background. It provides the opportunity to detect desired targets in biological media using the magnetic nanoparticles. The MRI pictures are shown in figure 4(C). Obviously, the contrast of images declines linearly as nanoprobe concentration increases, demonstrating the potential ability of nanoprobe as a T2-based contrast agent in MRI applications [41].
4. Conclusions
We developed a facile approach to fabricate Fe3O4/GNCs/KH1C12 aptamer nanoprobe with 26 nm in diameter for the targeted diagnosis, dual-imaging and isolation of highly malignant HL-60 cancer cells from a mixture of cells. The synthesized nanoprobe has good water dispersibility, colloidal stability and cytocompatibility in the given concentration range. The presence of GNCs within the magnetic properties of the nanoprobe provides the condition for fluorescent microscopy and T2-based MRI imaging of the mixed and separated cancer cells. Specific property of the nanoprobe was provided by the conjugation of the KH1C12 aptamer to the surface of the nanoprobe which selectively detects the desired HL-60 cancer cells from a mixture. This conjugation was done through thiol-en click reaction between the thiol-modified aptamer and the double bond groups of the PGD. Apart from its biocompatibility and selectivity which are confirmed by MTS and flow cytometry analyses, a serial dilution experiment clearly showed that this nanoprobe can recognize as few as 10 cells in a various range of cancer cells. Also, the fluorescence intensity increases by enhancing the cell numbers which shows the increased amount of the uptaken nanoprobes. Finally, MRI study introduces the ability of the nanoprobe to be employed for in vitro MRI-based imaging of the cancer cells.
Acknowledgments
This research was supported by Iran National Science Foundation, (No. 94802693), Royan Institute for Biotechnology and Isfahan University of Technology.