

Abstract
Novel material properties can be attained when embedding three-dimensional (3D) nanoparticles (NPs) in a variety of polymeric matrices. These inhomogeneities influence the bulk mechanical response due to the local high modulus mismatch between the particles and the matrix. The degree of the mechanical mismatch that is seen near a composite surface depends on the geometry/shape and spatial location and orientation of the particle with respect to the external contact loading. Isolating each particle's contribution to the surrounding elastic field can be numerically discerned but is experimentally complex, as there are limited direct characterization approaches available at the nanoscale. Atomic force microscopy (AFM) instrumentation is one such method that can quantify subsurface particle stiffness effects on nanocomposites with a resolution of a few nanometers. This work studies the spatial and geometrical effects of subsurface silver NPs on the local composite stiffness of a polystyrene matrix using 3D finite element (FE) models to interpret contact resonance (CR) AFM measurements. The present FE-AFM findings suggest both particle shape and particle orientation have a significant role in the degree of uniformity of the stiffness distribution in the embedding matrix. The applied CR-AFM technique shows that the NP geometry can be clearly distinguished when such inhomogeneities are relatively close, 17 nm, to a free surface whereas material-interface measurements at deeper subsurfaces are obscured by experimental noise. This work demonstrates that (i) numerical solutions can assist in qualitatively elucidating nanoinstrumentation stiffness profiles in terms of particle shape and orientation and (ii) CR-AFM measurements can quantify the influence of particle geometry and orientation on the surface nanomechanics of nanocomposite materials.
Export citation and abstract BibTeX RIS
1. Introduction
Nanotechnology has remarkably enhanced material properties of engineered nanostructures with the incorporation of embedded three-dimensional (3D) secondary-phase particles with an average particle size (APS) ≤100 nm. Advanced polymer nanocomposites (PNCs) contain high-specific-surface-area of well-dispersed nanoparticles (NPs), resulting in a considerably increased elastic modulus [1–14], as well as improved strength and fracture toughness [2, 4, 7, 9–12, 14, 15] compared to the bulk homogeneous polymeric material. However, high-end multifunctional applications of PNCs have been hindered due to limitations of direct characterization methods [5] and multiple challenges related to interpreting particle geometrical and spatial material property contributions [16–19]. The mechanical behavior of PNCs has been studied in great detail in the literature. However, more experimentation, theoretical formulations, and nano-to-mesocale numerical work are needed to increase understanding of the NP-matrix interaction. Deciphering the contribution of the geometry, orientation, and location of NPs near the surface of the embedding matrix can contribute to elucidating the strengthened material properties of PNCs. Nowadays, continuum-mechanics numerical techniques are predominantly used to solve the multiscale inhomogeneity problem [20–26] and to complement and qualitatively predict experimental results as well as to strengthen molecular dynamics (MD) simulations [27]. The application of continuum studies in nanoparticulate-reinforced systems has been subject to debate, as there are uncertainties regarding how the elastic field and the polymer dynamic properties are affected in the presence of surface- and interface energies [27, 28] when the APS is on the order of tens of nanometers [1, 25]. Yet, continuum modeling of nanocomposite materials has been increasingly used and has proven to be a practical tool to validate the material mechanical behavior of PNCs [26, 29–31], often with high accuracy when compared with experiments [3, 13] and MD simulations [32, 33]. In addition, continuum mechanics can incorporate interface energy analysis [25, 26] and the effects of the PNC interphase layer as a ternary phase on the effective properties of the composite via homogenization techniques [34]. The latter approach has been extensively investigated using FE models, Halpin–Tsai model, Mori–Tanaka model, and equivalent continuum model; a detailed discussion can be found in [26].
A number of continuum finite element numerical studies have solved the embedded particle mechanical contribution in terms of: (a) particle anisotropy and orientation [35], elastic-plastic isotropy [36–38], and viscoelasticity [31]; (b) composite elastic properties and/or local stress field [13, 30, 35, 37–49]; (c) particle shape [37, 50–53], size [3, 48, 51], and location [41]; (d) particulate distribution [39]; (e) particle-matrix detachment [3, 13, 54, 55] and interphase [40, 42, 43, 45, 47, 48, 56–58]; and (f) contact mechanics/(nano)indentation simulations [41, 59]. Regarding the latter, atomic force microscopy (AFM) techniques for inhomogeneous materials have been validated using FE indentation simulations [46, 60, 61]. AFM uses small probes that locally detect material discontinuities and their influence on the material stiffness with a resolution on the order of a few nanometers. AFM can provide comprehensible characterization of local surface mechanical properties of particulate nanocomposites [55, 62–65]. FE contact mechanics methods can be used to supplement nanoinstrumentation probing techniques and provide deformation mechanisms and driving forces of the surface and subsurface material discontinuity, which can be difficult to obtain from standard contact experiments alone. Clifford et al [52] proposed an empirical approach to extract the composite elastic modulus from AFM-nanoindentation simulations of linear-elastic systems with embedded nanoinhomogeneities using FE models. In a related work, Killgore et al [41] showed how using both contact resonance (CR)-AFM measurements and FE nanoindentation simulations can assist in decoupling particle size effects on contact stiffness mapping in polymeric inhomogeneous materials.
Characterizing the role of NPs with high fidelity is important in a variety of materials, where to tailor nanoparticulate composite multifunctional applications requires understanding of how embedded NPs affect the nanostructure material properties. The NP contribution to the local nanoscale elastic fields and overall mechanical properties of nanocomposites has become of increasing interest in multiple fields of study due to the large surface to volume ratio of the nanostructure of the embedded NPs. At critical length scales, confinement, surface- and subsurface stress distributions, and interfacial surface interactions influence not only the nanomechanics of PNCs but can also influence polymer-chain dynamic properties and polymer glass transition temperatures [27, 28, 66]. In addition, surface interactions can give direct insight into similar interactions in the bulk PNC. Such interactions are also relevant and can be captured via 3D tomography in nanofilms. The study of contact mechanics phenomena can aid in deconvolving the particle contribution in nano-reinforced structures of the material surface and subsurface. The present paper discusses the local effects of the geometry and spatial orientation and location of embedded 78 nm silver nanoparticles (AgNPs) on the local material stiffness of a polystyrene (PS) matrix in a dilute system, referred as PS-AgNP composite material. These are either cuboidal particles (AgNPc) or spherical particles (AgNPs), having equal specific surface area, referred here as inhomogeneities or particles. For decoupling these phenomena, this study uses 3D FE linear-elastic numerical simulations in conjunction with CR-AFM measurements for direct nanomechanical characterization of the PS-AgNP composite using controlled sample designs. The current study interprets the affected contact stiffness based on Hertzian-based contact mechanics and beam mechanics. The present approach is used to promote understanding when experimentally extracting surface mechanical properties of NP-based composite materials.
2. Theoretical background: fundamentals for the numerical and experimental methods
2.1. Contact mechanics
In low-load AFM measurements, the solid material can be purely deformed in an elastic fashion. Thus, the elastic behavior of the tip-sample system can be studied using the classical Hertzian theory. The theory of Hertz is subject to a number of assumptions [67, 68]; however, nowadays this theory is still widely used to capture the elastic contact phenomena in (nano)indentation experimental and numerical works. In this study, the analytical solution of the Hertzian theory is used to validate FE numerical models with comparable contact radii. For a spherical tip, the normal force, P, is [67, 68]

where R* is the composite radius, δ is the indentation displacement, and E* is the indentation modulus, also known as the composite elastic modulus. The composite radius is: ![${R}^{\ast }={\left[(1/{R}_{1}+1/{R}_{2})\right]}^{-1}$](https://content.cld.iop.org/journals/0957-4484/30/28/285703/revision2/nanoab10b1ieqn1.gif) , being equivalent to the radius of the probe's tip for a flat sample surface of the sample; and the E* modulus is defined for isotropic materials as:
, being equivalent to the radius of the probe's tip for a flat sample surface of the sample; and the E* modulus is defined for isotropic materials as:  where the subscripts 1 and 2 correspond to the cantilever and the sample, respectively, and ν is the Poisson's ratio. Contact radius a and δ are in order

Upon spherical indentation, the contact stiffness, k, is typically related to the composite elastic modulus via Hertzian contact mechanics as

When modeling linear-elastic indentation in inhomogeneous materials, E* can be extracted via several different Hertzian relations. For an indentation-based modulus,  , this is

In inhomogeneous materials, the surface and subsurface mechanical behavior can also depend on the proximity of any material inhomogeneity to the contact area. In such non-Hertzian contact mechanics, the unknown contact radius can be studied based on analytical and approximate formulations from classical elasticity theory originally applied to layered materials of any thickness D (i.e.  ) [69, 70] having a high-stiffness mismatch and later applied to continuum mechanics of composites with embedded inhomogeneities [71]. Considering the Hertzian contact radius of the coating material, ac, and that of the substrate or inhomogeneity material, as, are known, the affected contact radius of the inhomogeneous material,
  , is
, is
where
2.2. Beam mechanics
AFM can be used for qualitative and quantitative measurements of the material properties of polymer-reinforced nanocomposites via contact interactions. Contact measurements can generate material stiffness information using a variety of AFM methods such as CR-AFM. In CR-AFM, the AFM probe is in contact with a sample at a constant force. The AFM cantilever is excited by a small-amplitude oscillation to detect the resonance frequencies, or eigenvalues, of the cantilever-sample system. The continuous nature of the cantilever allows the output of contact resonance frequency to be converted into contact stiffness data using theoretical formulations such as point-mass and beam mechanics models. Any shift in the contact frequency can be interpreted as a change in the probed-material mechanical properties. For a perfectly linear-elastic probed material, the continuous Euler–Bernoulli (E–B) beam mechanics can be modified to relate the cantilever beam resonant frequency to the stiffness of the sample, ks, without damping [72, 73]. The contact interaction using CR-AFM behaves similarly to a spring and can be represented as a homogeneous and uniform cantilever of length L rigidly clamped at one end and a spring coupled at the free end of length L1, where L1 < L, and has a stiffness ks equivalent to the probed material stiffness.
In the E–B model, the wave equation is used for pure bending of the beam:

where Ep, I, ρp, and A are the elastic modulus, the moment of inertia, the density, and the cross-sectioned area of the cantilever probe, in that order. For each eigenfunction zn, there is a corresponding wave number κn associated with an eigenfrequency fn. The boundary conditions to solve equation (7) neglect moment and shear forces. In probe-sample contact interaction, the contact resonance frequency  emerges and the normalized contact stiffness of the sample material,
  , can be derived (see [62, 72, 73] for details)1
.
, can be derived (see [62, 72, 73] for details)1
.
3. Experimental approach
3.1. Sample preparation
Cuboidal (AgNPc) and near-spherical (AgNPs) APS = 78 nm silver NPs (nanoComposix, Inc., San Diego, California) were used as received. The AgNPc were suspended 0.1 mass% in ethanol and the AgNPs were suspended 0.5 mass% in ultrapure water. Figures 1(a)–(e) show the sample-process schematic for embedded cuboidal particles; samples with embedded spherical particles were prepared in a similar fashion. AFM topography maps in figures 1(a), (c), and (e) also show the material surface during that sample step. Particles were drop cast onto toluene and ultraviolet-ozone cleaned silicon substrates, dried, then rinsed aggressively to remove loosely bound particles and residual surfactant (figure 1(a)). The AFM topography in figure 1(a) confirms the planar orientation of the deposited cubes relative to the Si substrate. Substrates were then imaged with intermittent contact AFM to confirm regions of well-dispersed, isolated single particles (≈10 NPs per 5 μm × 5 μm scan area). Polystyrene sheet stock (PS, # ST313120, Goodfellow, Coraopolis, PA) was cut into ≈1 mm3 pieces and dissolved in toluene (Sigma Aldrich, St. Louis, MO) to produce a 5 mass% solution. Approximately 1 ml of the solution was drop cast onto the particle-coated substrates, producing a 5 μm thick film with particles located at the bottom surface of the film (figure 1(b)). The films were peeled from the substrates with tweezers (figure 1(c)). The topography in figure 1(c) shows that the cubes are only faintly evident, with few-nm height variation from the surrounding polymer, and levelness from figure 1(a) intact. The films were then flipped 180°, resulting in a polymer substrate with particles whose top-surfaces were located at the surface of the thick film supported by a silicon substrate (figure 1(d)). To bury the particles a controlled depth, additional nanometer-thin PS films were fabricated by spin coating. The above PS solution was diluted to concentration c (mass%) and cast in a two-step process (at velocity v1 for time t1, then v2 for time t2) with the parameters in table 1 to produce thickness D = 17 nm, 40 nm, and 60 nm homogeneous films.

Figure 1. AFM sample preparation step process and AFM topography maps of the  composite material.
Download figure:
Standard image High-resolution imageTable 1. Polymer spin casting details of sample fabrication.
| PS section | D (nm) | c ( ) ) |
v1 (rad s−1) | t1 (s) | v2 (rad s−1) | t2 (s) |
|---|---|---|---|---|---|---|
| 17 | 0.4 | 104.72 | 30 | 523.60 | 30 | |
| Top film | 40 | 1.0 | 314.16 | 30 | 523.60 | 30 |
| 60 | 1.0 | 107.72 | 30 | 523.60 | 30 |
The thin PS films were scored with a razor blade, then shallowly immersed in ultrapure water to float the films onto the water surface. Subsequently, the resultant sandwich structures (figure 1(e)) were annealed at 120 °C to create a homogeneous matrix with well-controlled particle depth. The AFM topography in figure 1(e) shows that the NPs buried at D = 60 nm are no longer visible due to the presence of the cover layer.
3.2. AFM: contact resonance force microscopy
CR-AFM [74, 75] was performed with a Cypher AFM (Oxford Instruments, Santa Barbara, CA). Measurements used a 2.67 N m−1 cantilever (FMR-PPP, Nanosensors, Neuchatel, CH) with a free resonance frequency of 72.48 kHz. (CR)-AFM images were acquired with dual AC resonance tracking [76] while the cantilever was actuated photothermally with a 405 nm laser. Images were obtained with an applied load of 30 nN. Typical CR frequencies for the 1st eigenmode were 254.60–319.77 kHz. Scan size was 1024 × 1024 resolution and 5 nm pixel (1024 pixels × 1024 pixels and each pixel is a square 5 nm on a side). Maps of the CR frequency were converted to contact stiffness with the E–B model in equation (7).
4. Formulation and validation
In this study, the linear-elastic nanoindentation simulations of the PS-AgNP material using a rigid probe are feasible, considering that: (1) the AFM tip's elastic modulus is at least 20 times greater than that of the polymer bulk and (2) the material displacements resulting from the AFM contact interaction are sufficiently small. In the present work, a 3D FE linear-elastic model simulates the contact interaction of a 60 nm radius (R1) rigid sphere indenting a deformable 625 nm × 625 nm × 250 nm PS matrix inhomogeneous material. Figure 2 shows the 3D FE nanoindentation model schematic of the PS matrix in which a spherical AgNPs is embedded at D = 17 nm, which is centered along the probe tip's axis of symmetry. A single 78 nm silver nanoparticle (AgNP) that is eigenstrain free and free-standing is embedded in and is perfectly bonded (chemically and physically) to the surrounding polymeric material. Taking into account the AFM-FE qualitative focus of this study, numerical simulations consider a zero-dimensional material interphase between the matrix and the AgNPs. The reader is referred to FE modeling of graded elastic properties in NP-matrix interphases elsewhere [5]. This work simulates nanoindentation mapping from particle-to-probe at the probe's axis of symmetry and up to 60 nm away from the particle centerline in the plane of contact, xz (see figure 2) with the actual AFM resolution of ≈5 nm between indents. The PS-AgNP composite material is considered to be dilute; thus, AgNPs are sufficiently distant from each other, so that only one particle is directly underneath or close to the contact area, and no other particle is located in the subsurface vicinity of the contact interaction. Hence, there is no particle-particle interaction affecting the mechanical contact response of the FE model. To match the present experimental studies, the subsurface inhomogeneity is located at a given D of 17, 40, and 60 nm measured from the free PS surface to the top surface of the particle.
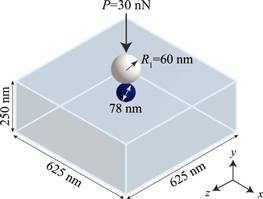
Figure 2. 3D FE nanoindentation under a 60 nm probe tip's radius (R1) of the D = 17 nm embedded 78 nm  model. Particle is at the probe's axis of symmetry.
Download figure:
Standard image High-resolution image4.1. FE formulation
Table 2 gives the mechanical properties used in the FE nanoindentation model. The FE approach is accomplished using ANSYS Mechanical software (Canonsburg, Pennsylvania). The structural model uses a frictionless surface-to-surface contact pair that allows a rigid-to-flexible contact interaction [77]. In an approach similar to that of the AFM experiments, a perfectly flat contact surface is assumed, thus, R* = 60 nm [59]. The bottom of the PS body in figures 1(c) and (d) is fully constrained and a quasistatic contact interaction occurs between the rigid body and the elastic body upon a normal load of P = 30 nN.
Table 2. Material properties of the FE probe-nanocomposite system.
| Body | E (GPa) | ν |
|---|---|---|
| Rigid sphere |

|
0.3 |
| PS matrix | 4 | 0.3 |
| AgNP | 83 | 0.3 |
In all cases studied, surface contact elements are 100% 1.25 nm hexahedral elements with aspect ratio of unity. Fine subsurface elements in the contact vicinity are also hexahedral and biased from the surface (bias factor of two with increasing vertical aspect ratio along y and an invariant aspect ratio along plane xz). Figures 3(a)–(d) show 3D cut mesh mid-sections of the FE models with D = 17 nm embedded NPs depicting the two different morphologies and various orientations with respect to the normal contact in the xz plane. In order to deconvolve this contact problem and relate the numerical solution to AFM measurements, this work studies the affected contact stiffness, kFE, of the polymer with a subsurface AgNP at a given depth D based on the contribution of: (1) particle geometry: nanosphere, AgNPs (figure 3(a)) versus flat-surface nanocube,  (figure 3(b)) of equal specific surface area; (2) cuboidal particle orientation: nanocube's flat surface is parallel to the plane of contact (xz), face-high
  (figure 3(b)); a nanocube is rotated 45° with respect to the z axis, edge-high
  (figure 3(c)); and a nanocube is rotated 45° with respect to the y- and z axes, vertex-high
  (figure 3(d)); (3) lateral distance to the probe's axis of symmetry with respect to the particle centerline, to simulate the AFM probe translational movement {x, z}; and (4) particle subsurface depth D along the y axis.
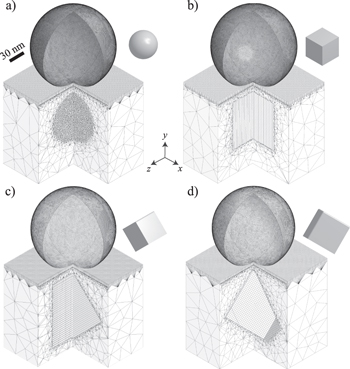
Figure 3. Details of cut-section FE mesh models of D = 17 nm embedded AgNPs. (a) Spherical particle  (b) flat-surface cuboidal particle
  (face-high); (c) cuboidal particle with single rotation
  (edge-high); and (d) cuboidal particle with double rotation
  (vertex high). Small single particles shown are for illustration purposes and are not to scale.
Download figure:
Standard image High-resolution image4.2. Model validation approach
This section validates the numerical models for the spherical nanoindentation on the PS-AgNP dilute composite based on two contact mechanics problems: (a) the Hertzian classical theory [67, 68] for the homogeneous PS matrix, which yields an exact solution that can be used to optimize the model surface and subsurface mesh and computational time; and (b) the affected contact-radius empirical approach formulated in [69–71] for the inhomogeneous PS-AgNP material. All models are based on the schematic of the bulk material dimensions depicted in figure 1 and are adjusted as necessary for the studied methods.
4.2.1. Homogeneous model
For the uniform PS matrix, this approach uses the particle-matrix mesh for the subsurface  that is closer to the contact surface (D = 17 nm) and centered along the axis of symmetry of the spherical indenter's tip (see figure 3(b)) to approximate the maximum error possible in the FE models. Numerical results are denoted with the 'n' subscript and superscript 'PS' for the homogeneous PS matrix model and are compared to the Hertzian-based analytical solution using equations (2)–(4). Table 3 provides the validation results in terms of: aPS,
  , and
, and  with their respective relative errors,
  ,
,  , and
, and  . These results demonstrate that the numerical solution for the homogenous-material problem has high accuracy with respect to the analytical solution; showing an adequate stiffness error%
  .
.
Table 3. Hertzian-based numerical results for homogeneous PS matrix.
| P (nN) |
 (nm) (nm) |
 (GPa) (GPa) |
 (N m−1) (N m−1) |
 (%) (%) |
 (%) (%) |
 (%) (%) |
|---|---|---|---|---|---|---|
| 30 | 6.82 | 4.44 | 59.71 | −1.21 | −0.90 | −0.67 |
4.2.2. Inhomogeneous model
Following the affected contact-radius approach in equations (5) and (6), this model has a PS nano-film of thickness D that is perfectly bonded to an Ag bulk substrate. This validation technique considers that the mechanical mismatch behavior of the material interface between the top polymeric matrix and the embedded nanocube's surface oriented parallel to the free surface resembles that of a PS film to an Ag substrate, where the particle centerline is aligned to the probe's axis of symmetry (figure 3(b)). The numerical contact radius for this coated material is denoted as  . Second, for the current study, the
  model (see figure 3(b)) can be thought of as a local film-substrate material, considering
  APS and denoting the resulting numerical contact radius as
  . Using equation (2), the Hertzian contact radius for the PS and silver Ag are aPS = 6.75 nm and aAg = 2.23 nm.
Table 4 shows that contact-radius numerical solutions for the inhomogeneous material model are accurate with respect to the theoretical approach for both the film-coated material and the embedded particle models at the P and D parameter values studied. The mechanical response is consistent between the PS-Ag coated material and the PS- composite material; indicating that the local response at the centerline of the embedded cuboidal particle with the flat-surface orientation is equal to that of a film-based material. Numerical approximations are more accurate in cases wherein the material interface is further away from the free surface, i.e. D ≥ 40 nm. Errors in contact-radius for the inhomogeneous materials,
  , are within the range:
  .
.
Table 4.
Numerical results for PS- composite material.
| P (nN) | D (nm) |
 (nm) (nm) |
 (nm) (nm) |
 (nm) (nm) |
 (%) (%) |
 (%) (%) |
|---|---|---|---|---|---|---|
| 17 | 6.67 | 6.88 | 6.88 | −3.15 | −3.15 | |
| 30 | 40 | 6.74 | 6.87 | 6.87 | −1.85 | −1.85 |
| 60 | 6.74 | 6.87 | 6.87 | −1.85 | −1.85 |
5. Results and discussion
In this work, numerical solutions are expressed in terms of the affected contact stiffness, kFE, of the PS-AgNP dilute composite. The analysis is based on the corresponding contribution of: (a) particle location in terms of the horizontal length (l) between the particle centerline and the probe's axis of symmetry; (b) particle geometry at D = 17 nm, D = 40 nm, and D = 60 nm; and (c) particle orientation at D = 17 nm. In a similar fashion, the AFM stiffness measurements, kAFM, of the PS-AgNP assembly corresponds to P ≈ 30 nN and the spherical- and cuboidal particles embedded at D ≈ 17 nm, D ≈ 40 nm, and D ≈ 60 nm from the free surface. Cuboidal particles should be predominantly arranged with a face upwards parallel to the free surface because of the sample preparation method. This investigation concentrates on the FE-AFM stiffness results related to subsurface particles that are closer to the PS free surface (D = 17 nm), which are anticipated to have more influence on the surface nanomechanical response.
5.1. Computational findings
Figures 4(a)–(b) show the kFE profiles for the six models studied at D = 17 nm and the four models at D = 40 nm and D = 60 nm. These stiffness profiles correspond to indents along the x axis from the center of the particle at l = 0 nm to ±60 nm away from it, where z = 0 nm. In the case of the 17 nm nanocube particles with asymmetrical orientation with respect to the plane of contact xz: edge-high  and vertex-high
  models, a second profile along the z axis is included (figure 4(a)), where x = 0. Figures 4(c)–(f) complement figure 4(a) to illustrate 3D maps of the local stiffness of the PS-AgNP composite with subsurface
  ,
,  ,
,  , and
, and  particles, in that order (D = 17 nm). These stiffness maps have a consistent
  with respect to its analytical value (see table 3) and depict how the geometry and orientation of the NPs can significantly contribute to the inhomogeneity of kFE distribution across the free surface by capturing the symmetry of the subsurface particles in relation to the plane of contact xz. Results in figure 4(a) show a considerable geometry effect of subsurface
  and
and  particles on
  , depicting a plateau-like stiffness shape in the embedding surface above them. This kFE shape is induced by the flat top surface of
  (figure 4(d))and the nanocube edge of
  (figure 4(e)); resembling the local response of geometrically uniform layered materials. At 17 nm, a peak-like
  shape occurs when embedding AgNPs (figure 4(c)), edge-high
  (figure 4(e)), and vertex-high particle
  and
and  (figure 4(f)), resembling the geometry of the embedded sphere while exposing the orientation of the cuboidal
  ,
,  , and
, and  . The stiffness contact is similar along the x and z axes for the vertex-high particle
  since this orientation has at least trigonal symmetry with respect to the indenter. The different stiffness profiles in figure 4(a) are the result of stress-strain response of the composite system that encompasses not only the matrix but also the stresses that are transferred to the AgNPs and in the case of asymmetrical orientation with respect to the contact interaction plane, induced stress gradients. Figures 5(a)–(f) show the contour plots along the axis of symmetry of subsurface normal stress, σy, for 17 nm embedded AgNP models at l = 0 nm. Subsurface stresses are uniformly distributed in both the PS matrix and the embedded
  (figure 5(a)) and face-high
  (figure 5(b)). However, the non-symmetrical orientation of edge-high
  (figures 5(c)–(d)) and vertex-high
  (figures 5(e)–(f)) contribute to the non-uniform σy field distribution. The mechanical behavior inside the non-axisymmetric inhomogeneity is also intrinsically non-uniform in figures 5(c)–(f). In all cases, except when the nanocube face is parallel to the surface (face-high
  ), these subsurface stress images also show the edge of the particle, because these edges are not perpendicular to the normal stress. In the case of face-high
  , since the normal stress is continuous at an interface, this matrix-particle edge is not seen in figure 5(b).
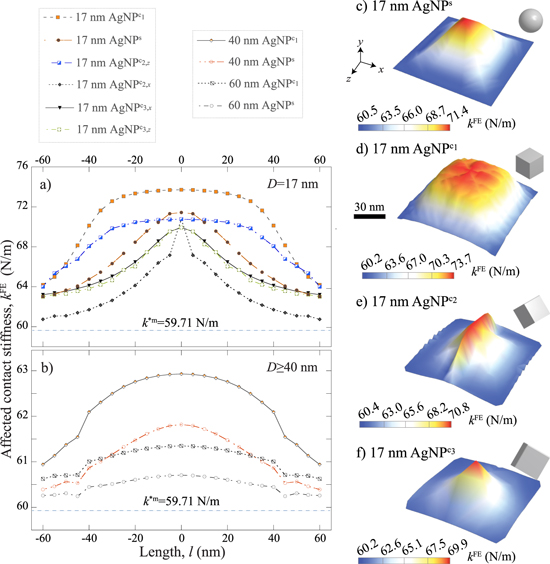
Figure 4. Calculated numerical profiles of affected contact stiffness corresponding to the PS-AgNP dilute composite with subsurface spherical and cuboidal particles embedded at: (a) D = 17 nm and (b) D ≥ 40 nm. 3D numerical affected contact stiffness of D = 17 nm embedded AgNPs: (c) spherical particle AgNP (d) face-high cuboidal particle
  (e) edge-high cuboidal particle
  and (f) vertex-high cuboidal particle
  . Alongside single particles are for illustration purposes and are not to scale.
Download figure:
Standard image High-resolution image
Figure 5. Subsurface normal stress distribution of PS-AgNP dilute composites at l = 0 nm and D = 17 nm: (a) Spherical particle AgNP ; (b) face-high cuboidal particle
  (c) edge-high cuboidal particle
  (d) edge-high cuboidal particle
  (e) vertex-high cuboidal particle
  and (f) vertex-high cuboidal particle
  .
.
Download figure:
Standard image High-resolution imageIn the peak-like  -group, the
  impart a higher stiffness to the surrounding matrix when −40 ≤ l ≤ 40. The stiffness profile shows a dramatic change in terms of shape and magnitude when
  nm when embedding vertex-high
  . This nanocube orientation results in a very high inhomogeneous stiffness distribution along the principal axes {x, z}. Relating to the degree of stiffness contribution at D = 17 nm, kFE at l = 0 increases 23.46%, 18.53%, 17.13%, and 19.63% with respect to
  for embedded
  ,
,  ,
,  , and
, and  (see figure 3); respectively. Embedded face-high
  noticeably yields the higher stiffness at all depths studied, as shown in figures 4(a)–(b), since more of the NP material; is close to the surface versus the other orientations. To relate to different nanoreinforcement systems, three additional FE models were run at l = 0 nm using the 17 nm embedded nanocube model orientation that yields the less stiffness contrast. This is the case of the
  model for the actual PS:AgNP modulus ratio of 1:20 (figure 4(a)). Decreasing the modulus ratio between the PS matrix and a vertex-high embedded nanocube,
  , so that the PS:
 modulus ratio is: (a) 1:2; (b) 1:5; and (c) 1:10 results in a stiffness increase compared to the homogeneous matrix of 3.77%, 4.96%, and 10.70%, respectively (1:20 ratio results in 17.13% stiffness increase). Relative to AFM measurement uncertainties, the 1:10 particle would still be seen, but the 1:5 and 1:2 stiffness particles would probably not be seen by the AFM.
Figure 4(b) depicts an abrupt decrease in  when particles are embedded at deeper subsurfaces (D ≥ 40 nm), particularly in cases where
  nm. Figure 4(b) shows that at D = 40 nm, the effect of particle geometry of the nanocube with respect to that of the nanosphere can be distinguished as the trace of the cube is noticeably flatter than that of the sphere, whereas at D = 60 nm the particle geometry effect is negligible since the shapes of the two curves are very similar. At l = 0 nm, the increment in kFE in relation to
  is: 5.39% and 2.75% when embedding
  ,
,  at D = 40 nm and 3.53%, and 1.67% when embedding
  ,
,  at D = 60 nm. These
  increments in the polymeric surface can be considered small. In this regard, the ISO 14577-1 standards for instrumented (nano) indentation tests on metallic materials [78], which is generally used for most materials, indicate that the material interface in coated substrates can significantly affect the (nano) indentation measurements when such interface is within
  of the indented film. Based on the Hertzian contact-radius in equation (2) for the current contact problem, this relation yields D = 40.5 nm for the PS homogeneous material, which agrees well with data in figure 4(b). This indicates that the contact stiffness at the surface cannot distinguish particle shape and/or orientation below D ≥ 40 nm. The present numerical solutions demonstrate that both the geometry and orientation of subsurface particles can influence the surface nanomechanics in the degree of heterogeneity of the local composite stiffness of the embedding matrix whereas the proximity of AgNPs to the free surface quantitatively delimits kFE. The mechanical response of this contact interaction depends on the subsurface material interfaces and how different 3D phase morphologies and orientations to acting loads result in a different heterogeneous mechanical behavior.
5.2. Experimental results
Figures 6(a)–(h) show the CR-AFM imaging results of the six PS-AgNP composite samples studied. Figures 6(a)–(c) correspond to the 17 nm embedded  sample and illustrate the data extraction process carried out in the study for the AFM measurement interpretation. The AFM contact resonance frequency
  results in figure 6(a) are converted into absolute stiffness
  data using equation (7), as shown in figure 6(b). The AFM imaging results in figures 6(a)–(b) reveal a high variation of the sample background frequency and stiffness, respectively. These findings suggest that a change in the nanomechanics between the cantilever tip and the sample surface occurred during scanning. The significance of this varying background stiffness is directly attributed to the in situ change of the probe's geometry and surface contamination, which have critical roles in the instrument resolution. To provide accurate AFM interpretation, a uniformly distributed PS background stiffness exhibiting sharp particle exposure is needed. This can be attained using a flattening method that consists of an offset value that sets to zero the medium absolute stiffness value per scanned line across the map area (figure 6(c)). This results in relative stiffness
  data, as shown in figure 6(c). Figures 6(c)–(h) show the relative-stiffness imaging of the PS samples with embedded nanocubes and the embedded nanosphere samples, respectively, at D ≈ 17 nm, D ≈ 40 nm, and D ≈ 60 nm, in that order. Subsurface NPs are clearly detected through the AFM scans in cases wherein D ≈ 17 nm (figures 6(c) and (f)) with relatively low noise measurement effect. This noise, ϕ, can be interpreted in terms of
  , where
  corresponds to the PS/background stiffness and
  is the maximum stiffness measured in the embedding surface. Such noise was on the order of 0.22 and 0.25 for the 17 nm embedded
  - and
- and  samples, respectively. NPs are detected to some extent when embedded at D ≥ 40 nm underneath the contact interaction (figures 6(d), (e), (g), and (h)). In these cases, measuring any stiffness changes due to subsurface interfaces were affected by a higher level of AFM noise in the range of 0.38 ≤ ϕ ≤ 0.60. In addition, the nanostructure mechanics depend on the proximity of the NPs to the free surface. Contrary to FE numerical solution, there is not a distinct difference in stiffness shape pattern between nanocube- and nanosphere samples at D ≈ 40 nm due to the noise-affected AFM measurements.
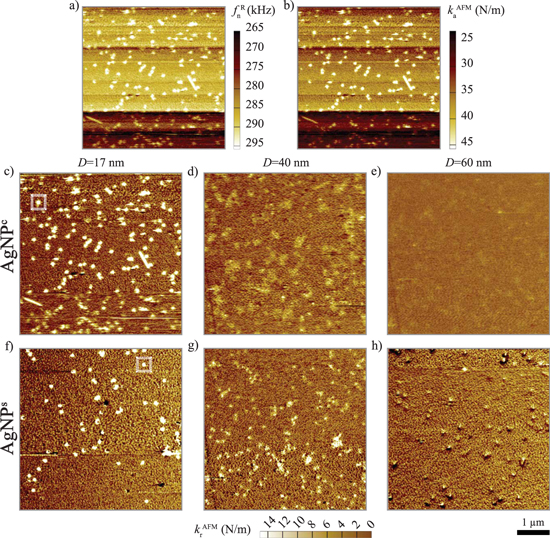
Figure 6. AFM imaging of PS-AgNP composite samples corresponding to P ≈ 30 nN: (a)  of 17 nm
  (b)
(b)  of 17 nm
  (c)
(c)  of 17 nm
  (d)
(d)  of 40 nm
  (e)
(e)  of 60 nm
  (f)
(f)  of 17 nm
  (g)
(g)  of 40 nm
  and (h)
  of 60 nm
  . Dashed boxes enclose individual particles selected for further study, see figure 8.
Download figure:
Standard image High-resolution imageTo quantitatively relate to numerical and experimental results, the material stiffness is normalized by the maximum stiffness value per case studied, so that:  and
and  for FE- and AFM stiffness results, respectively. Figures 7(a)–(b) report the normalized stiffness,
  , AFM profiles of three (I–III) individual 17 nm embedded
  and
and  sample particles, respectively (refer to figures 6(c) and (f)). The FE solution of the 17 nm embedded
  and
and  models are also shown in figures 7(a) and (b), respectively. Figures 7(a) and (b) show that the FE solutions predict a higher stiffness along l with respect to AFM profiles. This can be the result of the mutual effect of: (i) FE ideal particle geometry, size, and orientation, (ii) no noise effect in numerical simulations, (iii) in situ changes to probe tip radius as well as an absolute difference between the modeled 60 nm probe radius and the actual tip radius, (iv) uncertainties in the matrix, and/or (v) stiffer PS matrix used in FE models compared to the actual PS used in the samples. Regarding the latter, the PS elastic modulus can range between ≈2 and 4 GPa, yielding a Hertzian stiffness range of 37 N m−1
  m−1 for the current contact problem studied; FE studies are based on a 4 GPa matrix modulus. Figure 7(a) shows a fairly consistent peak shape response for
  samples II and III. T he I-
 sample's kAFM profile indicates this response can correspond to a non-spherical particle, since such a profile resembles that of the numerical edge-high
  model in figure 4(a). Figure 7(b) depicts a plateau-like stiffness shape for the three experimental I–III-
 profiles. These profiles are qualitatively close to the numerical FE-
 result in figure 7(b), particularly in the case of I-
 . This study's combined numerical- and experimental results show that despite the stiffness measurement limitations related to noise and probe tip changes, the CR-AFM technique can comprehensibly characterize and distinguish particle geometry using material stiffness variations when embedding AgNPs at D ≈ 17 nm from the matrix free surface. The CR-AFM results indicate that the PS-AgNP material interphase, which is of great relevance in understanding the nanodynamics of nanoparticulate composites [27, 28], did not limit the probe measurement capability to differentiate the effect of particle geometry on the local stiffness.
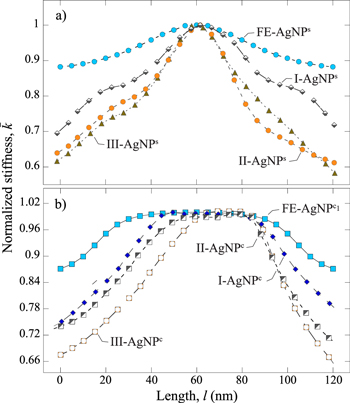
Figure 7. Normalized stiffness of individual AFM particle profiles and FE profile predictions: (a) 17 nm embedded  and (b) 17 nm embedded
  .
.
Download figure:
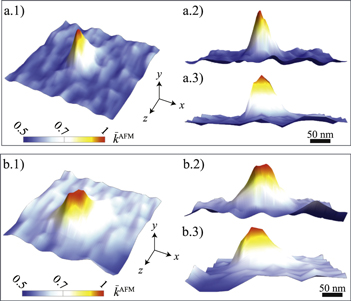
Standard image High-resolution imageFigures 8(a.1)–(a.3) and (b.1)–(b.3) illustrate 3D  maps for D = 17 nm embedded particles corresponding to the dashed boxes in figures 6(c) and (f). The local stiffness maps for individual 'nearly' spherical
  particles in figures 8(a.1)–(a.3) reveal a comparatively more pronounced peak similar to that anticipated in the 3D numerical
  (figure 4(c)) and
  maps (figure 4(f)). This indicates that the geometry of this particular
  could have protuberant surfaces at the nanoscale. Figures 8(b.1)–(b.3) illustrate a relative plateau-like stiffness shape induced by the subsurface nanocube. Based on 3D FE predictions in figures 4(d)–(f) and considering that the 3D profile maps in figures 8(b.2)–(b.3) are relatively symmetrical, this CR-AFM 3D map captures particle orientation, suggesting that the flat surface of the particle is slightly rotated with respect to the plane of contact (xz) but not as much as in the edge-high and vertex-high cases.
Figure 8. AFM 3D normalized stiffness profiles using  nN of 17 nm embedded AgNPs in a PS matrix. (a.1) 3D
  map of individual spherical particle; (a.2) 3D
  yz profile of individual spherical particle; (a.2) 3D
  xy profile of individual spherical particle; (b.1) 3D
  map of individual cuboidal particle; (b.2) 3D
  yz profile of individual cuboidal particle; and (b.3) 3D
  xy profile of individual cuboidal particle.
Download figure:
Standard image High-resolution image
6. Summary and conclusions
This work focused on discerning the free-surface stiffness response of embedded silver nanoparticles (AgNPs) in a polystyrene matrix using 3D FE linear-elastic numerical simulations to help understand contact resonance AFM (CR-AFM) characterizations. Findings showed that FE contact mechanics solutions aided the interpretation of CR-AFM measurements to elucidate the polymeric surface nanomechanics induced by the spatial and geometrical effects of subsurface AgNPs. The FE-AFM surface stiffness results qualitatively agreed, demonstrating that the particle shape and particle orientation had a significant effect on the local surface inhomogeneous stiffness distribution when AgNPs were embedded relatively close to the free surface. The applied CR-AFM technique comprehensively showed that the effects of the NP geometry on surface stiffness between cubes versus spheres can be clearly distinguished when such inhomogeneities are at 17 nm underneath the free surface whereas material-interface measurements at deeper subsurfaces were not resolved due to experimental noise. Although CR-AFM results showed particle orientation effects on the contact stiffness distribution, more experimentation is needed to discern the spatial orientation contribution of subsurface inhomogeneities, as well as the influence of noise based on AFM measurements alone.
Acknowledgments
The authors acknowledge the funding of the NIST Fellow Post-Doctoral program for one of us (VM). This research was carried out under the NIST project for Scanning Probe Microscopy for Advanced Materials and Processes.
Footnotes
- *
Contribution of NIST; not subject to U.S. copyright.
- 1
Certain commercial equipment and/or materials are identified in this report in order to adequately specify the numerical procedure. In no case does such identification imply recommendation or endorsement by the National Institute of Standards and Technology, nor does it imply that the equipment and/or materials used are necessarily the best available for the purpose.