

Abstract
Interatomic potentials are widely used in computational materials science, in particular for simulations that are too computationally expensive for density functional theory (DFT). Most interatomic potentials have a limited application range and often there is very limited information available regarding their performance for specific simulations. We carried out high-throughput calculations for molybdenum and silicon with DFT and a number of interatomic potentials. We compare the DFT reference calculations and experimental data to the predictions of the interatomic potentials. We focus on a large number of basic materials properties, including the cohesive energy, atomic volume, elastic coefficients, vibrational properties, thermodynamic properties, surface energies and vacancy formation energies, which enables a detailed discussion of the performance of the different potentials. We further analyze correlations between properties as obtained from DFT calculations and how interatomic potentials reproduce these correlations, and suggest a general measure for quantifying the accuracy and transferability of an interatomic potential. From our analysis we do not establish a clearcut ranking of the potentials as each potential has its strengths and weaknesses. It is therefore essential to assess the properties of a potential carefully before application of the potential in a specific simulation. The data presented here will be useful for selecting a potential for simulations of Mo or Si.
Export citation and abstract BibTeX RIS
1. Introduction
Many materials properties are directly accessible with high precision by quantum-mechanical calculations using density-functional theory (DFT). Calculations of structural stability, elastic constants, point defects, phonon spectra, and bandgaps are routinely performed and represent the core of contemporary high-throughput DFT frameworks [1–6].
The computational expense of DFT makes predictions difficult that require many atoms in the calculations, for example, dislocations or complex grain boundaries, or many different atomic configurations, for example, for predicting atomic trajectories or for sampling kinetic and thermodynamic properties. These calculations are often carried out with interatomic potentials, i.e. simplified models of the interatomic interaction that are orders of magnitude faster than DFT. Different from DFT, which provides robust predictions for many materials with quasi-standard choices for the formulation of the exchange correlation functional [7–9], interatomic potentials are much less universal. Interatomic potentials are mathematical formulations of atomic energies that are typically developed by individual researchers, based on their insight into chemical bond formation, a desired level of mathematical complexity, with the aim of reproducing specific reference data and often with a particular application in mind. In recent years databases of interatomic potentials with standard interfaces were set up [10, 11] that enable researchers to access a large number of different interatomic potentials and that provide predictions of the interatomic potentials for materials properties like elasticity, lattice vibrations, vacancy formation energies, surface energies [10, 12, 13], typically for high-symmetry lattice types (bcc, fcc, hcp, diamond and sc) including data from DFT databases [14]. New potentials are often compared to previously available potentials (see, for example, [15–18]). However, an explicit and exhaustive comparison of different potentials and DFT over a wide range of materials properties and structures is not available.
Here we present a detailed comparison of interatomic potentials for Mo and Si. Both elements form directional bonds that stabilize their ground state crystal structure, bcc for d-valent Mo and diamond for sp-valent Si [19] and that present a challenge for interatomic potentials. We compare a large variety of properties and provide DFT reference calculations, which enables a detailed discussion of the performance of the different potentials. We furthermore suggest a general measure that may be helpful to quantify the transferability of a given interatomic potential.
In section 2 we outline the details of our calculations and our methodology for validation of interatomic potentials. The properties of the potentials for Mo and Si are discussed in detail in sections 3 and 4. In section 5 we consider a more general sampling of atomic environments. In section 6 we analyze general property correlations and introduce a general measure for assessing the transferability of a potential, before we conclude in section 7.
2. Methodology
We compare the predictions of the interatomic potentials to DFT reference calculations and, where available, to experiment. While DFT does not in general provide a perfect match to experiment, the predictions from DFT are typically close to experiment. In addition, DFT data is widely used for potentials fitting. DFT furthermore enables us to carry out one-to-one identical calculations for interatomic potentials and DFT, which allows for a much more detailed assessment of interatomic potentials than would be possible from experiment alone. In the following we briefly summarize the different interatomic potentials, the setup for the DFT reference calculations as well as the computational management framework pyiron [20] that we used for the present work. We further discuss the properties and measures for validation that we employed.
2.1. Interatomic potentials
In our assessment we included all classical potentials for Mo and Si that were available in the OpenKIM [10, 21] and NIST [11] repositories as summarized in table 1 and were compatible with LAMMPS [22]. In particular, we considered one parameterization of a Morse pair (MOR) potential by Girifalco et al [23], embedded-atom method (EAM) potentials [24–28], modified embedded-atom method (MEAM) potential [29] and angular-dependent potential (ADP) [17] for Mo. The list of potentials for Si includes Stillinger–Weber (SW) potentials [15, 30–33], a modified SW potential [34], Tersoff (TER) potentials [35–40], modified Tersoff (mTER) potentials [16, 41], MEAM potentials [42–44] and an environment-dependent interaction potential [45, 46]. In addition we included two Mo parameterizations of bond-order potentials [47, 48] for d-valent transition metals.
Table 1. Interatomic potentials for Mo and Si that we considered: Morse pair potentials (MOR), embedded atom method (EAM) potentials, modified embedded-atom method (MEAM), bond order potential (BOP), Stillinger–Weber (SW), Tersoff (TER), environment-dependent interatomic potential (EDIP). Reference data that were used for potential fitting: a—lattice constant, Evap—energy of vaporization, K—compressibility, Ec—cohesive energy, Cij—elastic matrix, B—bulk moduli, Ev—vacancy formation energy, Esub—sublimation energy, Eint—interstitial formation energy, SIA—self-interstitial atoms, E(V)—energy–volume curve, Tm—melting temperature.
| Class | Potential | Reference data |
|---|---|---|
| Mo | ||
| MOR | Girifalco Mo HighCut [23] | a, Evap, K (exp) |
| EAM | Finnis–Sinclair (84, 87) [24, 25] | a, Ec, Cij (exp.) |
| EAM | Zhou (04) [26, 49] | a, Cij, B, Ev, Esub (exp.) |
| EAM | Derlet (07) [27] | a, Ec, Cij, Ev, Eint (DFT-GGA) |
| EAM | Smirnova (13) [28] | SIA,  a (DFT-GGA)
 |
| MEAM | Park (12) [29] | E(V), Cij, Ev,  b (DFT-GGA)
 |
| BOP | Cak (14) [47] | a, Ec, Cij (exp.) |
| BOP | Lin (14) [48] | a, Ec, Cij (exp./DFT) |
| ADP | Starikov (18) [18] |
 for U-Mo (DFT-GGA) for U-Mo (DFT-GGA) |
| Si | ||
| ADP | Starikov (18) [17] |
 , Si-Au (DFT) , Si-Au (DFT) |
| SW | Stillinger (85) [30] | diam., Tm, liq. (exp.) |
| SW | Balamane (92) [15, 31] | improved EC (exp.) |
| SW | Hauch (99) [32] | crack propagation (exp.) |
| SW | Zhang-1 (14) [33] | silicene, phon. (DFT-LDA) |
| SW | Zhang-2 (14) [33] | silicene, acoustic phon. (DFT-LDA) |
| mSW | Mistriotis (89) [34] | clusters, diam., Tm (exp.) |
| TER | Tersoff 37(88) [35] | polytypes (exp./DFT-LDA) |
| TER | Tersoff 38(88) [36] | polytypes, Cij, phon. (exp./DFT-LDA) |
| TER | Tersoff CSi (89) [37] | polytypes, Cij, phon. (exp./DFT-LDA) |
| TER | Tersoff GeSi (89) [37] | polytypes, Cij, phon. (exp./DFT-LDA) |
| TER | Erhart CSi (05) [39] | dimer, Ec of phases, Cij (exp./DFT) |
| TER | Erhart SiIICS (05) [39] | dimer, Ec of phases, Cij (exp./DFT) |
| TER | Devanathan (98) [38] | a, Cij, Ec of β-SiC (DFT) |
| TER | Munetoh (07) [40] | structures, binding energies of Si-O (exp./LDA) |
| mTER | Kumagai (07) [41] | a,Cij,Ec, polytypes, Tm (exp./DFT-LDA) |
| mTER | Purja (17) [16] | Ec, Cij, polytypes, |
| thermal prop. (exp./DFT-GGA) | ||
| EDIP | Bazant (98) [45] | a, Ec of diam.cub., |
| diffusion paths, defects (DFT-LDA) | ||
| EDIP | Jiang (12) [46, 50] | Ec, Cij, defects (exp./DFT) |
| MEAM | Lenosky (00) [42] | Cij, phon., two- to five-atom clust., liq., amorphous, def., (exp./DFT-LDA) |
| MEAM | Du, Lenosky (11) [44] | a, Ec, interstitials (DFT-GGA) |
| MEAM | Jelinek (12) [43] | a, Esub, B, Cij, EC of phases (DFT-GGA) |
Notes. Origin of the reference data (experimental or DFT-calculated) is shown in parentheses.
aForce-matching method [51] with forces from MD trajectory snapshots for solid and liquid phases. bGGA-PBE [9] calculated energies, elastic constants, Ev, ESIA and forces for MD trajectory snapshots for bcc and liquid phases.2.2. Ab initio reference data
The analysis of transferability of different interatomic potentials is based on reference data from spin-polarized DFT calculations that we performed using VASP [52, 53]. We used pseudopotentials based on the projector augmented-wave method [54] with 14 valence electrons for molybdenum (Mo_sv) and four valence electrons for Si. For our validation we employed both, the local density (LDA) [7, 8] and the generalized gradient approximation (GGA) in the parameterization of Perdew, Burke and Ernzerhof (PBE) [9] for the exchange correlation energy. The calculations were carried out with a plane-wave cutoff energy of 500 eV and Γ-centered  -point meshes with linear density not less than 0.1 Å−1. We performed several relaxation steps until the relative change of the lattice constants was less than
  .
.
2.3. Computational management framework
For handling the large number of combinations of interatomic potentials, properties and crystal structures that we studied here as well as the protocols for the calculation of specific properties we used the pyiron computational management framework [20]. In particular, we implemented the computational protocols for the elastic matrix, phonons, vacancy formation energy, transformation paths, surface energy, thermodynamic properties in quasiharmonic approximation and thermal expansion from molecular dynamics simulations (see section 2.4.2). The pyiron framework provides interfaces to VASP for the DFT calculations and to LAMMPS [22], ASE [55] and BOPfox [56] for calculations with interatomic potentials and allows to employ the same simulation protocols for both, DFT calculations and calculations with interatomic potentials.
2.4. Properties for validation
A model of the interatomic interaction provides energy, forces and possibly stresses for a given atomic configuration, in the following we will refer to this as level I data or level I properties. From level I data materials properties are then extracted. We separate basic materials properties that are computationally inexpensive and directly accessible by DFT (level II) and materials properties that are difficult or impossible to compute with DFT and therefore can only be compared to experiment or predictions of other interatomic potentials (level III). Here we focus on the comparison of basic materials properties for which DFT calculations are possible (level II), but also show how to use level I data to compare interatomic potentials.
2.4.1. Validation level I: raw, unstructured reference data
Level I validation is built on raw, unstructured reference data, typically energies, forces and stresses of small calculations. Ideally the level I reference data should be exhaustive and cover the space of local atomic configurations as far as possible in order to ensure that the assessment comprises the possible atomic configurations encountered during the course of a simulation.
Our calculations for the level I validation are based on simple crystal structures using DFT and interatomic potentials. Besides all prototypes of group A of the Strukturbericht designation [57] (see table A1), we included a set of random structures with one (310 structures) or two atoms (520 structures) in the unit cell in order to increase the coverage of atomic environments. This set of random structures corresponds to a complete and homogeneous coverage of local atomic environments that can be represented by unit cells with one or two inequivalent lattice sites [58]. Systems with more inequivalent lattice sites, disordered or liquid/glassy structure are only partly covered. For each structure we determined energy, forces and stresses for volumes of approximately ±10% around the equilibrium volume (with constant  -point density for the different structures in the DFT calculations), where the equilibrium volumes were determined by relaxations starting from the atomic volume of the ground state as initial guess. The Strukturbericht group A prototypes were fully relaxed while only the volume was optimized for the random structures. The structures obtained in DFT calculations were used as starting points for structure relaxation with interatomic potentials. The relaxed structures were then used for the calculation of level II basic materials properties using interatomic potentials.
The transferability of a model of the interatomic interaction can be estimated by comparing the density of states of the formation energies to reference data (section 5).
2.4.2. Validation level II: basic materials properties
At level II structured reference data is required that allows one to extract basic materials properties. Here we focus on data that can be generated routinely with DFT.
For ground state structures, prototypes of the Strukturbericht A and random structures, we determined equilibrium energy E0, volume V0, bulk modulus B and pressure derivative B' by a least-square fit of the E–V curves to fifth-order polynomials. This functional form was chosen in order to be able to fit even the invalid multi-extrema energy–volume curves produced by some interatomic potentials in a general way. The following materials properties were determined for the ground state structure and prototypes of the Strukturbericht A: the elastic matrix was calculated by a total-energy based method as described in [59] with a small deformation range (0.5%) and fits of the energy-strain curves to second-order polynomials. The phonon spectrum and density of states were calculated by means of the small displacement method using PHONOPY [60] with atomic displacements of 0.01 Å. The formation energy of vacancies was calculated by removing atoms at symmetrically inequivalent positions with subsequent full structure relaxation. The supercells for the phonons and point defect calculations were chosen to exhibit a minimal defect-defect distance of no less than 10 Å. Further materials properties were determined for the ground state structure only: the Gibbs free energy G(T), heat capacity CP(T) and thermal volume expansion β(T) were determined within the quasi-harmonic approximation (QHA). To this end phonon calculations at multiple volumes in a ±10% range around the equilibrium volume were carried out and used to evaluate the minimum free energy and equilibrium volume at each temperature. Transformation paths from the bcc structure to other crystal structures were calculated as described in e.g. [47]. Surface energies were calculated for a set of slab models obtained from the Crystalium web application at the Materials Virtual Lab website [61] for Mo and Si: all surfaces for Mo were unreconstructed, whereas for Si several representative surfaces with initial reconstructed geometries: (100) 2 × 1 with buckling, (111) 2 × 1 and (110) 1 × 1 were considered. The surface models contain from 6 to 36 atoms and a vacuum layer with a thickness of more than 11 Å. The atomic positions in the slabs were fully relaxed, but the cell shape and volume were kept fixed and corresponding to the equilibrium lattice constant of the ground-state structure for given combination of element and potential.
2.4.3. Validation level III: validation by application
The focus of level III validation is on the application of a model of the interatomic interaction in simulations that are more complex than required for basic materials properties like, e.g. the calculation of a phase diagram. These simulations are mostly too computationally expensive for DFT and therefore need to be carried out with an effective interaction model. A direct one-to-one comparison between the predictions of interatomic potentials and DFT reference calculations is therefore not possible for level III properties. We therefore will refrain from using level III properties in the present analysis except for the thermal expansion calculated by molecular dynamics simulations in the NPT ensemble by interatomic potentials only and focus on level II and also level I data, for which DFT data may be easily generated. Within limits, the validation of level III properties with DFT is possible by comparing level I data from the simulation, for example, snapshots from molecular dynamics trajectories, etc.
3. Assessment of Mo potentials
We focus on the comparison of basic materials properties (level II) first and will analyze a more generic sampling of the atomic environments (level I) in section 5.1.
A key test for any potential is the prediction of the correct relative stability of different crystal structures including the prediction of the correct ground-state crystal structure. To this end we compiled the energy–volume curves for structures of group A Strukturbericht designation as predicted by the different potentials and by DFT with LDA and GGA-PBE in figure 1. The Girifalco (Morse) potential predicts fcc as ground state instead of bcc. This is not surprising as purely isotropic interactions of pair potentials like the Morse potentials typically favor close-packed structures. For the other potentials the bond-energy is given by a nonlinear function of the number of neighbors. They correctly predict bcc as the ground-state structure.
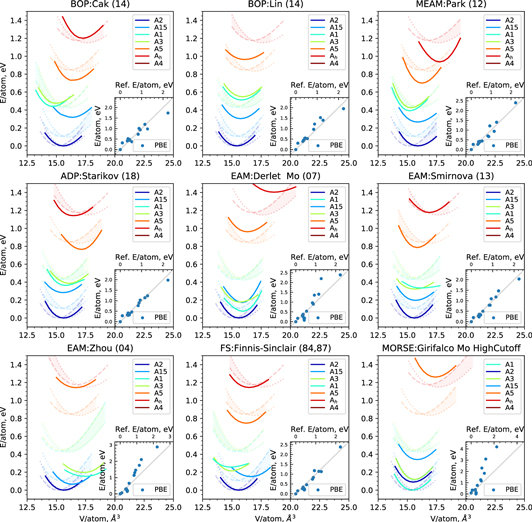
Figure 1. Energy–volume curves of low-energy crystal structures for Mo as predicted by interatomic potentials (solid line), LDA (dashed line) and GGA-PBE (dotted line). The full set of data with high-energy crystal structures is shown with the reference GGA-PBE in the inset.
Download figure:
Standard image High-resolution imageThe transferability of the different potentials to other crystal structures varies considerably. For illustration we compare the potentials to DFT calculations for the A1(fcc), A3(hcp), A4(diam), A5(β-Sn), A15(Cr3Si) and Ah(sc) structures. The energy differences between these structures and the A2 ground-state are best captured by Starikov (18), Cak (14) and Smirnova (13). The close-packed structures A1 and A3 are considerably more stable than in DFT in the Derlet (04), Zhou (04) and the Girifalco potentials. The A5 structure is too high in energy in the Zhou (04) and the Girifalco potentials. The transferability to structures with even higher formation energy (insets in figure 1, a list of structures is given in table A1) is overall fairly good for Finnis–Sinclair (84, 87), Smirnova (13), Park (12), Starikov (18) and the two BOP potentials. The other potentials tend to consistently overestimate the formation energy of structures with higher formation energy. None of the interatomic potentials achieves satisfactory energy differences between the A2 ground state, the A15 structure and the close packed fcc structure. In line with the observations regarding the structural stability, the Girifalco potential have large deviations on E0 and V0.
The predicted bcc-Mo elastic constants of the different potentials are compared to DFT calculations and experimental data in table 2. As for the transferability between crystal structures discussed above, the Girifalco potential shows large deviations from the DFT and experimental values of the elastic constants while Finnis–Sinclair (84, 87), Zhou (04), Derlet (07) and BOPs have relatively small deviations. Smirnova (13) and Starikov (18) showed good transferability regarding the structural stability but predict too high values of the elastic constants.
Table 2. Elastic matrix elements (in GPa) and bulk moduli for bcc-Mo calculated by different interatomic potentials along with experimental data.
| Potential | C11 | C12 | C44 | B |
|---|---|---|---|---|
| Girifalco Mo HighCutoff | 291 | 289 | 290 | 290 |
| Finnis–Sinclair (84, 87) | 465 | 162 | 109 | 263 |
| Zhou (04) | 456 | 167 | 113 | 263 |
| Derlet Mo (07) | 484 | 173 | 120 | 277 |
| Smirnova (13) | 569 | 233 | 170 | 345 |
| Park (12) | 424 | 145 | 96 | 238 |
| Cak (14) | 483 | 154 | 101 | 264 |
| Lin (14) | 511 | 160 | 119 | 277 |
| Starikov (18) | 548 | 168 | 160 | 295 |
| VASP 5.4 (LDA) | 526 | 173 | 112 | 291 |
| VASP 5.4 (PBE) | 483 | 150 | 109 | 261 |
| VASP 5 (PBE)a | 472 | 158 | 106 | 262 |
| Exp. [65] | 465 | 162 | 109 | 262 |
We also note the well-known deviation between DFT and experimental elastic properties that is typically of the order of 10%–20% in table 2. This discrepancy leads to artificial errors in our assessment if the potential was fitted to experimental data but is then compared to DFT data or vice versa. Still, DFT with the LDA and GGA-PBE exchange-correlation functionals provides a good range for the experimental data [62]. This is not exactly true for C11 here, but we note that other DFT calculations with VASP and the Mo_pv pseudopotential (with excluded two valence s-electrons) give C11 = 472 GPa [63], which is closer to experimental values. Therefore, we compare the elastic properties predicted by the different potentials not only to one set of DFT results but to the range spanned by LDA and GGA-PBE. In figure 2 we show the Young's modulus in the [001]-plane [64] from the set of elastic constants in table 2 predicted by the potentials and the range of LDA/GGA-PBE reference DFT calculations.

Figure 2. Young's modulus in XY plane for bcc-Mo as predicted by interatomic potentials, DFT and experiments [65].
Download figure:
Standard image High-resolution imageAs expected from the elastic constants the Girifalco potential shows the wrong order of magnitude of the Young's modulus. The Smirnova (13) and Starikov (18) potentials have an incorrect directional dependence of the Young's modulus because both were fitted to binary systems and from which one may expect qualitatively wrong predictions of the macroscopic mechanical behavior. The reasonable agreement of Derlet (07) and Zhou (04) with the DFT reference range indicates that the directional dependence of the Young's modulus can be captured with an EAM potential. The BOPs are in good agreement with the DFT reference range, the Park (12) potential slightly underestimates the Young's moduli. The Finnis–Sinclair potential reproduces the elastic constants perfectly, because they were used during fitting.
Similar to the elastic constants, the phonon spectra help to probe the performance of a potential for small deviations from the equilibrium geometry. In figure 3 (top panels) we compare the phonon spectra predicted by the interatomic potentials and by DFT to the experimental [66]. The LDA and GGA-PBE results are very similar to each other and in good agreement with the experimental points. A small underestimation of the frequency at the H point has been reported previously in [67] and related to the nesting of electronic states near the Fermi level [68].

Figure 3. Phonon spectrum (top) and phonon DOS (bottom) for bcc Mo predicted by interatomic potentials and DFT. The dots in the upper panels indicate the experimental [66].
Download figure:
Standard image High-resolution imageFor the interatomic potentials we once more observe large deviations for the Girifalco potential, it is therefore excluded from the following discussion. The trend for the remaining potentials is less clear as the performance varies strongly within the Brillouin zone. For the Γ–H path, the performance of the EAM and MEAM potentials is better than the BOP predictions. None of the potentials is able to capture the concave character of the H–P segment. The two branches in the  path are well reproduced by the EAM, MEAM and ADP potentials, while both BOPs show a crossing of the branches. The best reproduction of the three branches along the
  path is provided by the Finnis–Sinclair (84, 87), Derlet (07), Zhou (04) and Park (12) potentials.
From the phonon DOS we compute thermodynamic materials properties for low temperature within the quasiharmonic approximation. For the bcc ground-state structure of Mo we determined the vibrational contribution to the heat capacity at zero pressure, the thermal expansion coefficient and the temperature-dependence of the bulk modulus. The predictions of the different potentials and DFT for these properties are compiled in figure 4, together with the experimental reference where available.
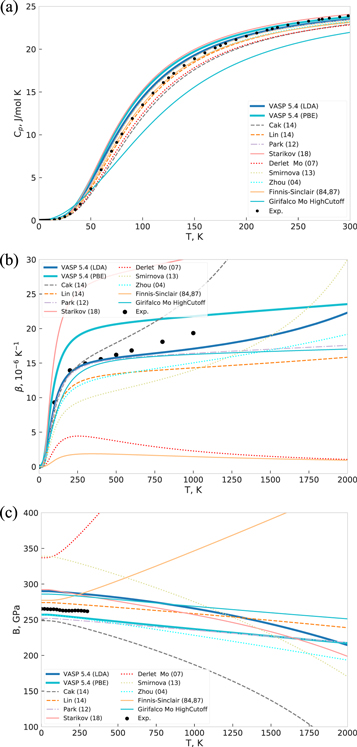
Figure 4. (a) Vibrational contribution to the specific heat at constant pressure (Cp) for bcc Mo for various potentials as predicted by quasiharmonic approximation and comparison to experimental data [69]. (b) Thermal expansion coefficient for bcc Mo for various potentials compared to experimental data [70] (black dots). (c) Bulk modulus of molybdenum body-centered cubic crystal calculated by different interatomic potentials. Experimental [71] are shown as dots.
Download figure:
Standard image High-resolution imageThe DFT range of LDA and GGA-PBE calculations is overall in good agreement with the experimental data points. A notable deviation is the overestimation of the room temperature expansion coefficient by almost 30% by GGA-PBE, whereas LDA shows a perfect match. This has been observed previously [73] and was attributed to limitations of the GGA for transition metals.
For the different potentials we observe a considerably different predictions for the three thermodynamic properties. Regarding the heat capacity, most potentials are close to experiment and the LDA/GGA-PBE range which implies that the specific heat is not too great a challenge for the potentials. This is not unexpected, as the specific heat is obtained as an exponentially weighted integral characteristic of the phonon density of states with expected asymptotic high-temperature behavior determined by the Dulong–Petit law. Considerable deviations of Cp are only observed for the Girifalco potential that also exhibit the poorest predictions for the phonon spectrum. A good match of the specific heat does not imply a good reproducibility of thermal expansion. Instead, thermal expansion correlates with B'. In particular, good agreement of the Girifalco potential for the thermal expansion and the temperature-dependent bulk modulus is observed although the predicted DOS and heat capacity are not captured well. Vice versa we find that the Finnis–Sinclair (84, 87), Derlet (07), Smirnova (13) and Starikov (18) with reasonable phonon DOS and heat capacity predictions are not able to predict thermal expansion and the temperature-dependent bulk modulus in agreement with DFT or experiment.
We performed molecular dynamics simulations of thermal expansion in the NPT ensemble (NPT-MD) at zero pressure and different temperatures. The comparison of equilibrium volumes at different temperatures for bcc Mo as calculated by different interatomic potentials is shown in figure 5 together with values obtained from QHA and experiment. The QHA is exact at low temperature and correctly includes zero point vibrations and quantum effects, whereas MD simulations fully include anharmonic contributions and provide a correct description at high temperatures, when the quantum effects are not important, i.e. above the Debye temperature. The large deviation between two methods indicates strong anharmonicity. A perfect match between the two methods is achieved for Park (12), Zhou (04) and Girifalco potentials, whereas for the Starikov (18) and Smirnova (13) potentials the agreement is less pronounced. The largest difference between the two methods is observed for the Finnis–Sinclair (84, 87) potential and possibly can be attributed to limitations of the QHA at high T, whereas NPT-MD demonstrates a good agreement with experiment. The Derlet (07) potential shows negative thermal expansion as reported before [27], which correlates with very small thermal expansion predicted by the QHA method.

Figure 5. Equilibrium volumes at different temperatures for bcc Mo for different interatomic potentials computed by molecular dynamics simlations (NPT-MD, dotted) and in QHA (lines). Experimental data are from [72].
Download figure:
Standard image High-resolution imageOverall the correlation between thermal expansion and the temperature-dependent bulk modulus is expected as in the most simple case the asymmetry of the energy–volume curve, characterized by  , determines the thermal expansion β. In practice this correlation is not strong as, e.g. Park (12) matches the LDA results for β but the GGA-PBE result for
  .
.
The ground-state properties discussed so far involve stretching and bending of interatomic bonds while leaving them intact otherwise. This is different for a vacancy, where interatomic bonds are broken when an atom is removed. The formation energy of a vacancy is therefore another central test for the transferability of interatomic potentials. In table 3 we compiled the results for the vacancy formation energy in Mo in the bcc structure from the different interatomic potentials and DFT calculations.
Table 3. Vacancy formation energy (eV) for bcc Mo calculated by different interatomic potentials for unrelaxed structures (unrelax), relaxed atomic positions (at) and fully relaxed structures (full).
| Potential |

|

|

|
|---|---|---|---|
| Girifalco Mo HighCut. | 6.75 | 5.36 | 5.35 |
| Finnis–Sinclair (84, 87) | 2.58 | 2.55 | 2.55 |
| Zhou (04) | 3.16 | 2.97 | 2.96 |
| Derlet Mo (07) | 3.08 | 2.97 | 2.97 |
| Park (12) | 3.03 | 2.98 | 2.95 |
| Smirnova (13) | 2.77 | 2.62 | 2.61 |
| Cak (14) | 2.72 | 2.66 | 2.66 |
| Lin (14) | 3.21 | 3.21 | 3.21 |
| Starikov (18) | 2.92 | 2.81 | 2.80 |
| VASP 5.4 (LDA) | 3.04 | 2.93 | 2.90 |
| VASP 5.4 (PBE) | 2.92 | 2.82 | 2.80 |
| Exp. | — | — | 2.6–3.2 [74] |
The transferability of the different potentials for the vacancy formation energy is in line with the overall trends of transferability for other properties. The DFT reference values are similar for LDA and GGA-PBE. The Girifalco potentials show the largest deviation from the DFT reference, whereas all other potentials provide a reasonable agreement within a ±0.3 eV corridor with respect to GGA-PBE. Known experimental data [74] are scattered because of different measurement techniques.
Another test of bond breaking and bond making is provided by transformation paths, e.g. from the bcc ground-state structure to other crystal structures. This makes transformation paths an important contribution in the assessment of transferability of interatomic potentials. Here, we considered the orthogonal, trigonal, hexagonal and tetragonal transformation paths, for details see, e.g. [47]. The variation of the energy along the transformations paths is shown in figure 6 with respect to the lowest energy along the path for the different potentials and DFT calculations. The Girifalco potential show the largest discrepancy to the DFT results for all transformation paths. Both, Girifalco potential and Derlet (07) show a qualitatively incorrect energy variation along the hexagonal and tetragonal transformation paths. The latter also shows an additional minimum in the middle of the orthogonal transformation path, which is potentially due to its shortest interaction range (cutoff radius 4.25 Å) among the considered potentials. The other EAM potentials (Finnis–Sinclair (84, 87), Smirnova (13) and Zhou (04)) deviate considerably for all transformations paths and do not capture the saddle point near p = 4 of the trigonal transformation path. The MEAM Park (12) and the two BOPs are the only potentials that capture the qualitative features of the energy variation within reasonable to good quantitative agreement.
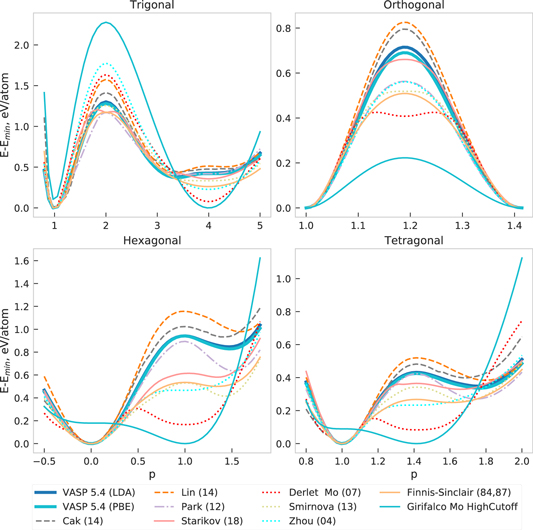
Figure 6. Transformation paths between crystal structures of Mo for a number of potentials and DFT calculations. The energies are given with respect to the lowest energy structure.
Download figure:
Standard image High-resolution imageFor level II validation we further assessed the predictions of the interatomic potentials for surfaces of bcc-Mo. Here we computed the surface energy of relaxed, unreconstructed slab models for a representative set of orientations. In the top panel of figure 7 we ordered the results according to increasing surface energy as obtained by the GGA-PBE calculations. This allows immediate identification of the prediction of the most stable surface and the energetic ordering of surfaces.

Figure 7. Surface energy of unreconstructed relaxed surfaces of bcc-Mo ordered by surface orientation according to ascending GGA-PBE values and by average surface energy for each potential.
Download figure:
Standard image High-resolution imageThe GGA-PBE results are slightly lower in energy than the LDA results but show the same energetic ordering with very similar energy differences between the different surfaces. It was shown from the estimation of the surface energies from liquid surface tension measurements [75, 76] that GGA-PBE underestimates the surface energy, whereas LDA provides more accurate predictions with error bars smaller than 10% [76].
All potentials except the Morse potential correctly predict the  surface as the most stable one. The trend of the energetic ordering is similar for all EAM and MEAM potentials but very different from the ordering observed in the DFT calculations. The Starikov (18) potential significantly overestimates the surface energies, however the energetic ordering is simular to EAM and MEAM potentials. The trend of the predictions of the two BOPs is similar to each other and closest to the DFT reference. Aside from a notable overall shift, the challenging surfaces regarding transferability are the overestimated
  and
and  surfaces.
4. Assessment of Si potentials
In figures 8 and 9 the energy–volume curves of low-energy Si crystal structures as predicted by interatomic potentials (solid line), LDA (dashed line) and GGA-PBE (dotted line) are shown. All potentials correctly predict the diamond structure (A4) as the ground state. However, the energy of the following phase—A5/β–Sn is correctly reproduced only by Stillinger (85) and Balamane (92).
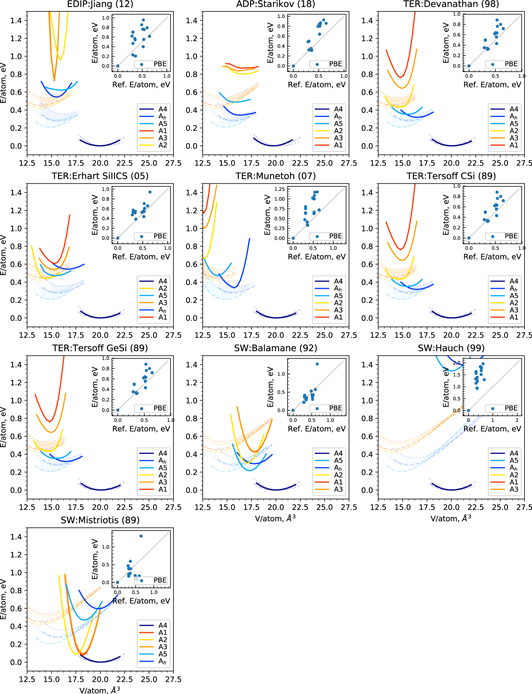
Figure 8. Energy–volume curves of Si as predicted by interatomic potentials (solid line), LDA (dashed line) and GGA-PBE (dotted line). The insets summarize the comparison to GGA-PBE at the equilibrium volume. Energy of diamond-Si is shifted to zero for ease of comparison.
Download figure:
Standard image High-resolution image
Figure 9. Energy–volume curves of Si as predicted by interatomic potentials (solid line), LDA (dashed line) and GGA-PBE (dotted line). The insets summarize the comparison to GGA-PBE at the equilibrium volume. Energy of diamond-Si is shifted to zero for ease of comparison.
Download figure:
Standard image High-resolution imageThe values of the elastic matrix elements for diamond-Si are given in table 4 and the corresponding profiles of Young's modulus in XY-plane are shown in figure 10. The small elastic constants and modulus for Tersoff 37(88) reflects weak bond-angle forces in this potential [35]. The overestimation of elastic constants by a factor of two by Mistriotis (89) may be explained by considering that it was set up with the primary goal to reproduce the energetics of small silicon clusters and not bulk material. The large deviation of Hauch (99) is explained by its specific optimization for brittle crack propagation.
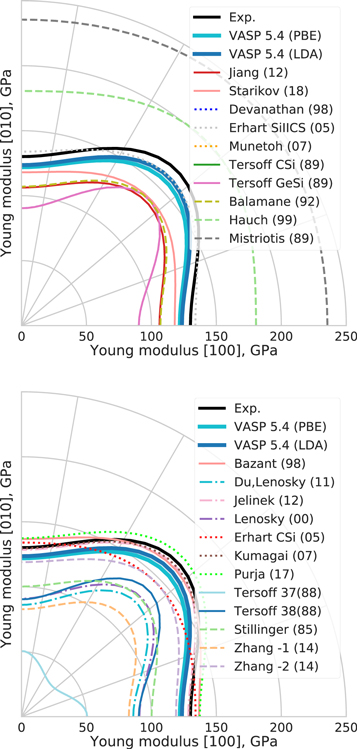
Figure 10. Young's modulus in XY plane of diamond-Si as predicted by interatomic potentials and DFT. Experimental data are from [77].
Download figure:
Standard image High-resolution imageTable 4. Elastic matrix elements (in GPa) and bulk moduli for diamond-Si calculated by interatomic potentials, DFT and experiment.
| Potential | C11 | C12 | C44 | B |
|---|---|---|---|---|
| Stillinger (85) | 151 | 76 | 56 | 101 |
| Tersoff 37(88) | 122 | 86 | 10 | 98 |
| Tersoff 38(88) | 143 | 75 | 69 | 98 |
| Tersoff CSi (89) | 143 | 75 | 69 | 98 |
| Tersoff GeSi (89) | 143 | 75 | 69 | 98 |
| Mistriotis (89) | 246 | 39 | 112 | 108 |
| Balamane (92) | 162 | 82 | 60 | 108 |
| Bazant (98) | 172 | 65 | 73 | 100 |
| Devanathan (98) | 143 | 75 | 69 | 98 |
| Hauch (99) | 201 | 51 | 91 | 101 |
| Lenosky (00) | 143 | 76 | 61 | 98 |
| Erhart CSi (05) | 169 | 64 | 60 | 99 |
| Erhart SiIICS (05) | 169 | 64 | 72 | 99 |
| Kumagai (07) | 166 | 65 | 77 | 99 |
| Munetoh (07) | 142 | 75 | 69 | 98 |
| Du, Lenosky (11) | 139 | 76 | 59 | 97 |
| Jelinek (12) | 165 | 65 | 77 | 98 |
| Jiang (12) | 155 | 75 | 59 | 102 |
| Zhang-1 (14) | 141 | 81 | 48 | 101 |
| Zhang-2 (14) | 158 | 66 | 65 | 97 |
| Purja (17) | 173 | 65 | 81 | 101 |
| Starikov (18) | 180 | 92 | 57 | 121 |
| VASP 5.4 (PBE) | 153 | 57 | 74 | 89 |
| VASP 5.4 (LDA) | 161 | 65 | 75 | 97 |
| VASP 5 (PBE)a | 144 | 53 | 75 | 83 |
| Exp. [77] | 166 | 64 | 80 | 98 |
In figures 11 and 12 we compare the phonon spectra predicted by the interatomic potentials and DFT to the experimental [78]. Corresponding phonon densities of states are shown in figure 13. As for molybdenum, both LDA and GGA-PBE results are very similar to each other and in good agreement with the experimental data except for a small frequency underestimation at the X point.

Figure 11. Phonon spectrum of diamond-Si predicted by different interatomic potentials, together with experimental reference (dots) [78].
Download figure:
Standard image High-resolution image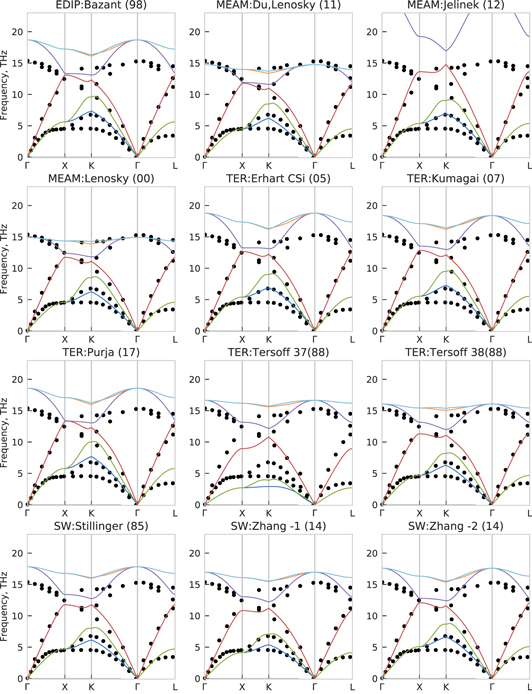
Figure 12. Phonon spectrum of diamond-Si predicted by different interatomic potentials and DFT, together with experimental reference (dots) [78].
Download figure:
Standard image High-resolution image
Figure 13. Phonon density of states of diamond-Si predicted by different interatomic potentials and DFT.
Download figure:
Standard image High-resolution imageAll potentials demonstrate good agreement to experimental data for the second acoustical branch along Γ–X direction (red line in figures 11 and 12). Tersoff 37(88) shows an underestimation of acoustical and an overestimation of optical branches, that was improved in later versions (Tersoff 38(88), Tersoff CSi(89) and Tersoff GeSi(89)). Also we found a good agreement to the experimental reference for the two Zhang interatomic potentials. Balamane (92), Bazant (98), both Erhart (05) and Stillinger (85) overestimate the frequencies for both acoustical and optical branches. Hauch (99) and Mistriotis (89) have more significant deviations from the optical branches. The most dramatic inconsistency is for the MEAM Jelinek (12) potential, as can be seen from both phonon spectrum (figures 11 and 12) and density of states (figure 13). While the slope of the acoustical branches shows reasonable agreement together with elastic constants, the optical branches peak at around 25 THz in contrast to 15 THz of DFT calculations and experiment.
The predictions of the different interatomic potentials and DFT for the thermodynamic properties heat capacity Cp, thermal expansion coefficient β and temperature dependence of the bulk modulus B are compiled in figures 14 and 15, together with the experimental reference data [79–81]. Both LDA and GGA-PBE as well as Starikov (18), Du, Lenosky (11) and Lenosky (00), are in good agreement with experimental data for the heat capacity, whereas most of the potentials, except for Tersoff 37(88), underestimate it at lower temperatures. This perfectly correlates with the behavior of the corresponding phonon densities of states (figure 13) for these potentials. Moreover, the 'outlier'-like behavior of the phonon DOS by Jelinek (12), Jiang (12) and Tersoff 37(88) is reflected in their incorrect prediction of the thermal expansion β(T). However, a good agreement in the phonon DOS at equilibrium volume does not imply a good agreement for thermal expansion: the negative values of the thermal expansion coefficient of Si up to about 100 K are reproduced correctly only by DFT methods (figures 14 and 15, middle panel), whereas Starikov (18) and the Tersoff potentials overestimate it over the whole temperature range,and Du, Lenosky (11) and Lenosky (00) show it negative in the QHA. Balamane (92), Stillinger (85) and Zhang-1 (14) show the best agreement with both experimental and DFT predicted thermal expansion, the other potentials overestimate thermal expansion. All potentials except Jiang (12) and DFT predict a decrease of the bulk modulus with increasing temperature, as shown in figures 14 and 15. Their values lie in a range of ±10 GPa around the experimental data, except for Tersoff 37(88), Du, Lenosky (11) and Lenosky (00) which show too strong softening. Such deviations of thermodynamic properties were also confirmed by calculating the equilibrium volumes at different temperatures in NPT-MD simulations, as shown in figure 16. Both QHA and NPT-MD methods predict very low or even negative thermal expansion by Jiang (12), Du, Lenosky (11), Lenosky (00), Bazant (98) and Tersoff 37(88) in contrast to Jelinek (12) that overestimates it significantly. The thermal volume expansion calculated by the Munetoh (07) potential in QHA approximation coincides with other Tersoff potentials, whereas the NPT-MD simulation shows a decreasing volume at temperatures higher than 600 K.
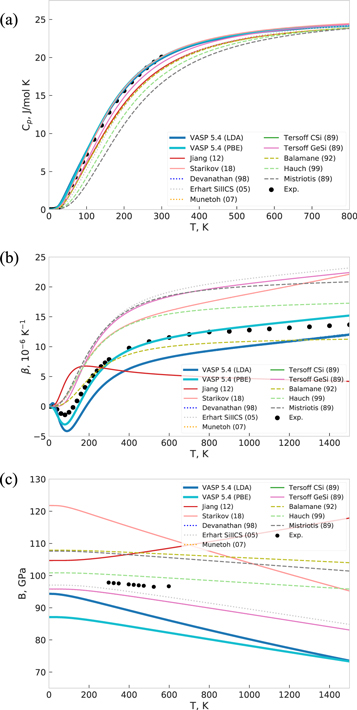
Figure 14. (a) Heat capacity Cp, (b) thermal expansion coefficient and (c) bulk modulus for diamond-Si as obtained with different interatomic potentials and DFT along with experimental reference data [79–81].
Download figure:
Standard image High-resolution image
Figure 15. (a) Heat capacity Cp, (b) thermal expansion coefficient and (c) bulk modulus for diamond-Si as obtained with different interatomic potentials and DFT along with experimental reference data [79–81].
Download figure:
Standard image High-resolution image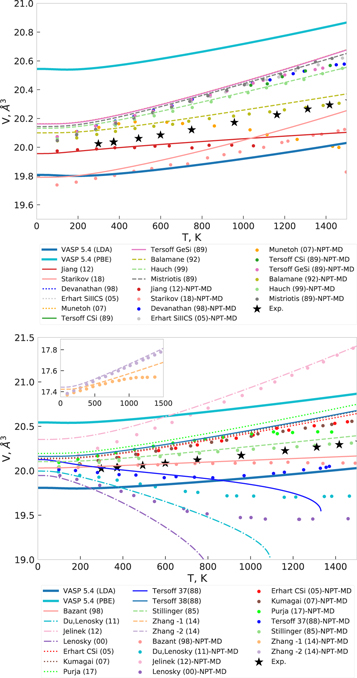
Figure 16. Equilibrium volumes at different temperatures for diamond Si for different interatomic potentials computed by molecular dynamics simlations (NPT-MD) and in QHA. Experimental data are from [82].
Download figure:
Standard image High-resolution imageThe neutral vacancy formation energies in diamond-Si as calculated by different interatomic potentials along with DFT are presented in table 5. Both LDA and GGA-PBE calculations and most of the later interatomic potentials, Erhart (05), Jelinek (12) and Zhang (14), are close to the experimental range of 3.6 ± 0.2 eV. Starikov (18), Kumagai (07) and Tersoff 37 (88) underestimate the vacancy formation energy, whereas Stillinger (85), Tersoff (88-89), Mistriotis (89) and Balamane (92) overestimate it by approximately 1 eV.
Table 5. Neutral vacancy formation energy (eV) for diamond-Si calculated with different interatomic potentials and DFT for unrelaxed (unrelax), relaxed atomic position (at) and fully relaxed (full) structures.
| Potential |

|

|

|
|---|---|---|---|
| Stillinger (85) | 4.34 | 4.34 | 4.34 |
| Tersoff 37(88) | 2.83 | 2.81 | 2.81 |
| Tersoff 38(88) | 4.10 | 3.73 | 3.73 |
| Tersoff CSi (89) | 4.10 | 3.73 | 3.71 |
| Tersoff GeSi (89) | 4.10 | 3.73 | 3.71 |
| Mistriotis (89) | 4.63 | 4.63 | 4.63 |
| Balamane (92) | 4.63 | 4.63 | 4.63 |
| Bazant (98) | 3.46 | 3.24 | 3.23 |
| Devanathan (98) | 4.10 | 3.73 | 3.71 |
| Hauch (99) | 4.34 | 4.34 | 4.34 |
| Lenosky (00) | 3.85 | 3.83 | 3.83 |
| Erhart CSi (05) | 3.19 | 3.14 | 3.14 |
| Erhart SiIICS (05) | 3.16 | 3.14 | 3.14 |
| Kumagai (07) | 2.85 | 2.82 | 2.82 |
| Munetoh (07) | 4.10 | 3.73 | 3.71 |
| Du, Lenosky (11) | 3.19 | 3.09 | 3.09 |
| Jelinek (12) | 4.05 | 3.41 | 3.35 |
| Jiang (12) | 3.19 | 3.01 | 2.98 |
| Zhang-1 (14) | 3.43 | 3.43 | 3.43 |
| Zhang-2 (14) | 3.59 | 3.59 | 3.59 |
| Purja (17) | 3.57 | 3.54 | 3.54 |
| Starikov (18) | 2.07 | 2.06 | 2.06 |
| VASP 5.4 (LDA) | 3.50 | 3.36 | 3.29 |
| VASP 5.4 (PBE) | 3.47 | 3.39 | 3.35 |
| Exp. [83] | — | — | 3.6 ± 0.2 |
The formation energy for different surfaces of diamond-Si are shown in figure 17. The GGA-PBE predictions are lower than the LDA results, as was discussed in [76]. Almost none of the potentials preserves the relative energetic order of the surfaces and only Tersoff 37(88), Erhart CSi(05) and Erhart SiIICS(05) predict reconstructed (100) to be the lowest-energy surface in agreement with DFT calculations. Mistriotis (89) and Hauch (99) show the largest values for the surface energies, which correlates with their 'outlier' behavior for elastic and vibrational properties. The (100) 2 × 1 surface reconstruction exhibits a non-symmetric dimerization of the surface atoms, i.e. the out-of-plane coordinates of atoms in the Si surface-dimer are different [61]. This behavior is found by both DFT functionals, as well as by Bazant (98) and Mistriotis (89) potentials, whereas the rest of the potentials result in symmetric dimerization.
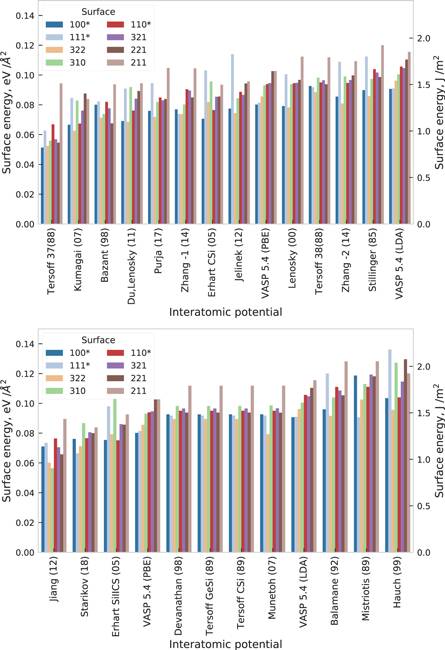
Figure 17. Surface energy for optimized slab model of a facet with indicated Miller indices for diamond-Si. Slab models, including reconstructed (100)* 2 × 1, (111)* 2 × 1 and (110)* 1 × 1 surfaces, were obtained using the Crystalium web application at the Materials Virtual Lab website [61]. The values are ordered by surface orientation according to ascending GGA-PBE values and by average surface energy for each potential.
Download figure:
Standard image High-resolution image5. Level I validation: environment sampling
While the properties discussed in the preceding sections are evidently useful for characterizing the properties of a potential, it is clear that they are not independent and potentially only sample a sparse subset of possible atomic environments. Therefore the calculation of basic materials properties can only be one part in the assessment of an interatomic potential. In addition, a more general sampling of atomic environments is required to assess transferability.
5.1. Molybdenum
For level I validation of the interatomic potentials for Mo (see table 1), we determined the total energies at the equilibrium volume for a large set of random structures as described in section 2.4.1. In order to analyze the different potentials for this large set of structures in a direct manner, we compiled the energy per atom of each structure in an energy distribution shown in figure 18. Clearly, the density of states shown in figure 18 is not the thermodynamic density of states, it is just the density of states that one obtains for the particular set of structures. Still, if two potentials predict the same energies for identical structures, their densities of states should coincide. In contrast to this it is immediately clear from figure 18 that the density of states shows significant differences among the interatomic potentials and DFT. The BOPs Cak (14) and Lin (14), MEAM Park (12) and ADP Starikov (18) show the best match to DFT at low energy, then the group of EAM potentials: Zhou (04), Smirnova (13) and Derlet (07), while pair potentials are off.
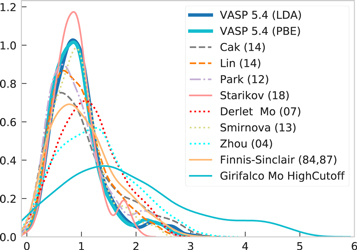
Figure 18. Distribution of energy per atom for random structures of molybdenum as predicted by a number of interatomic potentials as well as by LDA and GGA-PBE. The energy of bcc-Mo is shifted to zero for ease of comparison.
Download figure:
Standard image High-resolution imageThe transferability discussed for the group A Strukturbericht structures (see section 3) is observed in a similar way for the random structures. In particular, we find that the width and shape of the energy distribution of the Starikov (18), Smirnova (13), Park (12) and the two BOP potentials are close to the DFT result. The Derlet (07) and Zhou (04) are similar in the energy distribution but the peak is shifted to higher energies with respect to the DFT results. The Morse potential shows a too large width of the energy distribution and do not capture the shape of the DFT energy distribution. In addition, it predicts energies that are lower than the lowest DFT energy and the wrong ground-state, see figure 1.
5.2. Silicon
Our set of random structures does not cover the diamond structure, the minimum equilibrium energy of any random structure is 0.4 eV above the ground state, as can be seen from the energy distribution in figure 19. Again, Stillinger (85) and Balamane (92) are closest to GGA-PBE. Hauch (99) overestimates the energy the most, for both prototypes and random structures, possibly because it was fitted specifically to reproduce crack propagation dynamics (see table 1).
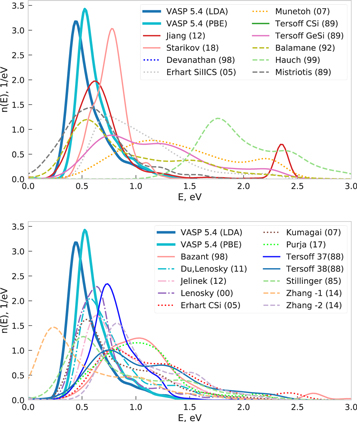
Figure 19. Distribution of the energy per atom for the random structures for Si as obtained by interatomic potentials, LDA and GGA-PBE. Energy of groundstate structure diamond-Si is shifted to zero for ease of comparison.
Download figure:
Standard image High-resolution image6. Discussion
6.1. Property correlations
In order to get a more general idea of the predictive power of the potentials we considered correlations between different properties across different prototype crystal structures, excluding the duplicate prototypes that were relaxed to the same final structures with GGA-PBE. The values that different potentials predict for a given property can vary dramatically for different prototypes due to the limited transferability of the potentials. We measure the correlations between property and prototype using Spearman's rank correlation coefficient [84]. The remaining number of data points is varied from 4 to 26 for different potentials and property pairs, therefore the analysis gives only approximate feeling of property correlations. A summary of statistically significant (p-value < 0.05) correlations is shown in figure 20.
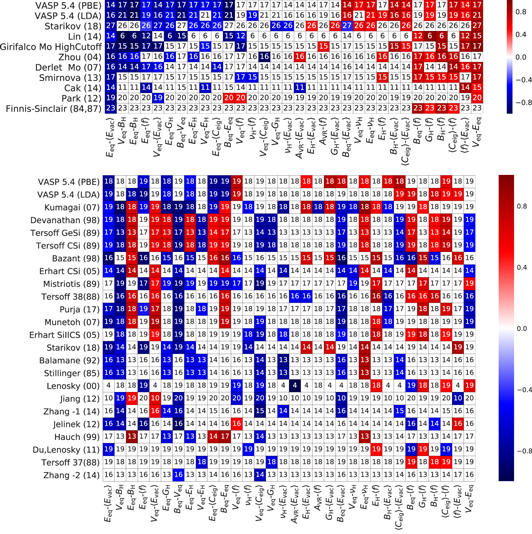
Figure 20. Heatmap of the Spearman correlation coefficients between properties (Eeq—equilibrium energy per atom, Beq—equilibrium bulk modulus, Veq—equilibrium volume,  —mean eigenvalues of elastic matrix, EH, GH and BH—Young's, shear and bulk modulus calculated from elastic matrix, νH—Poisson's ratio,
  —mean phonon frequency (imaginary frequencies are treated as negative),
  —average vacancy formation energy) for Mo (top) and Si (bottom). The numbers in the cells are the amount of considered structures from Strukturbericht A for particular property pairs. Only statistically significant correlations (p-value < 0.05) are non-zero.
Download figure:
Standard image High-resolution imageWe observe a correlation between the equilibrium energy Eeq and the vacancy formation energy  , because the energy required for removing an atom from a high-energy phase is smaller than in a low energy phase. Moreover, negative values of the vacancy formation energy
  are observed, which means that the creation of a vacancy initiates structural relaxation towards a more stable phase. The negative correlation between the equilibrium energy Eeq and the bulk modulus (BH or Beq) is well established also for experimental data for different materials [85]. The same applies to other elastic properties—shear GH and Young's EH modulus as well as the average of the elastic matrix eigenvalues
  . Structural stability as represented by the equilibrium energy Eeq is also reflected in vibrational properties, represented here by averaged frequencies
  , where imaginary frequencies are treated as negative. Most of the potentials reproduce a positive correlation between equilibrium energy and volume, which is related to the tendency of molybdenum to form a closed-packed structures instead of open structures, as discussed in section 3.
For comparison we performed the same analysis for interatomic potentials of silicon (table 1) in figure 20, bottom panel. The silicon interatomic potentials show a significantly different correlation pattern, that not always corresponds to the GGA-PBE calculations.
The failure of the potentials to reproduce some of the property correlations despite their good performance for ground-state properties may be viewed as a lack of transferability. Thus, the consideration of property–property correlations without direct comparison to reference data could be a good test for assessing the transferability and consistency of interatomic potentials.
6.2. Assessing the transferability of interatomic potentials
In order to further investigate the transferability of interatomic potentials, we consider deviations over a wide range of energies and structures. We define a Boltzmann weighted mean-absolute deviation (MAD) of a given property A as a function of an effective temperature Teff,

with  , ΔAi the deviation of given structure i with respect to a given reference and Ei the reference energy for structure i (in our case GGA-PBE). The absolute value of the deviation provides better robustness to outliers in contrast to the root-mean-square deviation. The low temperature limit (Teff = 0) of the weighted average corresponds to the accuracy for ground state properties, whereas the high temperature limit characterizes the overall transferability of the potential, because all structures, including higher-energy ones have equal weights in equation (1). Deviations for equilibrium energy ΔE, volume ΔV, bulk modulus ΔB and ΔB' with respect to GGA–PBE as calculated by interatomic potentials and LDA for one- and two-atom Mo and Si random structures are shown in figures B1 and B2 correspondingly.
In figure 21 we compiled the weighted deviation for the equilibrium energy calculated by the different interatomic potentials of molybdenum for the set of random structures described in section 2.4.1. The high temperature limit is related to the transferability of a given potential and correlates with the similarity of the density of states shown in figure 18 of GGA-PBE and a given interatomic potential. In particular, the MEAM Park (12) and ADP Starikov (18) potentials have the lowest deviation in the high temperature limit because they were fitted to high-T MD trajectories of a liquid (see table 1). The potentials behave differently at low temperature, as one can see in the inset of figure 21: Smirnova (13) and Starikov (18) exhibit a shallow minimum at low temperatures (kBTeff ≤ 50 meV).
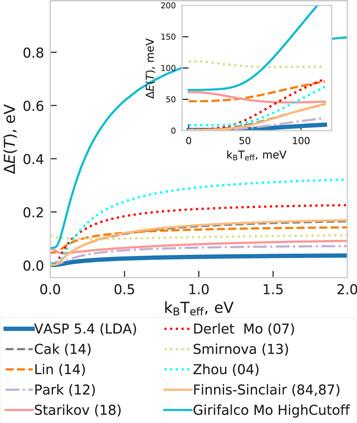
Figure 21. Weighted deviations over random structures of molybdenum as a function of effective temperature Teff.
Download figure:
Standard image High-resolution imageFor comparison we performed the same analysis for interatomic potentials of silicon (table 1) in figure 22. The weighted deviation for silicon potentials is more diverse than for molybdenum. Three potentials (Mistriotis (89), Lenosky (00)and Starikov (18)) have lowest overall (high-T limit) deviation. This can be explained by the fact that the Mistriotis potential was designed to deal with mostly non-ground-state structures—clusters, the Lenosky (00) potential was constructed to improve the description of amorphous phases, liquid and bulk defects and the Starikov (18) potential was fitted to a set of ordered and disordered silicon structures (see table 1). This demonstrates that we can assess the transferability of a given potential by estimating their Boltzmann weighted deviation for a set of random structures that uniformly covers a large domain of atomic environments [58]. The overall distributions of the deviation for equilibrium energy  , volume ΔV, bulk modulus ΔB and ΔB' with respect to GGA-PBE as calculated by interatomic potentials and LDA for Mo and Si random structures are given in appendix B.

Figure 22. Weighted deviations over random structures of silicon as a function of effective temperature Teff (see text for details).
Download figure:
Standard image High-resolution image6.3. Overview of the performance of interatomic potentials
We further assess the broad performance of the potentials by plotting deviations for different properties as calculated by interatomic potentials with respect to GGA-PBE and LDA for Mo in figures 23 and 24. The transferability to different structures is estimated from deviations in cohesive energies ΔE, volumes ΔV, bulk modulus ΔB and pressure derivatives ΔB'. The other properties characterize the deviations for the groundstate structure. The deviation of the thermal expansion coefficient (Δβ) is considered in a temperature range up to 2000 K.

Figure 23. Errors for the considered properties as calculated by interatomic potentials with respect to GGA-PBE (blue solid line) and LDA (orange dashed line): ΔE0, ΔV0, ΔB0, ΔB0' and ΔE, ΔV, ΔB, ΔB' correspond to deviations of cohesive energy (eV), volume per atom (Å3), bulk moduli (GPa) and derivative of the bulk modulus with respect to pressure for bcc-Mo and averaged over Strukturbericht A structures, correspondingly; RMSE of elastic matrix (ΔC, GPa), Youngs moduli (ΔYoung, GPa), phonon frequencies (ΔfRMSE, THz) and density of states (ΔDOSvib, THz−1), vibrational contribution to entropy (ΔSvib, J mol−1 K−1), free energy (ΔFvib, kJ mol−1) and heat capacity at constant volume (ΔCV, J mol−1 K−1), vacancy formation energies ( ,
,  ,
,  , eV), MAD of transformation path (ΔTP, eV), average surface energy deviation (Δγ, eV Å−2 ), heat capacity at constant pressure (ΔCP, J mol−1 K−1) and thermal expansion (Δβ, 10−6 K−1) for bcc-Mo. The scale was chosen such that the LDA–PBE deviations (green line) are contained in the inner circle.
Download figure:
Standard image High-resolution image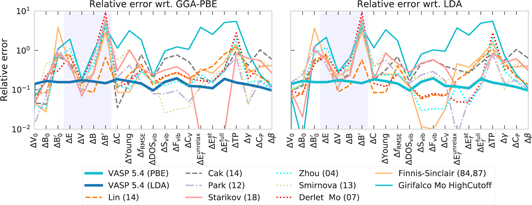
Figure 24. Relative deviations for a number of properties as calculated by interatomic potentials for Mo with respect to GGA-PBE and LDA. A relative deviation equal to one corresponds to the deviation scale in figure 23. Shaded areas correspond to the transferability error.
Download figure:
Standard image High-resolution imageThe deviations for different properties as calculated by interatomic potentials with respect to GGA-PBE and LDA for Si are compiled in figures 25–27. As for Mo, there is no single potential with best performance. For example, the gain in the transferability over prototypes (low deviations ΔE, ΔV, ΔB and ΔB') leads to poor vibrational and thermodynamic properties correspondingly for MEAM Jelinek (12) and TER Purja (17); on the other hand, the ADP Starikov (18) potential with good transferability and vibrational properties exhibits inaccurate prediction of the vacancy formation energy.
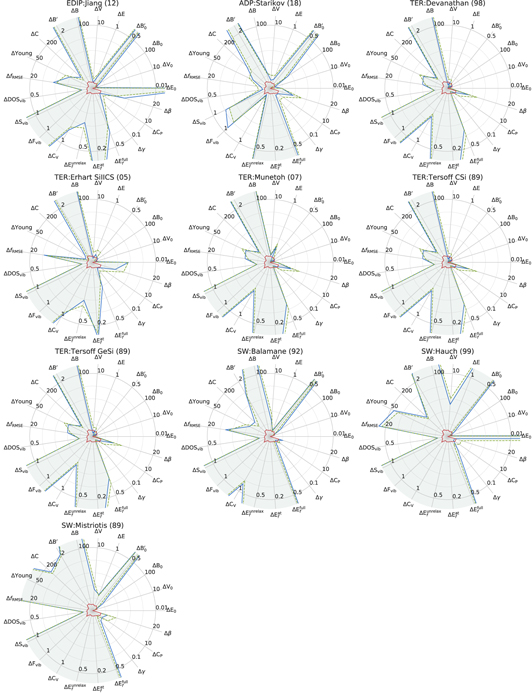
Figure 25. Errors for the considered properties for Si as calculated by interatomic potentials with respect to GGA-PBE (blue solid line) and LDA (orange dashed line), LDA–PBE difference is shown in the center (green line). See caption of the figure 23 for more details.
Download figure:
Standard image High-resolution image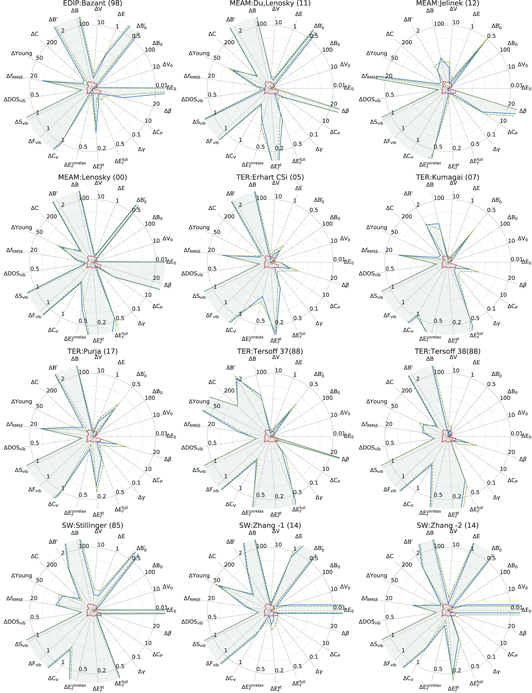
Figure 26. Errors for the considered properties for Si as calculated by interatomic potentials with respect to GGA-PBE (blue solid line) and LDA (orange dashed line), LDA–PBE difference is shown in the center (green line). See caption of the figure 23 for more details.
Download figure:
Standard image High-resolution image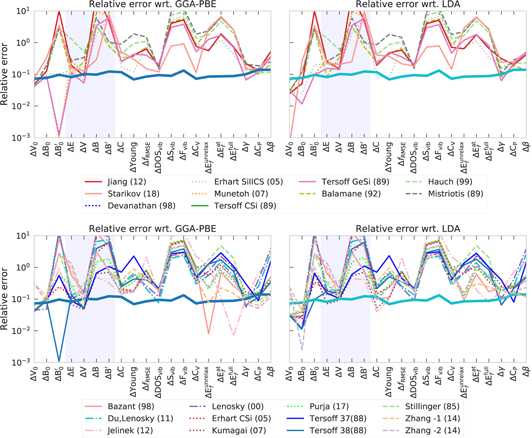
Figure 27. Relative deviations for a number of properties as calculated by interatomic potentials for Si with respect to GGA-PBE and LDA. A relative deviation equal to one corresponds to the deviation scale in figures 25 and 26. Shaded areas correspond to the transferability error.
Download figure:
Standard image High-resolution imageBy comparing the potentials performances for level-I (figures 21 and 22) and level-II (figures 23, 25 and 26) one can observe that potentials with high transferability (low level-I deviations at high effective temperatures) have high deviations for  and B'.
More generally, there is no single potential with best performance over all properties. This is a clear illustration of the Pareto front in potential fitting, which is a particular case of a multi-objective optimization. However, several potentials demonstrate a particularly good performance for the majority of the properties, except the bulk moduli derivatives ( and ΔB') and the transformation paths (ΔTP).
7. Conclusions
We performed extensive tests for the majority of the available Mo and Si potentials from the OpenKIM [10, 21] and NIST [11] repositories by comparing properties of different types: energy–volume curves, equilibrium bulk modulus, elastic constants, phonon spectrum and density of states, vacancy formation energies, transformation paths, surface energies and thermodynamic properties in the QHA and volume thermal expansion from MD simulations. Our assessment includes properties of the ground-state structure as well as for a set of prototype crystal structures of group A of the Strukturbericht designation. In addition, in order to increase the coverage of atomic environments, we considered several hundred random structures with one or two atoms in the unit cell.
We focus our analysis on DFT-reference data and introduce three validation levels for qualitatively structuring the assessment and data based on the complexity of the calculated properties, starting from raw energies and forces (level I) to basic material properties (level II) to complex application-related properties and structures (level III). While the first two levels allow for a direct comparison to DFT reference data, the latter one is often hardly accessible by ab initio calculations.
We considered different property–property pairs and identified correlations in the DFT reference data over different structural prototypes. We demonstrate that many interatomic potentials fail to reproduce the correlations in the DFT data. Thereby, property–property correlations may be considered as a test of the transferability and physical consistency of the potential without a direct comparison to reference data.
We assessed the transferability of interatomic potentials by considering a weighted average of property prediction deviation and identified two typical cases of this characteristic: higher accuracy at the expense of lower transferability versus lower accuracy but higher transferability. We found that potentials that were fitted to MD trajectories of liquid and ground states (by using the force-matching method) have better transferability.
The present approach for the potential validation by exhaustive comparison over a wide range of properties and structures can be extended to systems with increased complexity like compounds or magnetism. The decoration of lattice sites with chemical species or atomic spin directions requires extensions to our framework but does not pose a conceptual barrier.
Finally, all potentials have a limited transferability and therefore it is essential to assess the properties of a potential carefully before its application in a specific simulation.
Acknowledgments
The authors acknowledge financial support by the German Research Foundation (DFG) through projects 405621217 and 405602047. Jan Janssen and Jörg Neugebauer acknowledge the Max-Planck Research network on 'Big-data-driven Material science' (BigMax) for financial support to extend the high throughput capabilities of pyiron.
Appendix A. List of prototype structures
Table A1. List of considered prototypes from Strukturbericht A group [57].
| Strukturbericht notation | Prototype structure |
|---|---|
| A1 | Cu-fcc |
| A2 | W-bcc |
| A3 | Mg-hcp |
| A3' | α-La-dhcp |
| A4 | C-diamond |
| A5 | β-Sn white tin |
| A6 | In-fct |
| A7 | α-As |
| A8 | γ-Se |
| A9 | C-Graphite |
| A10 | α-Hg rhombohedral |
| A11 | α-Ga |
| A12 | α-Mn |
| A13 | β-Mn |
| A14 | I2 |
| A15 | Cr3Si |
| A17 | P-black phosphorus |
| A20 | α-U |
| Aa | α-Pa-bct |
| Ab | β-U |
| Ac | α-Np |
| Ad | β-Np |
| Af | γ-HgSn6-10 simple hexagonal |
| Ah | α-Po |
| Ai | β-Po (simple cubic) |
| C19 | α-Sm |
Appendix B. Deviation distributions for one- and two-atoms random structures of Mo and Si
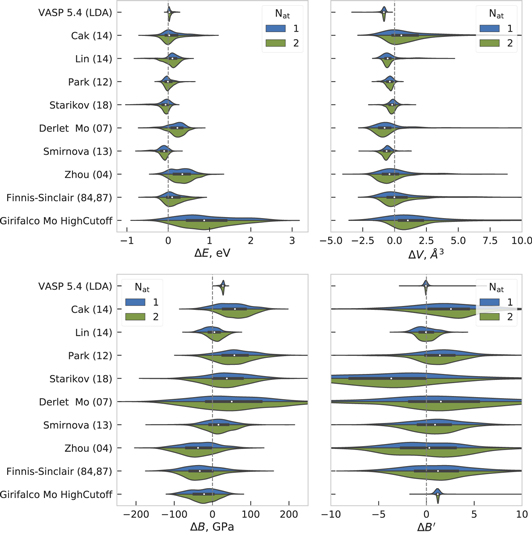
Figure B1. Deviation for equilibrium energy ΔE, volume ΔV, bulk modulus ΔB and ΔB' with respect to GGA-PBE as calculated by interatomic potentials and LDA for one- and two-atom Mo random structures.
Download figure:
Standard image High-resolution image
Figure B2. Deviation for equilibrium energy ΔE, volume ΔV, bulk modulus ΔB and ΔB' with respect to GGA-PBE as calculated by interatomic potentials and LDA for one- and two-atoms Si random structures.
Download figure:
Standard image High-resolution image