

Abstract
Bulk metallic glasses (BMGs) are a new class of engineering materials having strengths as high as 10 times that of conventional steels, but show no significant plastic strain at fracture. By introducing pores, their strain to failure has been shown to improve under uniaxial compression. In this work, three-dimensional finite element simulations of uniaxial compression are carried out on Pd-based porous BMGs having a wide range of pore volume fraction (1.9%–60%) with emphasis on understanding the underlying deformation and failure mechanisms. The resulting stress–strain curves agree reasonably well with existing experimental results. The simulations clearly bring out different failure mechanisms in low porosity BMGs and high porosity BMG foams. For low porosity BMGs (below 20%), the deformation and failure involves nucleation of shear bands around the pore diameter, linking of the shear bands with adjacent pores finally leading to initiation of ductile cracking within the shear bands. For high porosity BMG foams, the mechanism of deformation involves reduction in porosity of the material, self-contact of the pores, and their collapse on themselves causing densification of the material leading to apparent hardening in the stress strain behavior. The effect of pore geometry is also studied by considering ellipsoidal pores of volume fraction 3% and 11%. For ellipsoidal pores, the failure mechanisms are found to differ significantly when the orientation of the major axis of the pore vis-a-vis the loading axis is changed.
Export citation and abstract BibTeX RIS
1. Introduction
Bulk metallic glasses (BMGs) are amorphous alloys with an excellent suite of properties such as high strength, large elastic strain, corrosion resistance, high fatigue and fracture toughness [1]. This makes BMGs suitable for deployment in many applications [2]. Upon loading uniaxially beyond their yield point, most BMGs fail catastrophically, displaying very little plastic strain [1]. This limits the use of BMGs in load bearing applications. Understanding failure mechanisms and developing methods to improve their properties has been of significant interest to researchers [3–7]. Monolithic BMG specimens processed by cold rolling or bending and those with low aspect ratio exhibit malleability during compression [3]. Laminated BMG composites [6–9] resist shear band propagation by developing multiple shear bands. Another approach proposed to distribute shear bands throughout a larger volume of material is by considering the effect of elastic constants (such as Poisson's ratio ν) on fracture [5, 10, 11]. Also, by varying the composition of the alloy, it is possible to achieve metallic glasses with better properties [5]. However, the efficiency of these methods in improving the ductility of BMGs is limited.
An efficient method to improve the ductility and crack propagation toughness of BMGs is introduction of a secondary phase, thus, developing metallic glass matrix composites (MGMCs). Some of the popular strategies in the development of MGMCs are introducing reinforcements in the form of particles or fibers in the BMG matrix leading to the so-called 'ex-situ BMG composites' [12]. These secondary reinforcements restrict the formation of a single dominant shear band. On the other hand, 'in situ BMG composites' are synthesized by allowing a secondary crystalline dendrite phase to form within the matrix leading to the formation of multiple shear bands upon loading [13]. However, tailoring dendrite geometry to specific requirements poses a limitation on their implementation. An alternate strategy to improving strain to failure in compression of BMGs is introduction of voids or pores in the amorphous matrix leading to the so-called 'porous BMGs'. While monolithic BMGs exhibit almost zero plastic strain under uniaxial compression, porous BMGs with porosity of 5.7% show plastic strain of 18% and large energy absorption capacity without affecting their yield strength significantly [14]. However, their mechanics and mechanisms of deformation and failure are not understood clearly.
The objective of the present work is to model and simulate the compressive mechanical behavior of porous BMGs employing the finite element method within the three-dimensional framework. The goal is to investigate the underlying deformation and failure mechanisms in porous BMGs from the computational results and make connections with experimental observations reported in literature. The idea is to develop a better understanding of the reasons why porous BMGs exhibit greater failure strain under compression with very little loss of strength.
Experimental investigations on porous BMGs and BMG foams show significant improvement in strain to failure [4, 15, 16]. For low porosity BMGs, multiple shear band initiation at pores leads to spread of plastic strain over a larger volume [14]. Sarac et al [17] investigated the influence of pore sizes, spacing, configuration and porosities of porous BMGs using representative volume method to study their in-plane compression and tension behavior. Their experimental model involved pores that were arranged in a periodic manner. They concluded that multiple parameters with respect to pore geometry influence the mechanical behavior and their design technique can be used for macro-scale applications. Sarac et al [18] conducted a design optimization study for the arrangement of pores within the material and observed that low porosity BMGs exhibit enhanced ductility compared to their high porosity counterparts. This could also be extended to BMG foams and composites. Motivated by combined properties exhibited by crystalline foams and BMGs, Schroers et al [19] synthesized the first commercial metallic foam. Conner et al [20] reported high bending ductility exhibited by thin amorphous metal foils and wires. This is similar to the bending ductility shown by the thin membranes within the BMG foams [21]. Brothers and Dunand [22] found that BMG foams show very high plastic strains up to 50% without failure. In the uniaxial compression experiments conducted by Wada et al [21], BMG foams show large strain to failure due to high bending plasticity of the thin ligaments as well as apparent strain hardening due to densification phenomenon of the material under compression.
In order to investigate the mechanisms of deformation of a porous material under different loading conditions, several authors have resorted to unit cell methods. The work of Koplik and Needleman [23] involved analysis of a unit cell for a porous polycrystalline elastoplastic material under different states of stress triaxiality. This is comparable with Gurson's constitutive model which involves yield criteria and flow rule for porous ductile materials [24]. However, their unit cell model also accounts for the void interaction effects and shape changes. Smelser and Becker [25] implemented an ABAQUS UEL subroutine, to apply triaxial stress state in a unit cell model for a deforming two-phase material.
In the present study, porous BMGs are analyzed using the unit cell approach. The major assumption in this approach is that the distribution of pores within the material is homogeneous. This is a reasonable assumption referring to the work of Wada and co-workers [14], where the cross section of a porous Pd-based BMG shows a uniform distribution of pores within the matrix material. The major findings from the present work are the mechanisms of deformation and failure in porous BMGs having pores of different sizes and shapes. Low porosity BMGs fail by the nucleation of cracks inside shear bands around the pores. The mechanisms of deformation and failure of the high porosity BMG foams involve self-contact and compaction of the pores under compression, leading to densification of the material and thus resulting in apparent strain hardening of the high porosity BMG foams. Failure of BMGs containing ellipsoidal pores loaded in a direction perpendicular to major axis is similar to that of high porosity BMG foams, but, when loaded parallel to the major axis, these fail like monolithic BMGs. The simulated stress–strain curves are found to be in reasonable agreement with the existing experimental results for a wide range of void volume fraction (or porosity, f).
The paper is organized as follows. In section 2, the constitutive model for BMGs proposed by Anand and Su, [26] is briefly outlined. This model has been shown to capture the key features of plastic deformation of BMGs, such as strain softening, plastic dilatation and shear band patterns underneath an indenter, with good accuracy. A ductile damage law is also incorporated in this material model. The methodology adopted in this work is presented in section 3. The results of numerical simulations in terms of compressive stress–strain curves of low porosity BMGs, high porosity BMG foams and BMGs with ellipsoidal pores are reported in section 4. Section 5 involves a discussion on the obtained numerical results elucidating the compressive deformation and failure mechanisms of BMGs with spherical and ellipsoidal pores. Lastly, the paper is concluded by summarizing key conclusions from the present work in section 6.
2. Constitutive model
Anand and Su [26] proposed a constitutive model for elastic-viscoplastic response of pressure sensitive, plastically dilatant, isotropic amorphous materials. The constitutive equations have been reformulated and implemented using an implicit numerical integration scheme by Tandaiya and co-workers [27]. This section briefly describes the equations presented in the work of Tandaiya et al [27], which are used in the analyses. In addition, a damage model has also been implemented in order to capture the full stress–strain curve.
2.1. Kinematics
The major kinematic idea of the constitutive theory is the multiplicative decomposition of deformation gradient into elastic and plastic parts.

where,  is the deformation gradient. The spatial velocity gradient is

where,  ,
,  ,
,  .
.
The plastic volumetric strain is defined by

where,  .
.
The free energy function is

which also satisfies the relation

where,  , the elastic left Cauchy–Green deformation tensor, in order to meet the requirements of isotropy and objectivity. Since
  can be expressed in terms of elastic principal stretches
  , A ∈
, A ∈  ,
,

2.2. Constitutive relations
Dissipation per unit reference volume is given in terms of Kirchhoff stress  and rate of deformation tensor '
 ' [28] as

The above equation can be simplified [28] to get the constitutive relation after applying the Coleman–Noll argument [28]

Then, the expression for dissipation can be rewritten as

where,  and
and  , is the 'stress-like' internal variable called cohesion.
2.3. Elastic part of the constitutive equations
The spectral decomposition of  can be expressed as

where,  , A ∈
, A ∈  are the principal Kirchhoff stresses and
  are the eigenvectors of
  . From equations (6) and (8),

where,  for A ∈
  are the principal logarithmic elastic stretches given by

The relationship between  and
and  is taken to be governed by the isotropic Hooke's Law [29].
2.4. Plastic part of the constitutive equations
The flow rule corresponding to the plastic part is given as

where, β is the dilatancy function,  and
and  are the slip direction and the unit slip plane normal vectors, respectively, defined with respect to the principal directions of stress, and
  is the plastic shearing rate for the αth slip system.
The shearing rate is defined by the viscoplastic law as

where,  is a reference plastic shear strain rate.
  and
and  are shear and compressive normal tractions on the αth slip system and c is cohesion, defined as the yield strength in pure shear. μ is a material parameter defined as internal friction and when
  ,
,  for
for  m being the strain rate sensitivity parameter. The dilatancy function β and cohesion c, are assumed to be exponential functions of plastic volumetric strain η as


As the volumetric strain increases from η to a saturation value  , β varies smoothly from g0 to 0 and c from c0 to ccv, where initial cohesion
  .
.
The above constitutive model is numerically implemented in a thoroughly tested and benchmarked user-subroutine UMAT in a commercial finite element software ABAQUS [27] using a fully implicit backward-Euler update algorithm.
2.5. Damage model
The complete stress–strain curve till final failure is simulated by adopting the damage model proposed by Anand and Su [26], described as follows.
The equivalent plastic shear strain rate  is defined as

where,  is the deviatoric part of plastic part of
  . Thus, equivalent plastic shear strain
  is defined as

A damage variable d is defined as

such that d = 0 for  less than a critical value of plastic shear strain
  and d = 1 as
  evolves to failure value
  . After damage initiation, the cohesion c evolves linearly with the damage variable d and decays to zero as d increases to unity. An integration point is removed from calculation when the damage variable d at that point exceeds a critical value of 0.97. When all the integration points in an element are removed from calculation, the element is deleted from analysis. This signifies development of a crack in the section.
The above damage model along with the constitutive model presented earlier are again numerically implemented in ABAQUS/Explicit by writing another user material subroutine VUMAT. It should be noted that the above damage model represents the mechanism of ductile fracture of BMGs involving development of ductile shear cracks inside shear bands. All the simulations reported in the present work are carried out using ABAQUS/Explicit.
Thamburaja [30] proposed a non-local, finite deformation constitutive model for metallic glasses which includes mechanisms such as non-local interaction stress and free volume diffusion. Through finite element simulations, he showed that metallic glasses exhibit delayed shear localization or homogeneous deformation in sub-micron or nano-sized samples. Indeed, in the experiments of Jang and Greer [31] and Jang et al [32], the various size dependent phenomena in metallic glasses such as increase in yield strength with decrease in sample size are observed at length scales less than or equal to 1 μm. However, the present work attempts to capture the uniaxial compression behavior of porous BMGs containing pores having diameters ranging from 9 to 35 μm (see Wada et al [14, 21]). Thus, at such bigger length scales, mechanisms such as non-local interaction stress and free volume diffusion will have only negligible effect on the overall deformation behavior of the samples. Hence, in the present work, a local constitutive model proposed by Anand and Su [26] has been employed which is appropriate for the bigger length scales over which the present simulations have been carried out.
3. Methodology
In this work, unit cell analyses are carried out by assuming that pores are distributed uniformly in the material. Porosity or current void volume fraction is defined as the ratio of the current volume of spherical or ellipsoidal pore to the current volume of the entire unit cell. Based on the initial porosity being smaller than or equal to 20% and greater than 20%, two types of simulation models are employed as shown in figures 1(a) and (b), respectively. Throughout the deformation, the walls of the unit cells remain straight and free of shear traction in order to maintain compatibility between adjacent unit cells. Hence, owing to the resultant symmetry, only 1/8th of the unit cell is modeled with finite elements for porosities less than or equal to 20% and 1/4th for porosities greater than 20% as shown in figure 1.
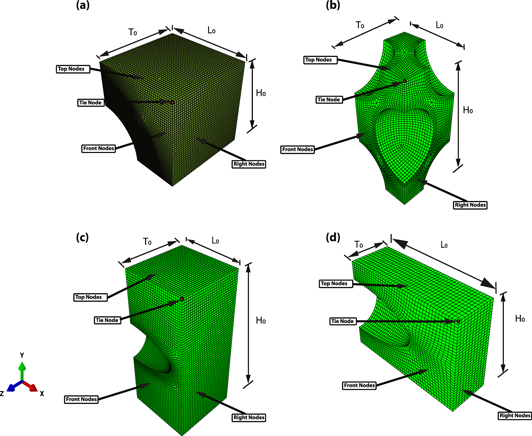
Figure 1. Finite element simulation models of unit cells having initial porosities (a)  20% (spherical pore), (b) f > 20% (spherical pore), (c) f = 3% (ellipsoidal pore) and (d) f = 11% (ellipsoidal pore).
Download figure:
Standard image High-resolution imageFor 1/8th simulation model of the unit cell, the aspect ratio of the model is  in the X–Y plane and
  in the X–Z plane, where
  and
and  correspond to length, height and thickness of the cubic unit cell, respectively. For 1/4th simulation model of the unit cell, aspect ratio of the model is
  in the X–Y plane and
  in the X–Z plane, where
  and
and  correspond to length, height and thickness of the cubic unit cell, respectively.
In order to study the effect of geometry of pore on the compressive behavior, two additional unit cells with ellipsoidal pores are considered (see figures 1(c) and (d)). These simulation models are again 1/4th of the entire unit cell and correspond to initial porosities of 3% and 11%. The aspect ratio of the ellipsoidal pore is 3:1:1 in both the cases. Thus, the aspect ratio of simulation model for porosity 3% is  in the X–Y plane and
  in the X–Z plane. For 11% porosity,
  in the X–Y plane and
  in the X–Z plane. In both the cases,
  and
and  correspond to the length, height and thickness of the unit cell, respectively. These simulation models are meshed with ABAQUS C3D8 hexahedral finite elements with the number of elements in the mesh increasing with decreasing porosity. Thus, for 5.7% porosity, the number of elements is 1 144 000, while for 60% porosity, there are 16 480 elements. Load is applied by prescribing displacements to the top nodes corresponding to a strain rate of 10−3 s−1, while to the nodes on the other three faces (bottom, back-left and back-right) of the simulation model, symmetry boundary conditions are applied. Orthogonal boundary conditions are imposed by tying the Z-displacement of the front face nodes and the X-displacement of the right face nodes to the Z and X-displacements of the tie node (see figure 1). These boundary conditions ensure that the faces of the unit cell remain straight thereby ensuring compatibility with adjacent unit cells. These flat/straight boundary conditions on the unit cell boundaries are used in the present study following the work of Koplik and Needleman [23] and Hom and McMeeking [33]. Flat boundary conditions are a simple and effective way of enforcing compatibility between adjacent unit cells and require less computational effort. Also, symmetry in the unit cell can be exploited to reduce the problem size and thereby save computational cost. An alternative choice is the use of periodic boundary conditions (PBCs). This requires modeling the full unit cell and enforcing constraint equations connecting the displacements of pairs of points on opposing faces of the unit cell (see, for example, Wienecke et al [34]). It is believed that PBCs may be more flexible to accommodate shear bands. In the present work, use of PBCs on the full unit cells with mesh architectures and element densities as shown in figure 1, require solving tens of thousands of linear constraint equations in Abaqus/Explicit at every time increment. The computational cost of these analyses for PBCs becomes prohibitively expensive. Hence, in this work flat boundary conditions are employed in all the simulations.
Following the experiments of Wada et al [14, 21], unit cells of  containing spherical pores of porosities of f = 1.9%, 3.6%, 5.7%, 20%, 41%, 60%, and ellipsoidal pores of porosities 3% and 11% are modeled. The material properties and parameters used in the analyses are listed in table 1.
Table 1. Material properties of Pd-based BMG used in the simulations.
| Property | Value | Reference |
|---|---|---|
| E | 104 000 MPa | [14] |
| ν | 0.41 | [35] |

|
0.001 | [26] |
| g0(in tension) | 0.4 | [26] |
| g0(in compression) | 0.04 | [26] |
| m | 0.005 | [26] |

|
0.005 | [26] |
| μ | 0.08 | Present simulation |
| b | 0 | Present simulation |
| c0 | 780 MPa | Present simulation |
| ccv | 780 MPa | Present simulation |

|
3.5 | Present simulation |

|
4 | Present simulation |
The values of elastic parameters 'E' and 'ν' for Pd-based BMG are taken from literature [14, 35]. The value of viscoplasticity parameter ( ) which is a reference shearing rate is taken as 0.001 as in Anand and Su (2005) [26]. Since, at room temperature the response of Pd-based BMG is almost rate-insensitive, the value of rate sensitivity parameter m is chosen to be a small number 0.005 as in Anand and Su (2005) [26]. The initial rate of dilatation g0 is taken to be 0.04 in compression and 0.4 in tension as in Anand and Su (2005) [26]. The maximum value of dilatation in fully developed shear bands
  is taken to be 0.005 as in Anand and Su (2005) [26]. The values of 'μ', 'c0', 'b', 'ccv', '
 ' and '
 ' have been determined in the present simulations by fitting the values to the measured constitutive behavior of Pd-based BMG reported in literature [14].
The constitutive model works very well in various loading situations. In particular, it has been shown to accurately represent the overall features such as load versus displacement response, as well as details of shear band formation during the deformation of metallic glasses in a variety of situations such as indentation, strip bending and fracture loading. See, for example, Anand and Su (2005) [26], Su and Anand (2006) [36], Tandaiya et al (2007, 2008, 2009, 2010) [27, 37–39]. This demonstrates the stability of the model.
For the model with ellipsoidal pores, the orientation of the major axis of the pore with respect to the loading direction also plays a significant role [21]. Thus, the material can be compressed along a direction perpendicular to the major axis (N-sample) or parallel to it (P-sample). This is also considered while applying the boundary conditions.
Although there exists an additional plane of symmetry in the simulation models shown in figures 1(b)–(d) pertaining to high porosity BMG foams and BMGs with ellipsoidal pores, instead of 1/8th of the unit cell, 1/4th of the unit cell is modeled in order to account for the likelihood of self contact of the pore walls at the symmetry plane at large compressive strains. This is addressed by incorporating a general contact algorithm in the simulations. By contrast, the low porosity BMGs fail before the pore wall crosses over the symmetry plane and thus these cases require modeling only 1/8th of the unit cell.
4. Results
In this section, the results from three-dimensional finite element simulations of uniaxial compression of low porosity BMGs, high porosity BMG foams and BMGs with ellipsoidal pores are presented.
4.1. Uniaxial compression simulation of low porosity BMGs
Uniaxial compression loading of low porosity (f = 1.9%, 3.6%, 5.7% and 20%) BMGs is simulated by the finite element method. The stress–strain curves obtained from the simulations in terms of macroscopic nominal stress versus macroscopic nominal strain are plotted in figure 2(a) for all the four low porosity cases. The stress–strain curves reported in Wada et al [14, 21] for the same porosities are also plotted in figure 2(a) for comparison purposes. The experimental stress–strain curve for the f = 5.7% porosity case was used to calibrate the material properties used in the present work. As expected, the simulated and experimental stress–strain curves for 5.7% porosity match very well with each other in terms of elastic modulus, yield strength, post yield response and failure strain. The simulated stress–strain curve for 3.6% and 20% porosity is also found to agree quite well with the corresponding experimental stress–strain curve (see figure 2(a)). This gives confidence in the calibrated material properties. However, the experimental stress–strain curve for 1.9% porosity case shows very little failure strain as compared to other low porosity BMGs. This is different from the trend of failure strain exhibited by 3.6% and 5.7% porosity cases. This discrepancy might have been caused by any defects present in the single sample of that porosity that was tested in [14]. Hence, the simulated stress–strain curve for 1.9% porosity case over-predicts the failure strain while the elastic modulus and yield strength are accurately captured.
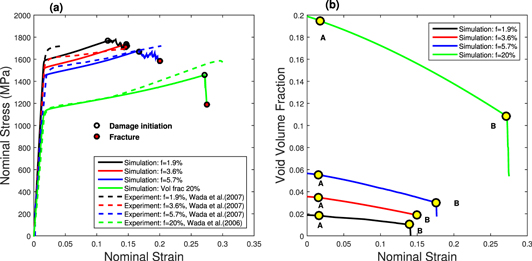
Figure 2. (a) Nominal stress versus nominal strain curves from simulations of uniaxial compression of unit cells of BMGs with spherical pores compared with experimental curves of Wada et al [14, 21] for initial porosities 1.9%, 3.6%, 5.7% and 20%; (b) Evolution of void volume fraction from simulations of low porosity BMG unit cells having initial porosities 1.9%, 3.6%, 5.7% and 20%.
Download figure:
Standard image High-resolution imageAccording to the present damage model, after damage initiation, the cohesion decreases linearly with the damage variable to zero causing strong softening in the response. While this softening due to damage may promote strain localization, it should be mentioned that in the constitutive model of Anand and Su [26], the plastic dilatation causes strain softening even before damage initiation. Furthermore, the use of Mohr–Coulomb type yield criterion and non-associated flow rule promotes strain localization inside shear bands irrespective of the damage model. The points delineating damage initiation and final fracture are indicated in figure 2(a). The softening in the damage model begins only after the damage initiation point marked on the curves.
The void volume fraction evolution of low porosity BMGs is also studied. Figure 2(b) shows the evolution of void volume fraction with respect to nominal strain obtained from the unit cell simulation study of low porosity BMGs. Points A and B in figure 2(b) indicate the void volume fraction at yield and failure points of the unit cell, respectively. At point A, the void volume fraction for the three simulations has reduced by 2% and at point B, the reduction in void volume fraction is by 45%. Consistency in the values of void volume fraction reduction at yielding and failure for all the three porosity cases, provides confidence in the simulation result for 1.9% porosity case.
The current model used follows a rate dependent viscoplastic law. Mesh size effects encountered in rate independent solids are not observed in rate dependent solids, as the boundary value problems remain well posed. It has been shown that, rate dependence introduces an artificial length scale into the boundary value problem irrespective of whether the constitutive model contains length scale parameter [40]. A mesh sensitivity study has been carried out for porous BMGs having f = 5.7%, through unit cell simulations. A coarse mesh model having 71 928 elements and fine mesh model having 114 000 elements are developed. The stress–strain curve obtained from the uniaxial compression of these unit cells match very well till damage initiation. The qualitative behavior post damage initiation is also found to be similar. This reveals that the overall behavior of the unit cell is independent of the mesh.
4.2. Uniaxial compression simulation of high porosity BMG foams
In the case of high porosity BMGs or 'BMG foams', the initial porosities are greater than 20%. Experiments of Wada and co-workers [21] show that the yield strength of BMG foams is much less than that of low porosity BMGs but they are more malleable and exhibit larger strain hardening. Figure 3(a) shows the simulated compressive stress–strain curves for BMG foams having porosities 41% and 60%. The experimental compressive stress–strain curves from Wada et al [21] for BMG foams having the same porosities are also presented in figure 3(a) for comparison purposes. It can be observed from this figure that the simulated stress–strain curves match reasonably accurately with the experimental stress–strain curves. In particular, the simulated and experimental curves match very well with each other till a nominal strain of 20%. Beyond 20% nominal strain, the simulated stress–strain curves capture the essential features of the experimental stress–strain curves such as apparent strain hardening very well, qualitatively.
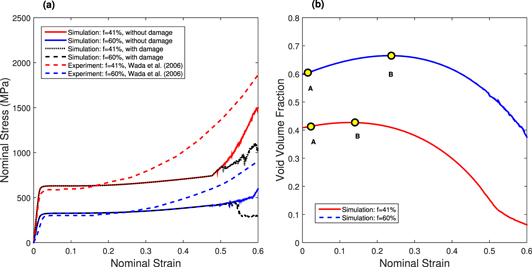
Figure 3. (a) Nominal stress versus nominal strain curves from simulations of uniaxial compression of unit cells of BMG foams containing spherical pores compared with experiments of Wada et al [21] for initial porosities 41% and 60%. (b) Evolution of void volume fraction with nominal strain from simulations of unit cells of BMG foams with initial porosity 41% and 60%.
Download figure:
Standard image High-resolution imageIt should be noted that in the experiments of Wada et al [21], the high porosity BMG foams do not fail until a very large compressive strain. This is because the thin walls separating the cells in the BMG foam become plastic and there is hardly any formation of a dominant shear band. The damage model implemented in the present work is meant to simulate ductile shear cracking inside a dominant shear band. Thus, the present damage model is not applicable to BMG foams. Hence, in the simulations of uniaxial compression of BMG foams, the damage model is not employed. The mechanism of deformation of BMG foams will be discussed in detail in the next section.
Figure 3(b) shows the evolution of void volume fraction of BMG foams having porosity 41% and 60%. The void volume fraction evolution for BMG foams having initial porosities 41% and 60% are significantly different from that of low porosity BMGs. It is seen from figure 3(b) that the current void volume fraction first increases steadily till point B before it begins to drop smoothly. Point A indicates the void volume fraction at yield point. The percentage increase in peak void volume fraction rises with inital porosity, i.e., while void volume fraction at point B, for 41% inital porosity case rises by 4.45%, that for 60% initial porosity case rises by 11.11%. It should be noted that the current void volume actually decreases with applied nominal strain but the current unit cell volume decreases at a faster rate than that of the void volume. Thus, the net effect is slight increase in the void volume fraction up to point B. The void volume fraction beyond point B decreases with applied nominal strain.
The material parameter values used to simulate porous  BMG in the present work are obtained from literature. The influence of key material parameters on the mechanical response of porous BMGs in general is under investigation and will be reported in our forthcoming publication. However, a preliminary study of the effect of varying Mohr–Coulomb friction parameter μ on the compressive response of porous BMGs has been conducted. This study suggests that decrease in μ lowers the stress–strain curve while the hardening and strain to failure remain more or less unaffected.
In the work of Wei and co-workers [41], it was found that Poisson's ratio plays an important role in plastic deformation of thin plates. Thus, it was expected that in the present context of porous BMGs, especially in high porosity BMG foams, Poisson's ratio might play a role in the plastic deformation when the thin pore walls are subjected to bending. In order to investigate this issue, a preliminary study of effect of Poisson's ratio on the response of porous BMGs was conducted. In this study, uniaxial compression simulations were conducted using three different values (0.36, 0.41 and 0.43) of Poisson's ratio for unit cells having low (f = 1.9%) and high (f = 60%) porosities. It was found that Poisson's ratio does not influence the nominal stress–strain curves for both low and high porosity BMGs.
4.2.1. Suitability of the damage model for high porosity BMG foams
The damage model used in the present work is quite primitive, linear, local model. In order to assess the suitability of the present damage model for predicting deformation and failure of high porosity BMG foams, simulations of uniaxial compression of high porosity BMG foams (f = 41% and 60%) using the present damage model are conducted. The resulting stress–strain curves (included in figure 3(a)) are compared with the cases when the damage model is not employed. It can be observed from figure 3(a) that the use of present damage model leads to prediction of lower failure strain than observed in the experiments. While the experimental stress–strain curves show no signs of damage upto strain of 60%, the simulated stress–strain curves using the present damage model begin to show failure at strains much lesser than 60%. Also, the simulated stress–strain curves deviate further away from the experimental ones. It can be concluded from this study that since the experimental failure mechanisms are different in low and high porosity BMGs, the simple damage model used in the present work does not capture the failure of high porosity BMG foams. More work is required in future to develop a general damage model that works accurately for both low and high porosity BMGs.
4.3. Uniaxial compression simulation of BMGs with ellipsoidal pores
Experiments have shown that the geometry and orientation of pore also play a significant role in influencing the mechanical behavior of porous BMGs [21]. As observed in experiments, BMGs with ellipsoidal pores having porosity 3% show higher plastic strain to failure than BMGs with spherical pores of 3.6% porosity without compromising the strength [21]. It is also seen that the stress–strain curves of BMGs with ellipsoidal pores depend on the orientation of the major axis of the ellipsoidal pore, vis-a-vis the loading direction. Unit cells containing ellipsoidal pores with initial porosities 3% and 11% are analyzed for two different orientations (N-sample and P-sample) and compared with the experimental results [21]. In the case of N-sample, the direction of loading is perpendicular to the major axis and for P-sample, the direction of loading is parallel to the major axis of the ellipsoidal pore. Figures 4(a)–(d) show the comparison of the simulation results with experiments in terms of stress–strain curves. It can be noticed from figures 4(a) and (c), pertaining to the N-sample having 3% and 11% porosity, that the simulated stress–strain curves agree with the experimental stress–strain curves qualitatively well. In particular, the elastic modulus, yield point and failure strain for 3% porosity case is well predicted by the simulations. The post yield hardening behavior seen in the experimental stress–strain curves of both 3% and 11% porosity cases is also captured in the simulations. Thus, with respect to apparent hardening, the N-samples behave similar to that of BMG foams even though the porosity of N-samples is lesser.

Figure 4. Nominal stress versus nominal strain curves compared with experimental stress–strain curves from [21] for BMGs with ellipsoidal pores oriented along different directions with respect to the loading direction. (a) f = 3% N-sample, (b) f = 3% P-sample, (c) f = 11% N-sample and (d) f = 11% P-sample.
Download figure:
Standard image High-resolution imageThe elastic modulus and yield point are accurately captured in the simulated stress–strain curves for the P-sample for both 3% and 11% initial porosities (see figures 4(b) and (d)). However, the P-samples fail soon after reaching the yield point in experiments while the simulated stress–strain curves do not show failure for nominal strain as large as 20%. The reason for this discrepancy lies in the operative failure mechanism in the P-samples, which is different from that incorporated in the present simulations. This point will be further discussed in the next section.
5. Discussion
5.1. Mechanism of deformation and failure of BMGs with spherical pores
In this subsection, the mechanism of deformation and failure of BMGs with spherical pores is discussed. The present three-dimensional finite element simulations enable one to do this. For this purpose, the behavior of representative low porosity (5.7%) and high porosity (41%) BMGs are contrasted by examining their simulated stress–strain curves and associated contour plots showing the evolution of plastic strain within the simulation model.
Figure 5 shows the nominal compressive stress–strain curves for BMGs with initial porosities f = 5.7% (with damage) and 41% (with and without damage). In view of section 4.2.1, the response of high porosity BMG foam without damage will only be discussed in the following. It can be seen from figure 5, the high porosity BMG foam exhibits malleability with plastic strains as high as 60%, while the low porosity BMG fails at about 20% strain. The stress–strain curves in figure 5 are marked with salient points A–F. These points are associated with various events shown in figures 6 and 7 within the simulation models of their unit cells that are responsible for the respective mechanical behavior. Figures 6 and 7 display the contour plots of maximum principal logarithmic plastic strain  keyed to points A–F on the stress–strain curves in figure 5 for 5.7% and 41% porosity BMGs, respectively.
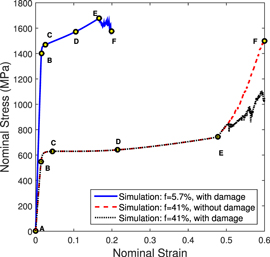
Figure 5. Nominal stress versus nominal strain curves of BMGs with spherical pores having initial porosities 5.7% and 41% obtained from simulations. The salient points A–F, marked on the curves signify the occurrence of a new event in the deformation history of the unit cell.
Download figure:
Standard image High-resolution image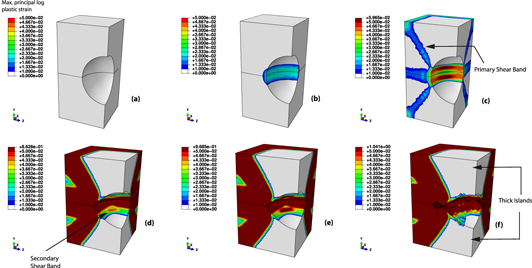
Figure 6. The evolution of maximum principal logarithmic plastic strain  from (a) elastic region to (f) final failure keyed to points A–H on the stress–strain curve of figure 5 for BMG unit cell with porosity 5.7%. The loading direction is along the Y-axis.
Download figure:
Standard image High-resolution image
Figure 7. The evolution of maximum principal logarithmic plastic strain  from (a) yield point to (f) pore collapse and densification of material, keyed to points A–H on the stress–strain curve in figure 5 for BMG unit cell with porosity 41%. The loading direction is along the Y-axis.
Download figure:
Standard image High-resolution imageFor the simulation model with initial porosity 5.7%, the deformation histories are shown on 1/4th of the unit cell in figure 6. From point A to B in figure 5, the material is loaded elastically and no plastic strain is accumulated in the model, as seen from figures 6(a) and 7(a), for low and high porosity BMGs respectively. On loading the material beyond point B, it starts yielding, which is marked by the accumulation of plastic strains at the horizontal diametral plane of the pore (see figures 6(b) and 7(b)). It should be noted that the 'thick islands' marked in figure 6 of the unit cell remain elastic throughout the entire deformation history for low porosity BMGs. As the load is increased up to point C, the plastic strain spreads along the four corners of the low porosity unit cell and thus develops into inclined 'primary shear bands' (see figure 6(c)). These inclined shear bands join the adjacent unit cells and form a criss-cross network of shear bands bridging the spherical pores in the material. This feature is similar to that observed in the scanning electron microscopy (SEM) image of a section across a porous BMG in figure 8(b). In the case of high porosity simulation model, the plastic strains spread along the 'thin ligaments' connecting the pores as shown in figure 7(c).

Figure 8. (a) Contour plot of maximum principal logarithmic plastic strain  from simulation showing a failed unit cell of BMG with spherical pore having initial porosity 5.7%. The loading direction is along the Y-axis. (b) Experimental SEM image of a 5.7% porosity BMG post failure showing a network of shear bands that originate at the pore diameters and cracking along the shear bands, reprinted from [14], Copyright (2007), with permission from Elsevier.
Download figure:
Standard image High-resolution imageFurther loading from point C to D leads to the intensification of plastic strain in the primary shear bands and thin ligaments for low and high porosity BMGs, respectively. Till this point, it is observed that the pore shape continues to be spherical in both the cases. At point D, a change in slope of the stress–strain response is observed. This is due to the nucleation of 'secondary shear bands' from the primary shear band at the pore for low porosity BMGs (see figure 6(d)) and intensification of plastic strains in the thin ligaments for high porosity BMGs (see figure 7(d)). For the low porosity BMG case, the figure 6(d) represents a stage between points D and E in the stress–strain curve, in order to get a better visualization of the secondary shear band. A note on the evolution of void volume fraction of BMG foams at this stage is pertinent here. It is observed that the current void volume fraction (see figure 3(b)) increases by 4.45% till point D, where the plastic strains increase in the thin ligaments. On loading beyond point D, the current void volume fraction begins to drop smoothly. As the loading is increased up to point E, localization of plastic strain in the secondary shear bands occurs for low porosity BMGs, while the plastic strain intensifies in the thin ligaments in high porosity BMGs. It is also noted that the pore shape is no longer spherical beyond point D.
After point E, the primary and secondary shear bands merge for low porosity BMGs as seen in figure 6(e). The change in slope from CD to DE in the stress–strain curve in figure 5 is about 22% for low porosity unit cell, which is much less compared to that for high porosity unit cell (∼82%). The low porosity unit cell does not take further load and begins to fail from the center of the void along the shear band (see figure 6(f)). Thus, the mechanism of failure of low porosity BMG involves formation of ductile shear cracks inside inclined dominant shear bands originating at the diameter of the spherical pore. For high porosity BMG foam, owing to the large bending plasticity of the thin ligaments, the material does not fail on loading beyond point E. But, the pore begins to collapse on itself leading to densification of the material (see figure 7(e)). This is indicated by a dramatic change in the slope at point E, for high porosity BMG foam in figure 5. Further loading of high porosity BMG leads to the yielding of the thick islands as seen in figure 7(f). Thus, the mechanism of deformation of high porosity BMG foams involves plastification of thin ligaments connecting the adjacent pores, collapse of the pores on themselves leading to self-contact and densification of the material. This causes the rapid apparent strain hardening observed in the stress–strain curves of porous BMG foams.
Comparing the 41% porosity unit cell simulation model results with the corresponding experiment, the events starting with the intensification of plastic strains in the thin ligaments denoted by points D and E in figure 5 (41% porosity) occur at strains of about 0.21 and 0.48, as compared to 0.12 and 0.26 in the experiment [21]. The early occurrence of events in the experiment as compared to the simulation may be due to non-regular arrangement of pores in actual material as compared to the uniform distribution of pores assumed in the present simulations.
Figure 8 compares the failed sample of porosity 5.7% obtained from the simulation with the experimental SEM image of the failed sample having the same porosity, reported in literature [14]. Figure 8(a) shows the contour plot of maximum principal logarithmic plastic strain ( ) at failure corresponding to unit cell with porosity 5.7%. It is observed that the material starts to fail from the void diameter, which agrees with the SEM image of the failed sample [14], shown in figure 8(b).
In the present work, the effect of pore distribution has not been studied because of the use of unit cell approach. This is a limitation of the present work. Future works can study this effect by making use of a representative volume element containing a distribution of pores and PBCs.
5.2. Mechanism of deformation and failure of BMGs with ellipsoidal pores
Figure 9 shows the simulated stress–strain curves of N- and P-samples containing ellipsoidal pores and having a porosity of 11%. The salient events are marked by points A–D on the curves. The mechanism of deformation of both N- and P-samples vary significantly as seen from the failed samples in experiments reported in [21]. While the P-sample fails immediately after reaching the elastic limit, the N-sample of the same porosity shows substantial amount of plastic strain to failure. Figures 10(a)–(c) shows the contour plot of maximum principal logarithmic plastic strain  for porous BMG with ellipsoidal pores having initial porosity 11%. These figures display the evolution of plastic strain in the simulation cell from the onset of yielding to final failure for the N-sample. On examining the simulated stress–strain curve of the N-sample, it is seen that as the material is loaded up to elastic limit (point B), stress concentration occurs at the corner of the major diameter. This leads to accumulation of plastic strain at the major axis, which spreads along its diameter as shown in figure 10(a). At point B, it can also be seen from figure 10(a) that the plastic strain spreads from the major axis diameter to the corner of the unit cell. Further loading from point B to C, intensifies the plastic strain at these regions, forming a primary shear band and thus improving the malleability of the material. This is shown in figure 10(b). However, there are 'thick islands' which remain elastic at this point. When loaded beyond point C, the pore tends to collapse on itself, similar to the behavior described earlier for BMG foams, leading to densification of the material. This event is marked by a slope change at point C. The pore begins to collapse on itself starting from the corner of the major diameter and gradually moving towards the center of the ellipsoid (see figure 10(c)). Beyond point D, the material begins to fail at the central plane of the pore.
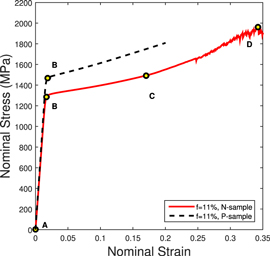
Figure 9. Nominal stress versus nominal strain curves for N- and P-samples of porous BMGs with ellipsoidal pores having porosity 11%. The salient points A–D, marked on the curve signifies the occurrence of a new event in the deformation history of the unit cell.
Download figure:
Standard image High-resolution image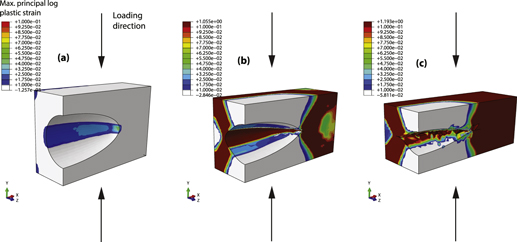
Figure 10. Contour plots of maximum principal logarithmic plastic strain  showing the evolution of plastic strain from (a) yield point to (c) final failure keyed to points B–D in figure 9 pertaining to stress–strain curve of the N-sample porous BMG with ellipsoidal pores having porosity 11%.
Download figure:
Standard image High-resolution imageReferring to the uniaxial compressive stress–strain curve in figure 4(c) pertaining to the N-sample, a discrepancy in the yield point is observed. The simulation for 11% porosity unit cell simulation model predicts a yield strength about 300 MPa higher than that of the experiment. Also, while failure in the experiment occurs at a strain of 0.26, simulation shows that failure occurs at a strain of 0.34. These discrepancies can be attributed to the fact that the pore distribution is assumed uniform in the present unit cell analysis, while in reality, they are randomly arranged within the matrix material. This leads to a change in the actual interaction between the pores.
Figure 11 shows the comparison of contour plots of  for the (a) 3% and (b) 11% porosity N-sample unit cell simulation models with that of the (c) experimental sample [21] at a nominal strain of 0.04. Both 3% and 11% samples show shear bands nucleating from the major axis and connecting the corners of the unit cell. Shear bands also connect the corner of minor axis diameter to the adjacent corners of the unit cell. These features are also observed in the experiments shown in figure 11(c).

Figure 11. Comparison of contour plots of  for N-sample porous BMG containing ellipsoidal pores of porosity (a) 3% and (b) 11% with (c) experimental observation from [21] at nominal strain of 0.04 (reproduced with permission from [21]). The figures show shear bands originating from major and minor diameters of the ellipsoidal pore.
Download figure:
Standard image High-resolution imageThe present damage model is unable to capture the failure point of the P-samples in the simulations. This is because the failure mechanisms of P-samples and other unit cell simulation models differ significantly. This is explained with reference to figure 12. Figures 12(a) and (b) show the contour plots of  for P-sample porous BMGs containing ellipsoidal pores of porosities 3% and 11%, respectively, at yield strain which corresponds to the failure point in the experiments. Figure 12(c) shows the SEM image of P-sample porous BMG with ellipsoidal pore after fracture, reproduced from the work of Wada et al [21]. It can be seen from figures 12(a) and (b) that the plastic strains are distributed homogeneously within the simulation model. Unlike the case of N-sample where shear bands emanating from the pore are observed (see figure 11(c)), no shear bands are observed around the pore in the P-sample (see figure 12(c)) and it fails immediately after the elastic limit in the experiments. Thus, in the case of P-sample, the ellipsoidal pore does not lead to nucleation and proliferation of shear bands in the simulation model of the unit cell. A limitation of the present work is that the failure point in the experimental stress–strain curves of the P-sample porous BMGs is not captured in the current simulations. This is because the P-samples seem to fail at yield point perhaps due to formation of a single dominant shear band in the whole specimen which cannot be predicted from unit cell approach. More experiments on P-samples are required to understand their failure.
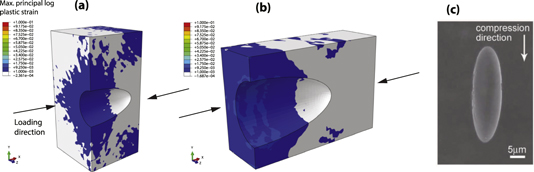
Figure 12. Comparison of contour plots of  for P-sample porous BMG containing ellipsoidal pores of porosity (a) 3% and (b) 11% at yield point, with (c) experimental observation from [21] at failure (reproduced with permission from [21]).
Download figure:
Standard image High-resolution image6. Summary and conclusions
In summary, the present work deals with the three-dimensional finite element simulation of deformation and failure of porous BMGs. The simulations employ a realistic finite strain constitutive model for BMGs proposed by Anand and Su [26] coupled with a ductile damage model to simulate failure. Complete stress–strain curves are obtained for porous Pd-based BMGs for a wide range of porosities, under uniaxial compression from simulations and are found to be in reasonable agreement with experimental results available in literature. The simulated stress–strain curves accurately capture the initial elastic stiffness, yield point, hardening and failure. The mechanisms of deformation and failure of BMGs with spherical and ellipsoidal pores are elucidated. The major conclusions from the present work are summarized below.
- (i)While, for monolithic BMGs, failure under uniaxial compression is triggered by the formation of a single dominant shear band [26], the present analysis reveals two distinct mechanisms of failure for porous BMGs having low and high porosity.
- (ii)For low porosity BMGs, the mechanism of deformation and failure involves nucleation of shear bands around the pore diameter, linking of the shear bands with adjacent pores finally leading to initiation of ductile cracking within the shear bands.
- (iii)For high porosity BMG foams, the mechanism of deformation involves reduction in porosity of the material, self contact of the pores, and their collapse on themselves causing densification of the material leading to apparent hardening in the stress–strain behavior.
- (iv)Porous BMGs with ellipsoidal pores having porosities 3% and 11% are also analyzed under two different orientations of the pore major axis with respect to the loading axis. The formation of criss-crossed network of shear bands around the pore for the N-sample models is observed, whereas, the P-sample model shows more or less a uniform distribution of plastic strain around the pore at yield point. The stress–strain response of the N-sample porous BMGs is qualitatively captured in the simulations. Due to difference in operative failure mechanism of N and P-sample models, a more general unified damage model is required to capture the failure of P-sample models.
From the present work, it is understood that failure of porous BMGs under uniaxial compression is through ductile shear cracking within a dominant inclined shear band. However, the possibility of failure mechanisms such as cavitation [42] need to be explored when the material is subjected to different loading states of high stress triaxiality. This shall be examined in our forthcoming work.
In closing, it must be mentioned that introducing pores in amorphous alloys is a good strategy for improving the plastic strain to failure under compression of BMGs. Introduction of porosity suppresses the catastrophic failure observed in monolithic BMGs under compression. In particular, plastic strain as high as 18% is attained in low porosity BMGs without much loss of yield strength. Thus, low porosity BMGs are suitable candidates for high compressive energy absorption applications. Likewise, high porosity BMG foams exhibit exceptional plastic strain under compression but with some loss in yield strength. These could also be employed in impact energy absorption applications.
Acknowledgments
The authors thankfully acknowledge useful discussions with Tanmay K Bhandakkar.
Appendix A
It may be pertinent to examine how plasticity and failure spread in the unit cell as the deformation proceeds. For this purpose, the evolution of volume fraction of yielded and failed elements with nominal strain is extracted from the simulation results. Figure A1(a) shows the volume fraction of yielded elements obtained from the unit cell simulations having porosities f = 1.9%, 3.6%, 5.7%, 20%, 41% and 60%. In the elastic region, the volume fraction of yielded elements is zero, as expected. When the loading reaches the macroscopic yield point of the unit cell (denoted by point 'A' in figure A1(a)), the volume fraction of yielded elements begin to rise gradually. As the material begins to strain harden, more elements yield and this results in further increase of the volume fraction but at a lower rate. Beyond the point 'B' in figure A1(a), the evolution of volume fraction of yielded elements more or less saturates.
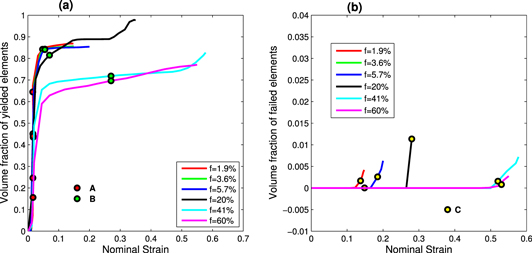
Figure A1. (a) Volume fraction of yielded elements and (b) volume fraction of failed elements versus nominal strain for the low and high porosity BMGs having porosities f = 1.9%, 3.6%, 5.7%, 20%, 41% and 60%.
Download figure:
Standard image High-resolution imageFigure A1(b) shows the evolution of volume fraction of failed elements with respect to nominal strain, for all the porosities considered in the present study. The curves are plotted upto the stage where the unit cell is deemed to have failed. The point 'C' in figure A1(b) indicates the point where the stress–strain curve shows a dip. The volume fraction of failed elements remains zero till the nominal strain reaches a point signifying the onset of failure and then increases gradually. It can be observed from this figure that the failure begins at higher strains for higher porosities. Also, as the porosity increases, the final strain to failure increases.
Appendix B
Wada and co-workers [21] have studied the effect of geometry of pore by considering the aspect ratio of ellipsoidal pores to be 3:1:1, as observed from the experiments. However, it is also possible that the random nature of formation of ellipsoidal pores would result in pores of varied aspect ratios. In order to examine this effect, unit cells having ellipsoidal pores of same porosity but different aspect ratios 2:1:1, 3:1:1 and 4:1:1, are modeled as shown in figure A2. The boundary conditions are applied in a manner similar to that of figure 1(c). Figure A3 compares the stress–strain behavior of porous BMGs with ellipsoidal pores, having f = 3%, and different aspect ratios. It is seen that the qualitative behavior of these unit cells are similar to that of experimental results. Thus, it can be concluded that, for the same porosity, the aspect ratio of the ellipsoidal pores does not significantly affect the mechanical behavior of the porous BMGs and the deformation and failure mechanisms remain the same.
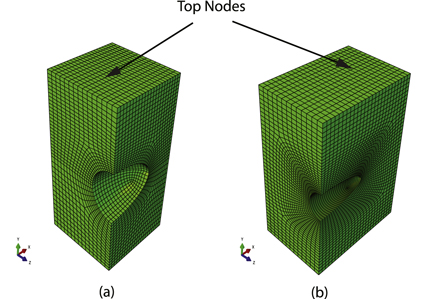
Figure A2. 1/4th of unit cell models having porosity f = 3% and ellipsoidal aspect ratios (a) 2:1:1 and (b) 4:1:1.
Download figure:
Standard image High-resolution image
Figure A3. Comparison of nominal stress versus nominal strain curves obtained from unit cell simulations of N-sample porous BMGs with ellipsoidal pores of different aspect ratios, having porosity f = 3%.
Download figure:
Standard image High-resolution image