

Abstract
In this study, we evaluated the performances of a custom-built optical feedback cavity enhanced absorption spectroscopy (OFCEAS) instrument for the determination of the composition of energy gases, focusing on methane and carbon dioxide as main components, and carbon monoxide as impurities, in comparison with the well-established, validated, and traceable gas chromatographic method. A total of 115 real sample gases collected in biogas plants or landfills were analyzed using with both techniques over a period of 12 months. The comparison of the techniques showed that the virtual model which allows the measurement, needs to be optimized using real samples of varied compositions. The OFCEAS measurement technique was found to be capable of measuring both the main components and a trace component in different matrices; to within a 2% measurement uncertainty (higher than the gas chromatograph/thermal conductivity detector (GC/TCD) method). The OFCEAS method exhibits a very fast response, does not require daily calibration, and can be implemented online. The agreements between the OFCEAS technique and the GC/TCD method show that the drift of the OFCEAS instruments remains acceptable in the long term as long as no change is made to the virtual model. Matrix effects were observed, and those need to be taken into consideration when analyzing different types of samples.
Export citation and abstract BibTeX RIS

Original content from this work may be used under the terms of the Creative Commons Attribution 4.0 license. Any further distribution of this work must maintain attribution to the author(s) and the title of the work, journal citation and DOI.
1. Introduction
As outlined in the EU 2050 long-term strategy [1], EU has set targets for 2050 to become a carbon-neutral economy. These targets require a significant shift in the energy mix across Europe. As the electricity grid alone cannot meet the energy demand of users, energy gases play a crucial role and will continue to do so in the future [2]. Today, more than 20% of Europe's total energy demand is met by gas [3], with natural gas accounting for the largest share. However, the potential of alternative energy gases such as non-conventional natural gas (natural gas from other sources such as shale reservoirs), hydrogen and biogas are increasingly highlighted and explored [4, 5]. In most cases, the production and use of these gases still produce large amounts of carbon dioxide (CO2) [3]. To meet climate targets, the CO2 produced by these processes must be captured or used to minimize the impact on the climate. This can be achieved through carbon capture, usage and storage where CO2 can be removed and either stored or utilized in industrial processes.
Due to the production method, energy gases and related gases (CO2 in this case) usually contain trace components that can negatively affect both the appliances they come in contact with and the pipelines when they are injected into the gas grid. It is therefore necessary to ensure adequate (and stable) gas quality that meets the requirements set in the relevant standards. Quality specifications are usually designed to minimize risks associated with the utilization, storage and/or transport of the gas. They include considerations for the proper and safe operation of appliances and for the integrity of the supply pipelines. However, overly restrictive limitations are avoided to not hamper the supply and to avoid higher costs (unnecessary purification costs for example).
For biomethane, the most widely used quality specifications are those developed in two standards by the European Committee for Standardization (CEN)/technical committee (TC) 408 'Natural gas and biomethane for use in transport and biomethane for injection in the natural gas grid'; EN16723–1:2016 Natural gas and biomethane for use in transport and biomethane for injection in the natural gas network—Part 1: Specifications for biomethane for injection in the natural gas network [6] and EN16723–2:2017 Natural gas and biomethane for use in transport and biomethane for injection in the natural gas network—Part 2: Automotive fuels specification [7]. EN16723–1:2016 [6] sets limits for four parameters: total volatile silicon, carbon monoxide, ammonia and amines., there are no maximal values for compressor oil and dust impurities; instead, it is stated that the biomethane shall be free from these impurities, except for an amount that does not make the biomethane unacceptable for conveyance and use in end-user applications. For chlorinated and fluorinated compounds, EN16723–1:2016 [6] refers to a technical report of CEN/TC 408, CEN/TR 17238:2018 [8], explaining an approach for the assessment of limit values for contaminants that may be present in biomethane to mitigate the potential impact on human health. Some of these parameters are also found in ISO 16723–2:2017 (silicon, compressor oil, dust, amine). In addition, there are requirements for oxygen, hydrogen, and sulfur compounds in ISO16723–2:2017 in terms of maximal limit values, which are not included in ISO16723–1:2016 [6].
For hydrogen, the primary existing documentary standards providing hydrogen quality requirements for the use as fuel for vehicles and heat applications are EN17124:2022 [9] and ISO14687:2019 [10]. EN 16726:2016 [11] specifies gas quality characteristics, parameters, and their limits for gases classified as group H (including mixtures of hydrogen and methane) to be transmitted, injected into and from storages, distributed, and utilized. For carbon dioxide, there is currently no universally agreed-upon specification for carbon capture and storage (CCS) applications. ISO/TR 27291:2020 [12] concludes that it is difficult to establish standard thresholds, even though identifying impurity concentrations and impacts is a cross-cutting issue for integrated CCS projects. So far, the impurities to be quantified and the associated thresholds found in different documents (ISO27913 [13], ISO/TR 27291:2020) vary from one document to another. There are several specifications for different CO2 utilizations: EN936:2013 (CO2 intended for human consumption) [14], EIGA 70/17 (food and beverages) [15] and GCA G6.2 [16]. The most stringent limits for most parameters are those specified in EN936:2013 and EIGA70/17 (intended for human consumption).
Fuel composition is also used to calculate the physical properties such as the energy content and methane number, e.g. according to ISO 6976:2016 [17]. Knowledge of the composition of fuel gases is a prerequisite to ensure the correct functioning of the gas infrastructure and vehicles.
But as with any method that provides results that will be used to make decisions that could affect health, safety, and acceptance, the measurements should be traceable to provide confidence and assurance in the results delivered. When performing a chemical analysis, traceability can be achieved by using primary reference standards.
The determination of gas quality with regard to compounds such as methane, carbon dioxide, carbon monoxide, hydrogen, oxygen, and nitrogen is classically carried out using gas chromatographic methods (e.g. ISO6974 [18]), which implies taking a sample of gas to be transported to the laboratory for analysis; the whole process takes several days.
Optical feedback cavity enhanced absorption spectroscopy (OFCEAS) is a relatively new technique for determining the concentration of gases. OFCEAS is a gas analysis technique developed by Joseph Fourier University in France. OFCEAS is a scanning spectroscopy technique with direct intensity measurement that relies on hyper reflective measurement gas cells and a technique to increase the purity of the laser source. In this process, a part of the emitted radiation from the chamber is returned to the laser, which allows tuning of the laser and the cavity and creates a resonance phenomenon. The measuring cavity in which the sample is analyzed, is equipped with highly reflective mirrors (>99, 99%) that allow an optical path of up to 20 km. The consequence of this phenomenon is the identification of intense absorption peaks with narrow spectral width. This laser-based technology has the potential to measure gases down to ppb levels of concentration, with unprecedented quality of measurement in terms of accuracy and repeatability. The technology works not only for impurities, but also for the composition of the main components (e.g. methane and carbon dioxide in biogas, which are present at 30%–100%). The analysis time is relatively short so that only a relatively small volume of gas is required. The technique can be used both offline and online. However, this method is not yet recommended as an analytical method in the standards for determining gas quality.
This work aims to thoroughly evaluate the performances of a custom-built OFCEAS instrumentation for the determination of the composition of energy gases, focusing on methane and carbon dioxide as main components and carbon monoxide as impurities, in comparison with the well-established, validated, and traceable gas chromatographic methods. If this technique proves accurate enough, it can then be used to monitor online processes, e.g. when some parameters are adjusted, and as an alternative analytical method to gas chromatograph (GC) methods.
2. Material and methods
Gases from biogas and biomethane plants and landfills were collected in 3 l bags (Cali-5-BondTM from Calibrated Instruments Inc., McHenry, Maryland, USA) and transported to the laboratory for analysis within two days. The measurement period was from the 13 December 2021 to the 9 December 2022.
The gases in the bags were then analyzed on the same day using both GC/thermal conductivity detector (TCD) and OFCEAS.
A Varian 450-GC-TCD/flame ionization detector (FID) equipped with three columns, was used for the GC/TCD analyses. Two columns were connected to the TCD: a Hayesep Q, 80–100 mesh, 1.8 m × 1/8'' × 2.0 mm and a molecular Sieve 5A, 60–80 mesh, 1 m × 1/8'' × 2.0 mm. A PoraBOND Q, 25 m × 0.53 mm × 10 µm, has been connected to the FID. The instrument has three six-port valves. A sampling loop of 100 µl was connected between ports two and three of the first six-port valve. The second six-port valve had the same configuration but with a sampling loop of 500 µl. For each analysis, the sampling loops were filled for 10 s, after which the six-port valves were switched over. The contents of the first loop were introduced into the packed columns (Hayesep and Molecular sieve connected in series), while the contents of the second loop were introduced into the PLOT column. After 1.3 min (time needed for the hydrogen to reach the detector, if present), the third six-port valve was switched to bypass the molecular sieve column. After the elution of methane (1.8 min) and carbon dioxide (2.1 min), this valve was returned to its original position (the two columns are then in series again), oxygen, nitrogen, and carbon monoxide were eluted. The instrument was calibrated daily with reference mixtures prepared gravimetrically by NPL according to ISO 6142–1 [19] from the components CO, CO2, CH4, O2, and N2 at a nominal value of 1, 11.172, and 47.79 mol-% for methane, 1, 25.18 and 77.73 mol-% for nitrogen, 19, 88 and 81.73 mol-% for carbon dioxide, 2950 and 20 030 µmol-% for carbon monoxide, and 0.156 mol-% for oxygen. Pure gases were also used as calibration standards for CH4, CO2, and N2. The composition is normalized to 100%. The GC/TCD method has been validated using a set of gravimetrically prepared traceable mixtures, and the method performance has been assessed by participating in the international comparison CCQM-K112 Biogas [20].For the OFCEAS analyses, two custom-built (OFCEAS—ProCeas from AP2E, part of Durag Group, Aix-en-Provence, France) were developed for the measurement of methane (CH4), carbon dioxide (CO2), water (H2O), carbon monoxide (CO) and hydrogen sulphide (H2S)—instrument 1, and oxygen (O2)—instrument 2. The gas samples were introduced into the measurement cells by means of an external pump at a flow rate of 2.5–3 l h−1 through a sulfinert-treated stainless steel restrictor. The measuring cell consisted of a multi-path cavity with highly reflective mirrors, allowing path lengths of up to 10 km. The cell was maintained at a pressure of 50 mbar and a temperature of 40 °C. To minimize the ingress of particulate matter into the instrument, a sulfinert-treated stainless steel particle filter with a pore size of 7 µm was installed upstream of the instruments. The instruments were pre-calibrated for CH4 concentrations from 0.1 mol-% to 100 mol-%, CO2 concentrations from 0.1 mol-% to 100 mol-%, H2O concentrations from 4 µmol mol−1 to 2000 µmol mol−1, for CO concentrations from 1 µmol mol−1 to 1000 µmol, for H2S concentrations from 1 µmol mol−1 to 5000 µmol and for O2 concentrations from 1 µmol mol−1 to 1000 µmol. The instruments were not re-calibrated during the measurement period.
To optimize the detection limit, the laser emission is chosen in the near infrared region. The OFCEAS experimental setup is schematized in figure 1. The OFCEAS technique has been introduced by Morville et al [21] and used in different studies, (for example for the determination air quality control determination of species in breath) [22, 23] but also recently for hydrogen purity analysis [24]. The absorption spectra are acquired on a small spectral region and an example of spectra for CO and CH4 using a similar setup is given in [22]. The light source here is a diode laser operating in L-band (wavelength range 30–15 cm) and S-band (wavelength range 15–7.5 cm) of telecom. The type of detector used to measure the light intensity from the light source is a standard InGaAs PIN photodiode. In the wavelength ranges mentioned above, the transitions for the molecules may only be overtone combination bands. The concentration is determined based upon absorption spectrum expressed in cm−1. The line intensity is directly converted to concentration using a constant conversion factor specific to the fitted absorption line for the temperature and pressure operation conditions. The conversion factor can be derived from spectral database or by direct calibration using certified mixtures. The calculation of the concentration here is based on high resolution transmission (HITRAN) database that contains all necessary parameters for spectral transitions of molecules of interest. The details of the conversion ofabsorption spectrum into concentrations can be found in the introductory part in [25] which includes a detailed description of the general form of the HITRAN line shape and its relation to concentrations of the molecules. The calculation is also verified using certified mixtures (one calibration point per species).

Figure 1. Schema of the OFCEAS setup used in the study.
Download figure:
Standard image High-resolution image3. Results and discussion
3.1. Response time and recovery time
The response time of the measurement system (figure 2) is dependent upon the concentration, as it can be seen in figure 2 but is fast at all concentrations. While a stable response is obtained in less than 2 min for an amount fraction of 44 mol-% CH4, the signal becomes stable after 3 min for an amount fraction of 56 mol-%, 3.5 min for an amount fraction of 80 mol-%, and 4 min for an amount fraction of 100 mol-%. The recovery time is less than 1 min at all concentrations.

Figure 2. Response time and recovery time for the measurement of different amount fractions of methane with the OFCEAS technique.
Download figure:
Standard image High-resolution imageThe correlation between methane measured with GC/TCD and methane measured with OFCEAS is shown in figure 3 for a total of 115 gases analyzed over a period of 12 months. The same correlation for carbon dioxide is shown in figure 4.
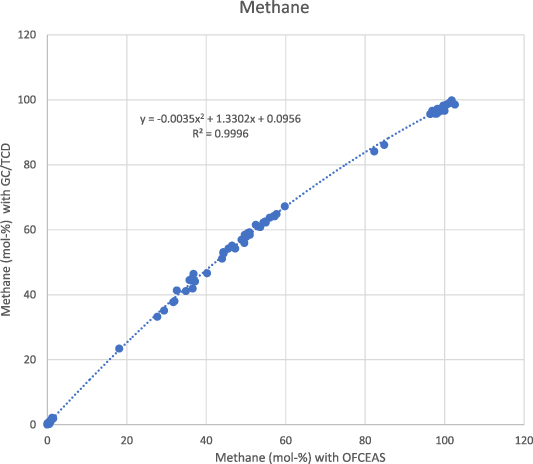
Figure 3. Correlation between the two measurement methods (GC/TCD—OFCEAS) for methane (amount fraction 0–100 mol-%) for a total of 115 gases analyzed over a period of 12 months.
Download figure:
Standard image High-resolution image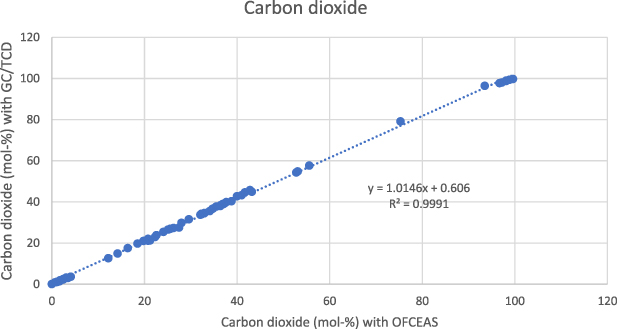
Figure 4. Correlation between OFCEAS and GC/TCD methods for carbon dioxide (amount fraction 0–100 mol-%) for a total of 115 gases analyzed over a period of 12 months.
Download figure:
Standard image High-resolution imageThe correlations clearly show that a correction must be applied to the value obtained with OFCEAS technique, especially for the methane measurement but also to some extent to the carbon dioxide measurement. For low carbon dioxide concentrations (<2 mol-%), no correction is needed, and it is preferable to calculate the absolute difference, which is 0.1 mol-% or less for 30 of 35 gases.
The results for methane (figure 3) show that the OFCEAS method underestimates the CH4 concentration compared to the reference method, especially for the concentrations in the middle of the interval. This indicates that the pre-calibration of the OFCEAS system applies mainly to the low concentrations (< 3 mol-%), while a correction is required when methane concentration is above 20 mol-%. The correlation is not linear in the range from 0.1 to 100 mol-%. The best fit is obtained using a second-order polynomial function as shown in equation (1):
This correlation yielded a coefficient of determination R2—which measures the goodness of fit of the model—of 0.996, which tends to indicate a good correlation.
The OFCEAS and GC measurements show a good agreement for carbon dioxide. The best fit is obtained by using a linear correlation as shown in equation (2):
This correlation yielded a coefficient of determination R2 of 0.9991, indicating a good correlation.
The difference observed between methane (non-linear in the range 0–100 mol-%), and carbon dioxide (linear) can be explained by the model chosen to determine these concentrations with the OFCEAS technique. In OFCEAS, the absolute molecular absorption measurements in cm−1 are directly converted to concentrations using a conversion factor specific to the fitted absorption line. To lower the limit of detection, the most prominent peak is preferably chosen. In the case of methane, this peak reaches a spectral saturation at a certain concentration (about 50 mol-% the concentrations are still calculated as the instrument models the peak, but this method compromises accuracy and repeatability). Therefore, another peak that does not go into saturation is used for the upper part of the range. When calibrating the instrument, many measurements at the concentration level around the peak change are needed to achieve a smooth transition. For carbon dioxide, the same peak is used over the entire range.
The correlation between methane measured with GC/TCD and methane measured with OFCEAS for the amount fraction between 25 to 60 mol-% is shown in figure 5. This range is typical for biogas and landfill gas. This figure clearly shows that the presence of nitrogen in the gas influences the measurement of methane performed by the OFCEAS technique. Two different linear correlations must be used; one for the gas samples containing less than 5 mol-% N2 (equation (3)) and one for the gas samples containing more than 5 mol-% N2 (equation (4))
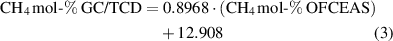
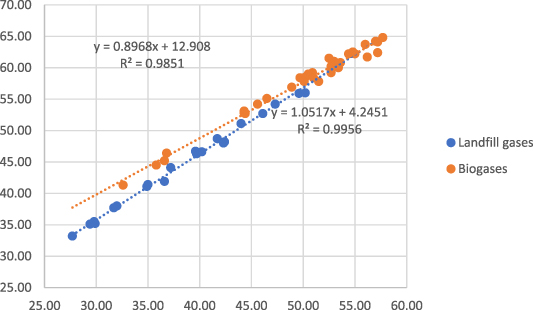
Figure 5. Correlation between the two measurement methods (GC/TCD—OFCEAS) for methane (amount fractions 25–60 mol-%).
Download figure:
Standard image High-resolution imageFor a same CH4 concentration, the presence of N2 implies a lower concentration of CO2 in the gas. Here, the phenomenon observed in figure 5, called band broadening is due to the varying amount of CO2 in the gas. The phenomenon is corrected using band broadening tables which have been determined experimentally. The phenomenon is not fully taken into account for the influence of CO2 on CH4 measurement and the band broadening table needs to be slightly improved.
The CH4 concentrations obtained with the OFCEAS technique were corrected using equations (3), (4) and compared with the concentrations obtained with the GC/TCD reference method. The relative differenceswere smaller or equal to the measurement uncertainties (0,6% relative or 0.4 mol-% and lower) with the GC method for only 10 of 65 gases, but the relative differences never exceeded 2%.
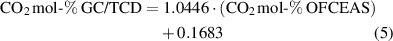
The correlation between carbon dioxide measured with GC/TCD and carbon dioxide measured with OFCEAS for the amount fraction between 10 to 60 mol-% is shown in figure 6. This range is typical for biogas and landfill gas. The presence of nitrogen in the gas has no influence on the measurement of the CO2 measurements by the OFCEAS technique. The phenomenon of band broadening is fully taken into account by the band broadening chart, thus the impact of CH4 on CO2 measurement is negligible.

Figure 6. Correlation between the two measurement methods for carbon dioxide (amount fractions 10–60 mol-%).
Download figure:
Standard image High-resolution imageHowever, due to interferences observed when measuring CO in CO2, the virtual model, which allows the measurement, was then optimized end of April 2022 to after six months leading to a slight change in the correlation. The long-term data collected for this study can be used as basis to determine the calibration interval, but this is also specific to each user according to the specific context of use. The instrument requires recalibration when changes to the conversion factor used to convert the line intensity are done. Otherwise, the user can follow the recommendation of the instrument´s supplier (here performing a control test periodically, for example twice a year) or the periodicity of calibration can be defined by the regulation (in particular concerning legal metrology) or by the user according to its requirements and needs.
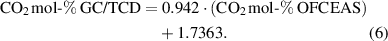
The CO2 concentrations obtained with the OFCEAS technique were corrected using equation (5) (from December 2021 to the end of April 2022) or equation (6) (from May to December 2022) and compared with the concentrations obtained with the GC/TCD reference method. The relative differences were smaller or equal to the measurement uncertainties (0%,6% relative or 0.4 mol-% and lower) with the GC method for 35 of 55 gases, but the relative differences never exceeded 2%
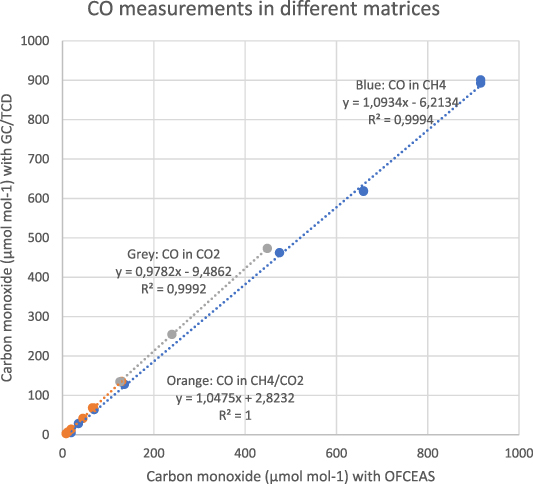
The correlation between carbon monoxide measured with GC/TCD and carbon monoxide measured with OFCEAS is shown in figure 7 for a total of 17 gases (7 in methane matrix, 5 in a CO2 matrix and 5 in a biogas matrix) analyzed over a period of one week. The results show that the matrix has a slight effect on the measurement with the OFCEAS technique as different linear correlations are obtained in each matrix. This correlation yielded coefficients of determination R2 > 0.9994, indicating a good correlation in all matrices.
Figure 7. Correlation between OFCEAS and GC/TCD methods for carbon monoxide <1000 µmol-% for a total of 17 gases (7 in methane matrix, 5 in a CO2 matrix and 5 in a biogas matrix).
Download figure:
Standard image High-resolution image
4. Conclusions
The OFCEAS measurement technique was found to be capable of measuring both the main components (CH4 and CO2) and a trace component (CO) in different matrices using the same instrument; biogas, biomethane, landfill gas, and carbon dioxide off-gas with a measurement uncertainty of 2% relative (higher than the GC/TCD method). Matrix effects were observed both for methane and carbon monoxide measurements but not for carbon dioxide measurements for which the band broadening effect due to other gases present was totally accounted for. The presence of nitrogen (>10 mol-%) in the gas influenced the measurement of methane, while small differences in the linear correlation were observed when comparing CO measurements obtained by the OFCEAS measurement technique to the reference method (GC/TCD) in biomethane, biogas and carbon dioxide matrices. The effects can be eliminated by improving the band broadening charts used to account for the presence of certain gases. By refining the virtual model, correction to the OFCEAS signal could be, in principle, fully avoided.
The OFCEAS method exhibits a very fast response on average and does not require daily calibration. The agreements between the OFCEAS technique and the GC/TCD method show that the drift of the OFCEAS instruments remains acceptable in the long term (at least a year) at the acceptable accuracy level for carbon dioxide and, methane in biogas, biomethane and, carbon dioxide. However, any update of the virtual model may cause a shift in the correlation. Periodic calibrations with a standard gas may be necessary to achieve a higher accuracy level, as these calibrations could be used to correct the effects of these small drifts.
Acknowledgments
The Joint Research Project «Metrology for decarbonizing the gas grid» is supported the European Metrology Programme for Innovation and Research (EMPIR). The EMPIR initiative is co-funded by the European Union's Horizon 2020 research and innovation programme and the EMPIR Participating States.
Data availability statement
All data that support the findings of this study are included within the article (and any supplementary files).
Conflict of interest
The authors have no conflicts of interest to declare. All co-authors have seen and agree with the contents of the manuscript and there is no financial interest to report.
Ethics statement
This article does not contain any studies involving human or animal participants performed by any of the authors.