

Abstract
Temperature control in heat exchangers in reacting and non-reacting flows is of great importance for process optimization. In this context, phosphor thermometry is a promising technique for remote planar temperature sensing. The thermometry technique is based on exciting a luminescent material by a laser pulse and analyzing the subsequent phosphorescence signal. A particular interesting application is chemical hydrogen storage using liquid organic hydrogen carrier (LOHC) systems. The knowledge of temperature fields is of special interest for the characterization and understanding of hydrogen release from the carrier liquid. We investigated the luminescence properties of the thermographic phosphor (Sr,Ca)SiAIN3:Eu2+ ('SCASN:Eu2+') dispersed in different heat transfer fluids, in particular LOHC systems, using a newly developed calibration cell. As heat transfer fluids may be excited to fluorescence by the laser as well, their absorption and florescence behavior is studied to develop an excitation and detection concept for thermometry. We found strong absorption of the heat transfer fluids from the UV range to a wavelength of about 400 nm. In addition, fluorescence signals were found in the visible wavelength range, which can interfere with the phosphor emissions. These fluorescence signals should therefore be circumvented by utilizing the different luminescence decay times in the chosen detection strategy. For thermometry, the SCASN:Eu2+ particles were excited by a laser sheet of a 532 nm Nd:YAG laser. A spectrometer and photomultiplier tube (PMT) were used to detect the emission spectrum and phosphorescence decay time (PDT). Two temperature evaluation strategies were applied, which are based on either the intensity ratio of two spectral emission regions (two-color laser-induced phosphorescence) or the PDT. The results obtained show an applicable measurement range between 293 K and 598 K for the intensity ratio method with a maximum relative sensitivity of 0.12% K−1 at 293 K. For the PDT method, the phosphor allows measurements between 423 K and 598 K with a maximum relative sensitivity of 0.56% K−1 at 598 K.
Export citation and abstract BibTeX RIS

Original content from this work may be used under the terms of the Creative Commons Attribution 4.0 license. Any further distribution of this work must maintain attribution to the author(s) and the title of the work, journal citation and DOI.
1. Introduction
1.1. Phosphor thermometry in fluids
Detailed temperature information plays a major role in many different applications, especially in heating and cooling processes. Therefore, the chemical, automotive, biomedical, and energy process industries rely on accurate knowledge of temperature fields, e.g. for the design of reactors or heat exchangers [1].
A very interesting application in the mentioned context is hydrogen storage in liquid organic hydrogen carrier (LOHC) systems [2]. LOHC systems consist of at least one hydrogen lean and one corresponding hydrogen rich molecule. Hydrogen is bound to the hydrogen-lean LOHC molecule via an exothermic hydrogenation, resulting in the hydrogen-rich LOHC molecule. In this LOHC-bound form, hydrogen can be stored safely over long periods of time at ambient conditions and without hydrogen losses. Hydrogen recovery from the hydrogen-rich LOHC molecule takes place in an endothermic dehydrogenation reaction. All components of the LOHC system are used over multiple storage cycles [3]. To be fully compatible with the existing infrastructure for the distribution of fossil fuels, the LOHC system should contain only carbon and hydrogen atoms and no heteroatoms. As the endothermic dehydrogenation reaction proceeds in the temperature range of 473–593 K the thermal stability of all applied LOHC components is important for its durability. This is the reason why many of the discussed and technically evaluated LOHC systems build on the hydrogenation of typical heat transfer fluids, such as benzyltoluene (H0-BT, 'Marlotherm LH') or dibenzyltoluene (H0-DBT, 'Marlotherm SH') [4]. During the hydrogen loading and release processes precise knowledge and control of the present temperature fields in the reactive system is of decisive importance for process control and ultimately for the efficiency and technical lifetime of the system.
Current conventional temperature sensors provide point measurements (e.g. via resistance temperature detectors), may not be inert (e.g. organic dyes, which tend to show decomposition at high temperatures) or are limited in their temporal resolution, their sensitivity, and temperature range (such as thermocouples) [5]. Thermographic phosphors (TPs) in form of solid particles, in contrast, do not show these drawbacks and are applicable for thermometry in flows or on surfaces after laser excitation. For proper utilization, the characteristics of the applied phosphor material must be carefully analyzed in the specific field of application. Optical measurement methods enable in situ two-dimensional temperature and velocity imaging for a comprehensive understanding of heat and mass transfer and chemical reactions in fluids without affecting the flow conditions [6]. There have been various review articles dealing with the precise and instantaneous measurement of temperature on surfaces, in gaseous flows or in liquids using a wide variety of laser-based sensing methods [5–8].
Thermometry based on thermographic luminescent materials is interesting because it provides point or two-dimensional temperature information by adding the temperature-dependent luminescent material into the flow or on surfaces and detecting its luminescence after excitation. There are many different methods using thermographic luminescent materials, for example laser induced fluorescence (LIF) [9], molecular tagging thermometry [10], thermochromic liquid crystals (LCs) [11], luminescence nanothermometry [12] and TPs [8]. Some of these materials may not be inert (e.g. organic dyes or fluorescence tracers, which tend to show decomposition at high temperatures) [13], can just be dissolved in different polar (e.g. the dyes fluorescein, eosin or rhodamine in water, ethanol) [14] or preferably in non-polar (e.g. the dye nile-red in alkanes, oils) liquids [15]. Other materials are very limited in their temperature range (such as LC) [6]. Approaches for the combined measurement of temperature and velocity in liquid or gaseous flows were recently reviewed by Someya [6]. In this context, TPs have attracted great interest in recent years due to their temperature range, wide spectrum of applications, their inert behavior and various luminescence properties [16, 17].
TPs are luminescent materials consisting of a ceramic host matrix doped with optically active ions (rare earth or transition metals). These particles show temperature-sensitive behavior and thus enable remote and semi-intrusive temperature and velocity measurements on surfaces or in fluids [8, 18, 19]. Point and planar measurements using TPs are even possible in, for example, combustors, internal combustion (IC) engines, strong magnetic fields, biological fluids or during catalytic reactions [20–23]. Since a multitude of TPs with a wide range of luminescence properties are available, the choice of phosphor is highly dependent on the application. The most important criteria in selecting a suitable TP are the temperature sensitive range, the emission and excitation wavelength, the resulting luminescence intensity and the luminescence duration. The latter directly influences the maximum temporal resolution of the measurements. In general, several luminescence properties of TPs can be used as a measure of temperature [24]. Two common methods are those relying on phosphorescence intensity ratio (PIR) or the phosphorescence decay time (PDT), respectively [8]. The PIR method is based on the temperature-dependent changes between two emission bands in the emission spectrum for thermometry. In most applications, a setup with two cameras equipped with adequate spectral filters is used. Thus, the maximum temporal resolution of PIR method is determined by either the luminescence lifetime of the TP or by the exposure time of the camera, depending on which is shorter [8].
The PDT approach exploits the nearly exponential decay of luminescence after pulsed excitation. The decay behavior is temperature-dependent in many cases and can be used for temperature detection. In this case, the sampling rate of the detector must be sufficiently high to resolve the temporal decay (typically in the range of some hundred ns to 5 ms [5, 19]), and the measurement time is as long as the slowest decay to be resolved. For point temperature measurements with the PDT method, photomultipliers (PMT) can be utilized [25, 26]. If a planar temperature field is to be resolved, the decay time can be recorded using framing cameras. Alternatively, two images from a double shutter camera can be used to estimate the lifetime based on the intensity ratio between two consecutive images within the decay of luminescence after excitation by a single pulse [6]. The PDT approach provides more precise and sensitive temperature imaging compared to the PIR method, but shows an application limit for very fast moving measurement objects depending on the decay behavior of the TP used [27]. A further factor in the selection of a suitable TP is the required temperature-sensitive range. At lower temperatures, transition metals such as Al2O3:Cr or ZnO show better temperature-dependent properties leading to higher sensitivity compared to rare earth metals. At temperatures above 500 K, on the other hand, there is a sharp drop in phosphorescence intensity for these transition metals [28, 29]. For most rare earth dopant ions, the phosphorescence intensity decreases at much higher temperatures due to thermal quenching [30]. The phosphor YAG:Dy3+, for example, can be used for surface temperature measurements up to 1800 K [21]. Some of the rare earth elements like Eu2+ show broadband phosphorescence emission combined with high emission probability (i.e. phosphorescence quantum yield) [28]. Moreover, since the crystal field of these Eu2+ ions significantly affects the emission characteristics, a short lifetime of up to a few microseconds is observed [31].
For TPs used in fluids, high phosphorescence quantum yield and high absorption cross-section are required to achieve high phosphorescence signal intensity. Excitation in the UV region and emission in the blue or green wavelength region is the case for most rare-earth phosphors currently in use [5, 8]. In contrast, some phosphors such as Mg4FGeO6:Mn4+ emit in the red wavelength region [32, 33], or others containing Yb3+ as sensitizer and Ho3+ or Er3+ as upconverter activator can be excited in the near infrared region [24, 34]. In technical applications where absorption or unwanted fluorescence of, for example, solvents, fuels or heat transfer fluids need to be avoided, excitation in the green and emission in the red wavelength range is desirable. Heat transfer fluids and fuels contain aromatic components, which can be excited in the UV and usually emit a fluorescence signal in the UV to green spectrum [9]. A TP excited in the visible part of the spectrum avoids interference with the fluorescence signals. Furthermore, a phosphorescence signal in the visible wavelength range simplifies the measurement setup and reduces instrument costs since no UV components are required [19]. When using a phosphor emitting in the red wavelength region, interference of the phosphorescence emission with blackbody radiation could be a drawback [35, 36]. However, with an operating temperature of the heat transfer fluids in the range of 300–650 K, this is a minor problem since thermal radiation in the visible wavelength region is extremely weak. Some TPs relevant for this temperature and wavelength region are given in [19].
A further strategy to avoid interference between the fluorescence signals from the heat transfer fluids and the emission from the phosphors is a delayed acquisition of the phosphorescence by the detection system. Since most fluorescent signals are short-lived, a phosphor with a longer lifetime can be applied to delay signal detection and avoid the interference of laser induced fluorescence (LIF) and laser induced phosphorescence signals. This procedure has already been applied to avoid fluorescence from windows [37], from gaseous reactive species [38], and from fuels [39]. In contrast, short-life TPs allow measurements in turbulent flows and maximize the acquired signal at short camera exposure times [7] required in fast flows. In general, if separation of fluorescence and phosphorescence is required, a trade-off must be made in terms of temporal resolution of the measurement and accurate temporal signal separation, followed by the selection of a suitable TP.
TPs usually do not show any influence by pressure differences that may be present [11, 40, 41]. However, some phosphors, such as Y2O3:Eu, behave in the contrary way [42]. In addition, the laser power and the particle density may have an influence on the temperature determination [8]. For this reason, it is important to calibrate the selected phosphor under operating conditions [33, 43].
Recent studies on phosphor thermometry in liquids have focused on ScVO4:Bi3+ [44], SMP:Sn2+ [45], BAM:Eu2+ [46], MFG:Mn4+ [33, 47, 48] and ZnO [33, 49]. Almost all of the above studies were conducted with particles dispersed in water. Temperature determination was performed using both luminescence intensity ratio and luminescence decay time in the temperature range from room temperature to 453 K [33, 44–46, 48, 49]. An exception is MGF:Mn4+, which was applied by Kim et al [47] for temperature measurement up to 473 K in silicone oil. In addition, Someya et al used temperature sensitive particles (TSPs) for temperature measurements in silicone oil and water [22, 50]. However, none of the TSPs and phosphors presented fully meets the requirements described above in terms of phosphorescence lifetime, excitation and emission spectrum for measuring temperature fields in fluorescent environments (here: heat transfer fluids and LOHC systems). Recently, Hertle et al investigated the temperature-dependent properties of the phosphor (Sr,Ca)SiAIN3:Eu2+ for studying thermometry of solid bulk and coated materials [19]. The absorption and emission properties of this phosphor seem to be very suitable for the targeted temperature measurements in heat transfer fluids and LOHC systems.
1.2. Aim of this work
In this work, we explore a strategy for fluid thermometry in heat transfer fluids using the phosphor (Sr,Ca)SiAIN3:Eu2+ ('SCASN:Eu2+'). Generally, the temperature fields in heat exchangers are of great importance for geometry and process optimization. In particular, this statement holds for reactive flows. A currently very relevant example of such reactive flows that include typical heat transfer fluids as reactive components is hydrogen-release from hydrogen-rich LOHC compounds forming the corresponding aromatic heat transfer fluid compounds. In such application the local temperatures must be precisely controlled to make full use of the reactor volume while avoiding hot spots from overheating that would lead to thermal decomposition of the liquid carrier. Against this background, we investigate Marlotherm SH, Marlotherm LH and silicone oil as exemplary fluids. While silicone oil is a generally common heat transfer fluid, the former additionally are important in the context of LOHC technology, representing widely used hydrogen-lean LOHC components.
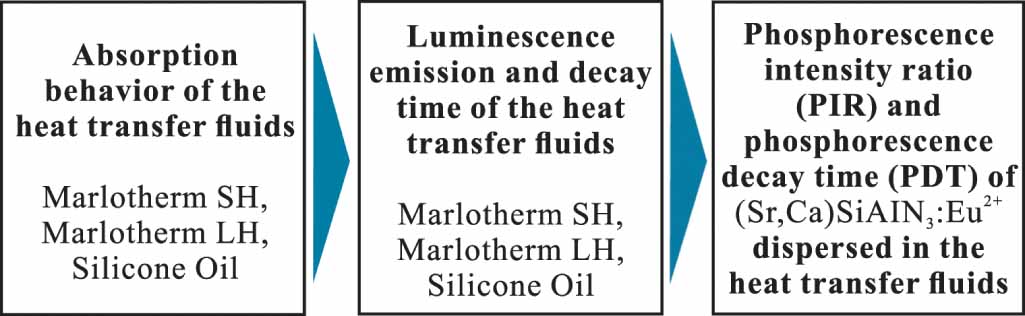
As mentioned before, phosphorescence of SCASN:Eu2+ has already been analyzed as bulk material and in a surface coating for solid-phase thermometry up to 800 K [19]. However, to our knowledge, there has been no work carried out on the absorption and fluorescence behavior of heat transfer fluids, neither has there been a comprehensive characterization of the thermographic properties of SCASN:Eu2+ incorporated into these fluids. In order to obtain reliable statements on the phosphorescence of SCASN:Eu2+ using the PIR and PDT method without LIF interference, an investigation of the fluorescence properties of the heat transfer fluids is also required. Figure 1 shows the three different topics investigated in this study.

Figure 1. Three-step approach applied in this study for the determination of phosphorescence intensity ratio (PIR) and phosphorescence decay time (PDT) of SCASN:Eu2+ dispersed in heat transfer fluids.
Download figure:
Standard image High-resolution imageIn the first two steps, the absorption and luminescence emission characteristics of the heat transfer fluids are investigated to develop an excitation and detection strategy for thermometry. Since some of the fluids can be excited to fluorescence after UV excitation, leading to interference with the temperature marker signal, knowledge of these properties is essential. A suitable temporal detection strategy is implemented to avoid interference in the spectral phosphorescence emission band. In the final step, the temperature-dependent PIR and decay time for SCASN:Eu2+ dispersed in the fluids are investigated, and the resulting sensitivities are displayed.
2. Materials and methods
2.1. Heat transfer fluids and phosphor particles
In this study, the commercial heat transfer fluids Marlotherm SH, Marlotherm LH (both Sasol Germany GmbH, Germany) and silicone oil (SilOil M40.165/220.10, Peter Huber Kältemaschinenbau AG, Germany) are used. The maximum temperature of interest depends on the heat transfer fluid used and ranges from room temperature up to 598 K for Marlotherm SH, up to 548 K for Marlotherm LH and up to 423 K for silicone oil. The phosphor applied is a commercial (Sr,Ca)SiAIN3:Eu2+ ('SCASN') powder. SCASN:Eu2+ was supplied by Lumileds Germany GmbH (the doping concentration is proprietary). The phosphor was originally developed as an light-emitting diode (LED) phosphor, and has regularly shaped particles with a mean diameter of about 12 μm and mainly rhombic structure [19]. Due to the high viscosity, the homogeneous conditions in the calibration cell and the low velocities when using heat transfer fluids, this particle size is not a problem for laminar flow measurements in the application of interest. If required, an additional grinding or sieving step is possible to achieve particle sizes of less than 5 μm. This phosphor has a very broad excitation band ranging from 200 nm to about 550 nm, a high quantum efficiency of up to 96.5% at 443 nm excitation, an emission peak centered at about 620 nm, and a short luminescence lifetime of about 0.5 μs [19, 51]. Luminescence emission indicates a blue shift with increasing temperature after pulsed excitation at 532 nm. Measurements up to 800 K are possible using the two-color intensity method, and the quenching temperature is 530 K [19].
2.2. Calibration cell
A calibration cell was developed for temperature-dependent absorption and fluorescence measurements of the heat transfer fluids and PIR and PDT calibration of SCASN:Eu2+ seeded into the fluids in the desired temperature range. Figure 2 shows a schematic 3D model of the cell and its main components. The fluid or SCASN:Eu2+-fluid mixture to be measured was filled into a quartz glass cuvette (UQ-751, 20 × 20 × 20 mm3, Portmann Instruments AG, Switzerland). In the case of using TP particles, these were added to the respective heat transfer fluids prior to filling and evenly distributed with the use of an ultrasonic disperser. Since the cuvette can only be heated slowly (1 K per minute), a magnetic stirring bar ensured the necessary mixing in the measuring volume. Furthermore, the cuvette was continuously purged with nitrogen (grade 5.0 corresponding to a purity of >99.999 %, Linde AG, Germany) to prevent the particles from sinking during the long heating times. Before and during the measurements both the stirring bar and the nitrogen flushing were deactivated. The cell was heated via four heating cartridges (HLP, Horst GmbH, Germany), which were radially evenly distributed. To reduce temperature gradients, the entire cell was equipped with thermal insulation (BRA-GLA KA, Brandenburger Isoliertechnik GmbH&Co. KG, Germany). Thus, the temperature could be accurately adjusted in the measuring volume between room temperature and 650 K. The temperature was determined at two measurement points using calibrated (accuracy ± 15 K) type K thermocouples (Typ 12, K, TC Mess- und Regeltechnik GmbH, Germany). These thermocouples were positioned in the upper area and in the lower area near the bottom of the cuvette, respectively. To obtain optical access, two optical axes are present in the applied calibration cell, one for the laser sheet and the second for the optical detection of the luminescence signal. The two axes cross each other in the measurement volume at 90°.
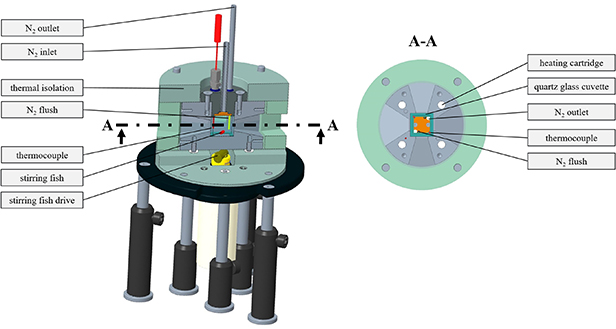
Figure 2. Cross section, 3D model and main components of the newly developed calibration cell applied in this study.
Download figure:
Standard image High-resolution image2.3. Experimental setups for temperature-dependent absorption and emission behavior
In order to evaluate the absorption cross sections of the heat transfer fluids at room temperature, a spectrophotometer (Jasco V-750 UV–Visible/NIR, JASCO Deutschland GmbH, Germany) was used. The transmission characteristics were determined in a spectral band between 190 nm and 900 nm with a resolution of 5 nm, a wavelength accuracy of ±0.2 nm (at 651.1 nm) and a wavelength repeatability of ±0.5 nm (manufacturer specifications). The fluid to be analyzed was filled into a quartz glass cuvette (UQ-751, 20 × 20 × 20 mm3, Portmann Instruments AG, Switzerland). The reference measurements were performed with an air-filled cuvette of the same type. The difference in the reflection at the cuvette walls when it is filled with air or liquid, respectively, was corrected by using Fresnel's law and is less than 10 %. For each fluid, three absorption (I) and reference (I0) measurements were performed simultaneously at room temperature on different days. The absorption cross section was then determined based on the mean I I0 −1 values using the Beer–Lambert law. For higher temperatures the absorption, fluorescence and phosphorescence measurements were performed in the newly developed calibration cell.
The top view of the experimental setup for the absorption measurements at higher temperatures using the illustrated calibration cell is shown in figure 3. The experiments were performed at ambient pressure in the calibration cell using a quartz glass cuvette (UQ-751, 20 × 20 × 20 mm, Portmann Instruments AG, Switzerland) filled with the heat transfer fluid to be investigated. Depending on the fluid, the temperature was varied between room temperature and a maximum temperature of 598 K in 25 K steps. A magnetic stirring fish ensured homogeneous conditions. The average temperature used as a reference for the absorption measurements was determined by two type K thermocouples (Typ 12, K, TC Mess- und Regeltechnik GmbH, Germany) in the upper and lower area of the cuvette. The thermocouples showed a maximum gradient of less than 1.5 K for all measurements.
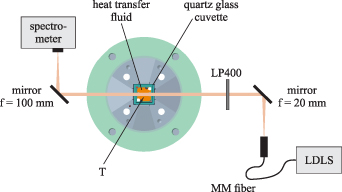
Figure 3. Optical setup for absorption measurements of the heat transfer oils including a schematic cross-sectional view of the calibration cell. MM fiber—multimode fiber, LDLS—laser-driven light source, T—thermocouple, LP—long pass filter.
Download figure:
Standard image High-resolution imageThe absorption path between the opposed quartz glass walls of the cuvette was 20 mm. A laser-driven light source (LDLS, ENERGETiQ EQ-99X-FC, Hamamatsu Photonics K.K., Japan) was used for broadband excitation from 190 nm to 2100 nm. After the fiber exit, first the light was collimated (6 mm) by an aluminum coated parabolic mirror (50328AL, Newport Corporation, USA), then passed through the measurement volume and afterwards focused by a cylindrical concave aluminum mirror (CCM254-100-G01, Thorlabs Inc., USA) onto the entrance slit of a commercially available spectrometer (Flame-S, Ocean Optics, USA). The spectral response was detected by the Flame-S spectrometer in a wavelength range from 400 nm to 707 nm with a 16 bit 2048-element CCD array detector, a slit width of 25 μm and a grating of 1200 lines mm−1. The spectrometer was wavelength-calibrated using a krypton calibration lamp (LSP031, LOT Quantum Design, USA), and the wavelength dependent transmission efficiency of the setup was determined with a broadband calibration source (HL-3-Plus-CAL, Ocean Optics, USA). The reference measurements were performed using the optical setup described, with the cuvette filled with air. The difference in the reflections at the cuvette walls between air and fluid filling of the cuvette on the resulting absorption cross-section was corrected using Fresnel's law and is less than 10 %. During the measurements at room temperature with the spectrophotometer, strong absorption at wavelengths below 400 nm was observed for the heat transfer fluids. To avoid detection of unwanted fluorescence, a 400 nm long pass filter (FELH0400, Thorlabs Inc., USA) was positioned between the aluminum coated parabolic mirror and the measurement volume. In this way, the strong fluorescence signal of the liquids is suppressed, which is excited below 400 nm (strong absorption of the liquids) by the broadband light source.
The optical setup including the calibration cell for the temperature dependent emission and decay time behavior of the heat transfer fluids and SCASN:Eu2+ dispersed in the heat transfer fluids is shown in figure 4. The studied temperature range, the determination of the average temperature and the procedure for the experiments were the same as for the absorption measurements. In the setup shown in figure 4, the fluorescence characterization of the heat transfer fluids was performed first, followed by the phosphorescence characterization of SCASN:Eu2+ dispersed in the heat transfer fluids. However, the setup for determining the emission behavior and the decay time of the heat transfer fluids is simplified in some aspects compared to figure 4. During these measurements, a split fiber (TM200R3S1B, Thorlabs Inc., USA) was used (not shown in figure 4) instead of the multimode fiber, which directs 25% of the detected emission signal directly to the photomultiplier tube and 75% to the spectrometer. This eliminates the second optical detection path in advance of the spectrometer in figure 4. Furthermore, the emission spectra measurements of the fluids do not require any temporal signal separation and thus triggering with the aid of a pulse clock. The two measurement routines for the characterizations are described in the next section. For the experiments the second harmonic (532 nm) of a pulsed Nd:YAG laser (Quantel Q-smart 450, Lumibird, France) with a pulse duration of 6 ns, a repetition rate of 10 Hz and a laser power of 5 mJ was used for excitation. Along the optical path two highly reflective mirrors (NB07-K13, Thorlabs Inc., USA) and a set of three cylindrical lenses (LJ1363L2-A, LK1419L1-A, LK1487L1-A, Thorlabs Inc., USA) were utilized to form a light sheet with a thickness of about 0.5 mm and a height of 21 mm. Before the laser pulse entered the cell, the laser power could be adjusted using a λ 2−1-plate (WPH05M-532, Thorlabs Inc., USA) and a polarizing beamsplitter (05BC15PH.3, Newport Corporation, USA). In this way, the laser light in the measurement volume was p-polarized. Subsequently, and before the laser pulse entered the cell, 50% of the laser energy was directed to an energy meter (QE50LP-S-MB-D0, gentec-eo Inc., USA) via a plate beamsplitter (BSW10, Thorlabs Inc., USA). In this way the laser energy was measured on a shot-to-shot basis. The fluorescence emissions from the heat transfer fluids and the SCASN:Eu2+ were detected using a spectrometer (QEPro, Ocean Optics, USA) and a photomultiplier tube (H11526-20-NF, Hamamatsu Photonics K.K., Japan).
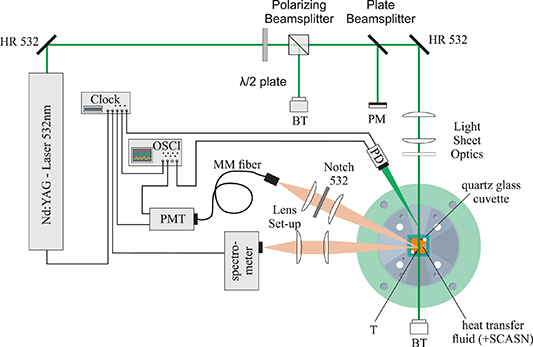
Figure 4. Optical setup for the temperature dependent emission and decay time behavior of the SCASN:Eu2+ dispersed in the heat transfer fluids. HR- highly reflective mirror, BT—beam trap, PM—power meter, T—thermocouples, PD photo diode, MM fiber—multimode fiber, PMT—photomultiplier tube, OSCI—oscilloscope.
Download figure:
Standard image High-resolution imageThe spectral response was detected by the spectrometer in a wavelength range from 197 nm to 1001 nm with an 18 bit 1024-element CCD array detector, a slit width of 200 μm and a grating of 300 lines mm−1. The system was wavelength-calibrated using a krypton calibration lamp (LSP031, LOT Quantum Design, USA), and the wavelength-dependent transmission efficiency of the setup was determined with a broadband calibration source (HL-3-Plus-CAL, Ocean Optics, USA). The signal coming from the calibration cell was focused on the slit of the spectrometer via an optical system consisting of two spherical lenses (LA1979-AB, LA1401-AB, Thorlabs Inc., USA). The decay time signal was detected via an optical system consisting of two spherical lenses (LA1708-AB, LA1805-AB, Thorlabs Inc., USA), a 532 nm notch filter (NF533-17, Thorlabs Inc., USA) to block the scattered laser light and a multimode fiber (M25L05, Thorlabs Inc., USA) guiding the signal to the photomultiplier tube. To check the temporal alignment, a photodiode (SM05PD2A, Thorlabs Inc., USA) was used to detect the scattered light of the laser signal. The signals coming from the photodiode and the photomultiplier tube were displayed and stored via an oscilloscope (WavePro 7300A, Teledyne LeCroy, USA) with a temporal resolution of 0.05 ns. The length of the signal cable between the PMT and the oscilloscope was 850 mm and the input resistance was 50 Ω for the measurements regarding the heat transfer fluids and the SCASN:Eu2+. For the measurements performed with the SCASN:Eu2+ dispersed in the fluids, a temporal separation of the fluorescence and phosphorescence signals and thus a triggering was required. This was carried out with a pulse clock (9618 Plus, Quantum Composers Inc., USA), which controlled the laser, the spectrometer and the PMT in a time-shifted mode as a master. For comparison of the temporal fluorescence behavior, additional measurements of the fluorescence decay curves of the fluids were performed at room temperature using a fluorescence lifetime spectrometer (FluoTime 300, PicoQuant) with a continuous-wave laser excitation wavelength of 402.2 ± 3.8 nm. The signal response was detected for a wavelength of 501 nm (Marlotherm SH and Marlotherm LH) and 531 nm (SilOil) with a fit window of 5 ns–20 ns after maximum signal intensity, a resolution of 2.5 ns and a measurement duration of 16 s.
3. Delay strategy for phosphorescence measurements
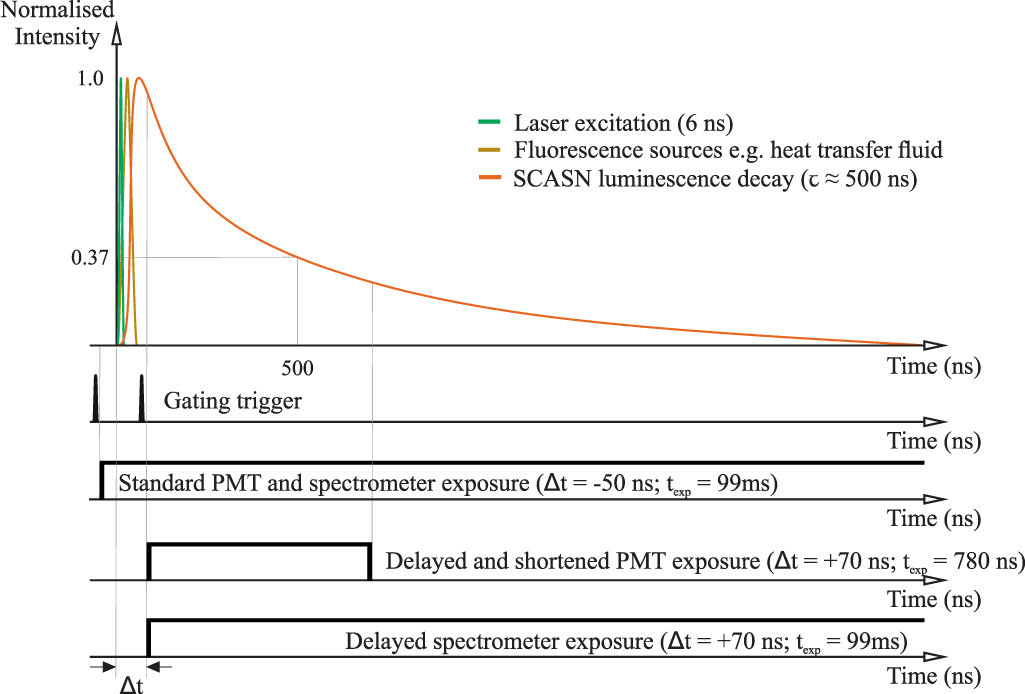
Often background radiation or other fluorescence signals interfere with the signal to be measured and efforts are made to avoid them by, e.g. spectral bandpass filters. In this way, the selectivity of the targeted wavelength band is improved, but if the signal used and the interfering signals spectrally overlap, this can be solved only at the price of a drop in the intensity of the total signal to be measured. Another way to solve this problem is to perform a separation in the temporal domain. For pulsed excitation in the nanosecond range, a distinction can be made between the laser-induced signals with short lifetimes (e.g. fluorescence) and the signals with longer lifetimes (e.g. phosphorescence) by delaying and/or gating the exposure. For phosphors with lifetimes in the range of hundreds of nanoseconds to microseconds, a detailed evaluation of the fluorescence lifetimes overlaying the phosphorescence is required for clear signal separation, since these are generally also in the nanoseconds range. Figure 5 shows a schematic representation of the luminescence signals present in the measurement application for temperature measurement in heat transfer fluids using the phosphor SCASN:Eu2+ and the associated delay strategy.
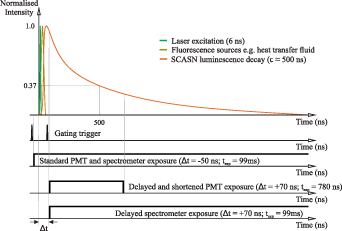
Figure 5. Schematic representation of the luminescence signals in the present measurement application. A timing strategy based on the standard and delayed exposure of the PMT and the spectrometer as well as the duration of the excitation laser, the fluorescence source and the SCASN:Eu2+ luminescence decay at room temperature (Troom = 300 K) is shown.
Download figure:
Standard image High-resolution imageWhile the laser pulse duration and subsequent fluorescence of the fluid lasts only a few nanoseconds, the decay time of the SCASN:Eu2+ is in the range of several hundreds of nanoseconds. At reference conditions, the signal acquisition of the PMT and the spectrometer starts a few ns before the laser pulse and thus detects all resulting signal both temporally and spectrally. If only the phosphorescence of the SCASN:Eu2+ is to be detected, this can be carried out with a time delay of several nanoseconds, depending on the determined decay time of the fluorescence. In this way, the decay curve of the SCASN:Eu2+ detected by the PMT is shortened in time, but since the lifetime method typically uses a time-window and appropriate fitting algorithms, this is not a significant drawback.
The delayed gating often used in the PDT method is described in [25]. There, the definition of the acquisition time window and the different fit algorithms are explained for the case where the luminescence signal is fitted in a time window starting with a delay of a few ns after the end of the excitation laser pulse. A trade-off must still be made with respect to the length of the time delay Δt [39]. This should be sufficiently long to completely avoid the resulting interfering signals (e.g. fluorescence), but as short as possible to ensure sufficient signal intensity of the SCASN:Eu2+. As mentioned earlier, such a strategy has already been successfully implemented [37–39] to avoid various other light sources from the optical measurement application. In our work, to the best of our knowledge, we carefully evaluated the fluorescence lifetime of the heat transfer fluids for the first time to avoid interfering signals and then applied a delayed acquisition strategy for the PIR and PDT measurements of SCASN:Eu2+ dispersed in the fluids.
4. Post-processing
The absorption cross section was calculated according to the Beer–Lambert law:
The wavelength and temperature dependent absorbance α(λ,T) was obtained from the ratio I I0
−1 based on the mean spectra (I) and reference spectra (I0) at the respective temperature. The absorption path  was 20 mm for all experiments and the absorber number density (N) was determined using the ratio of Avogadro's constant NA times the density ρ(T) of the fluid at the respective temperature divided by the molar mass M of the fluid.
For each temperature measurement point at the respective fluid, 250 spectra were recorded with an exposure time of 50 ms to minimize the influence of varying spatial inhomogeneities and temporal fluctuations. The data were smoothed using a Savitzky–Golay filter and corrected for instrumental response.
Temperature determination based on the PIR exploits the temperature dependence of the spectral luminescence emission. Thereby, two different bands of a broad 4f n −1 5d–4f n emission are examined for the temperature determination [19]. The broadening of the spectrum is caused by an increased population of higher vibrational levels of the excited state. This is due to a weakening of the crystal field, which affects the activator ion through thermal lattice expansion and an occurring distance difference in the metal ligand between the ground state and the excited state [19, 52]. In general, this leads to an intensity ratio of two thermally coupled levels that can be fitted to the Boltzmann distribution [52]:
The ratio R depends on the energy gap  , a constant A, the Boltzmann constant k and the temperature T. Here, the temperature dependent intensity ratio was determined by dividing two integrated luminescence bands I(λ):
The λi (i = 1–4) indicate the start and end points of the applied emission bands according to the bandpass filters applied.
Equation (4) shows the calculation of the relative temperature sensitivity S. Equation (5) describes the determination of the average temperature precision  using the standard deviation σ of the measurements:
Temperature determination using the PDT relies on the radiative transition decay time τ of the phosphor. The link between the PDT constant τ and the radiative (kR) and the non-radiative (kNR) relaxation processes is given by
An increase in temperature usually results in a decrease in luminescence duration due to thermal quenching, vibrational relaxation and internal conversion, which affect kNR. In the decay curve region where the temperature-dependent kNR value is dominant, a simple exponential decay can be used to determine the temperature. For a simple exponential decay, the decrease in phosphorescence intensity I(t) is directly proportional to the decrease in the population of the excited state. For the PDT method the central quantity is the decay time τ, which is the period in which the emission intensity I(t) decreases to e−1 of its initial value I0:
The relative temperature sensitivity S and the average temperature precision  were calculated for the PDT approach in analogy to equations (4) and (5) using the decay time τ instead of the signal ratio R.
For characterization of the spectral emission of the heat transfer fluids, a temperature variation between room temperature and a maximum of 598 K in 25 K steps was performed. For each measurement point, 50 spectra were recorded with an exposure time of 2 s each using a spectrometer and then averaged. Smoothing of the data was performed using a Savitzky–Golay filter. In addition, the decay time of every fluid was recorded with the PMT at each measuring point. A series resistance of 50 Ω was used at the signal input of the PMT. The decay time of the various heat transfer fluids determined with the PMT-setup was then determined using the Levenberg–Marquardt algorithm within a fit window in the range of 95%–20% after the maximum signal intensity. For each measurement point, 50 decay curves were recorded over the full spectrum and then averaged. The fit windows were specified in this way since preliminary studies have indicated a simple exponential decay of the signal in this range. The resulting decay curves were compared with the fluorescence lifetime spectrometer results of the temporal fluorescence behavior. Although these measurements were not conducted at an excitation wavelength of 532 nm, the signals were not detected in a broadband manner, and temperature variation was not possible, these measurements can nonetheless serve as a rough reference and comparison for the decay signals obtained by the PMT.
The characterization of SCASN:Eu2+ dispersed in the heat transfer fluids was carried out in the same temperature ranges as for the heat transfer fluids. Since the phosphorescence emission from the SCASN:Eu2+ and the fluorescence emission from the heat transfer fluids were expected to be in the same spectral range, a temporal separation of signal detection was required (see section 3). A signal overlay must be prevented since fluorescence might bias the evaluation of the phosphorescence signal and a reliable temperature measurement via phosphorescence signals would not be possible. Therefore, the detection of the phosphorescence signal of SCASN:Eu2+ was performed 70 ns after the laser pulse. This approach ensured that only the signals of the phosphorescence of SCASN:Eu2+ were detected. For each temperature measurement point in the respective liquid, 485 images were acquired with the spectrometer, each with an integration time of 99 ms, smoothed with the Savitzky–Golay filter and then averaged. The decay time of SCASN:Eu2+ was detected using a series resistance of 50 Ω at the signal input of the PMT. The phosphor decay time of SCASN:Eu2+ was determined by averaging 50 broadband recorded decay curves for every measurement point. Thereby, the fit window started 80 ns after the maximum signal intensity acquired by the PMT and had a length of 420 ns. The same fit procedure was applied as mentioned above.
5. Results and discussion
5.1. Absorption behavior of the heat transfer fluids
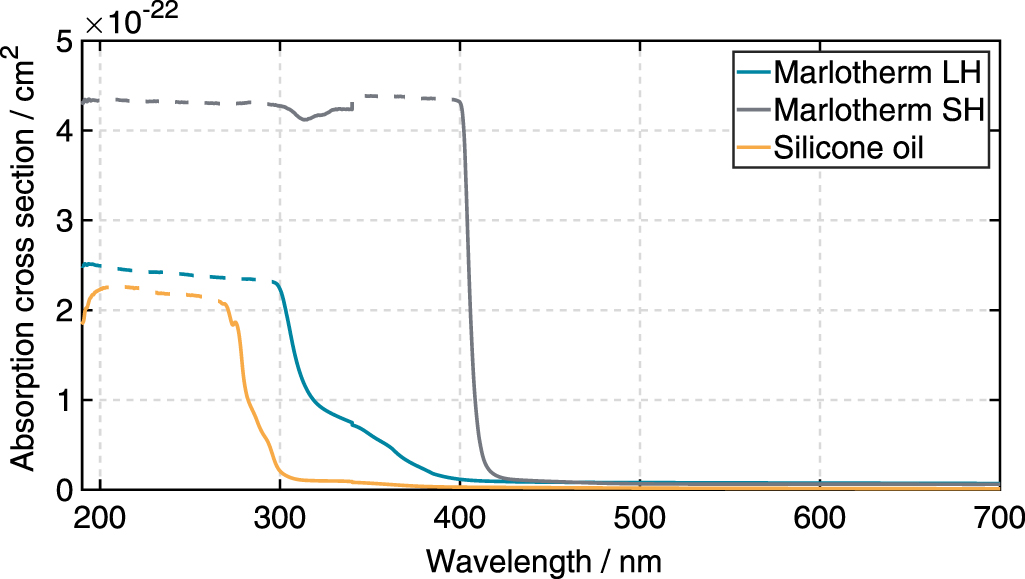
Measurements with the spectrophotometer indicated strong absorption below 280 nm for all three fluids at ambient temperature, with absorption cross sections in the order of 2 × 10⁻²² cm2 for silicone oil to 4.5 × 10⁻²² cm2 for Marlotherm SH (see figure 6).
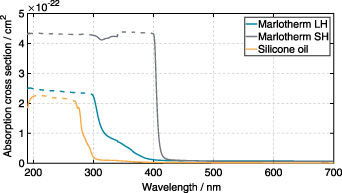
Figure 6. Absorption spectra of Marlotherm LH, Marlotherm SH, and silicone oil at ambient temperature and pressure measured with the spectrophotometer.
Download figure:
Standard image High-resolution imageBetween 280 nm and 400 nm, the absorption cross section of silicone oil decreased and no significant absorption was obtained above 350 nm. For Marlotherm LH the absorption cross section decreased in the wavelength range between 300 nm and 400 nm and nearly no significant absorption is present above 400 nm. Marlotherm SH, on the other hand, shows a nearly constant level of absorption up to a wavelength of 400 nm. The constant values of the absorption cross section at and below 400 nm are not physical and should be larger (which is shown by additional LDLS measurements presented below, at least for Marlotherm SH and Marlotherm LH) but indicate complete absorption of the light in the present cuvette. However, it can be concluded that practically a reasonable excitation of a phosphor below 400 nm is only feasible for silicone oil. For silicone oil, this was also demonstrated by Kim et al using a dispersion of MGF:Mn4+ and a 385 nm UV-LED for excitation [47]. In order to find a suitable excitation wavelength for the phosphor material at which all three liquids exhibit very low absorption, the temperature-dependent absorption cross section of the liquids in a wavelength range between 400 nm and 700 nm was then investigated with a LDLS, since temperature variation is not possible with the spectrophotometer. The absorption spectra are presented in figure 7.

Figure 7. Temperature dependent absorption spectra of Marlotherm SH and Marlotherm LH at ambient pressure measured with the LDLS setup.
Download figure:
Standard image High-resolution imageThe absorption cross section at room temperature measured with the spectrophotometer (figure 6) shows very good agreement with the results of the setup with the LDLS at room temperature (figure 7). In the wavelength range between 400 nm and 700 nm, as expected, no significant absorption can be detected for silicone oil, hence it is not displayed in figure 7. At ambient temperature and for a wavelength of 400 nm the absorption cross section is in the order of 1 × 10⁻²³ cm−2 for Marlotherm LH and in the order of 3.5 × 10⁻²² cm−2 for Marlotherm SH. The absorption of Marlotherm LH continues to decrease for larger wavelengths and above a wavelength of 450 nm it is found to be negligible. Marlotherm SH shows already a strong decrease in absorption above a wavelength of 420 nm. Above 500 nm, absorption is relatively weak but cannot be neglected. Since heat transfer fluids contain aromatic hydrocarbons, which according to the literature [9] are responsible for strong absorption in the UV, the general absorption behavior shown was to be expected.
Both Marlotherm SH and Marlotherm LH show an absorption behavior depending on the temperature. With increasing temperature, a broadening and red-shift of the absorption spectra occur for both fluids. As given by the Boltzmann distribution, a higher temperature results in a higher probability that higher vibrational levels are populated within the electronic ground state. Consequently, the energy gap between the singlet states S0 → S1 is reduced, which explains the broadening and red-shift of the spectra [53].
In the temperature range relevant for the respective application of the fluid, it is found that excitation of the phosphor particles at the aimed wavelength of 532 nm is accompanied by low absorption of all fluids. Consequently, this excitation wavelength of 532 nm is applied for the subsequent investigations.
5.2. Fluorescence emission and decay time of the heat transfer fluids
The fluorescence emissions for excitation at 532 nm were investigated first in order to know possible overlaps of the fluorescence signal of the fluids with the phosphorescence of SCASN:Eu2+ dispersed in the fluids. This is especially relevant because temperature-dependent shifts of the fluorescence signal of the fluids could occur. A spectral overlap of the fluorescence of the fluids with the phosphorescence of the SCASN:Eu2+ can be avoided by a delayed signal detection (see section 3). A signal overlay must be prevented, since the intensity of the fluorescence may be significantly stronger than that of the phosphorescence due to the low particle concentration. Preliminary tests showed that the fluorescence signal is larger than the phosphorescence signal roughly by a factor of three to five. Consequently, a temperature measurement via phosphorescence signals is not possible.
The temperature-dependent fluorescence emission spectra of the heat transfer fluids are displayed in figure 8. A fluence of 24 mJ cm−2 was chosen to avoid laser-induced heating of the fluids. Similar as for absorption, no significant fluorescence can be detected for silicone oil. For both heat transfer fluids (Marlotherm SH and Marlotherm LH), a strong increase in absolute signal intensity is observed with increasing temperature. This is in agreement with the findings from the absorption measurements (see section 5.1), according to which the absorption cross section of both fluids is no longer negligibly small at a wavelength of 532 nm for higher temperatures.
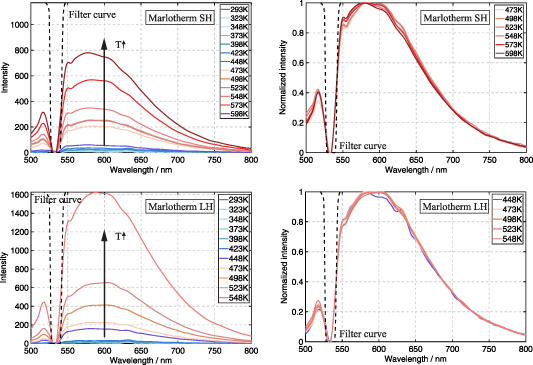
Figure 8. Fluorescence emission from 500 nm to 800 nm of Marlotherm SH and Marlotherm LH after 532 nm excitation at ambient pressure. Temperature range from 293 K to 598 K, fluence: 24 mJ cm−2. The spectra on the right are normalized to the maximum peak of each temperature.
Download figure:
Standard image High-resolution imageDue to low signal intensities at low temperatures, normalized fluorescence emission of each fluid was compared at temperatures above 448 K only. Note that a notch filter was used at 532 nm to avoid damaging of the detectors. This is the reason for the missing emission signals in the range between 524 nm and 542 nm. Marlotherm SH and Marlotherm LH show broadband emission in the wavelength range between 500 nm and 800 nm with an emission peak centered at about 580 nm. Neither a shift in the peak nor a broadening of the signal is visible with increasing temperature. Consequently, the fluorescence of the fluids cannot be utilized for thermometry via two-color LIF. Since the emission of the phosphor material SCASN:Eu2+ is broadband and the peak is centered at 620 nm, signal overlap occurs and the phosphorescence signal must be detected with a temporal delay.
In order to identify an appropriate delay in signal detection, the decay behavior of the fluorescing fluids Marlotherm SH and Marlotherm LH was determined as a function of temperature. Since silicone oil shows no emission in the relevant spectral range, the decay behavior was not evaluated. In a first step, the decay times of both relevant fluids were analyzed using the fluorescence lifetime spectrometer. Although this only allows measurements at ambient temperature and with an excitation wavelength of 402 nm, it is possible to determine the principle decay behavior and the decay time of the two fluids. Figure 9 illustrates the normalized decay curves of Marlotherm SH and Marlotherm LH and the applied fit window between 5 ns and 20 ns after the maximum signal intensity.
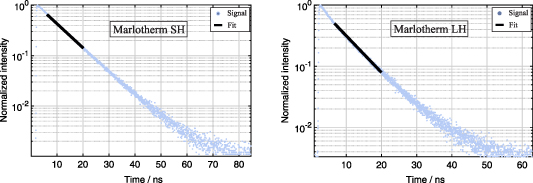
Figure 9. Normalized single shot fluorescence signal at room temperature for Marlotherm SH and Marlotherm LH after 402 nm excitation as well as the mono exponential fit for the used fit window. The absolute value of the slope of the fit corresponds to the reciprocal of the lifetime τ.
Download figure:
Standard image High-resolution imageBoth fluids show a single exponential decay behavior in the ns range. The resulting lifetimes are about 9 ns for Marlotherm SH and about 7 ns for Marlotherm LH using equation (7) and an intensity threshold fit window as proposed in [54, 55]. To investigate the temperature-dependent decay behavior of the fluids, the setup shown in figure 4 was used. The resulting normalized fluorescence signals were then evaluated and these behave similarly as shown in figure 9 for the measurements with the fluorescence lifetime spectrometer. The measurements with the PMT showed a decay time at room temperature of about 8 ns for Marlotherm SH and of about 6 ns for Marlotherm LH. These values are in good agreement with the decay times measured with the fluorescence lifetime spectrometer, which are 7 ns for Marlotherm LH and 9 ns for Marlotherm SH. For both setups, the determined decay represents an average of 50 individual measurements.
The repeatability of the PMT is in the range of ±3% of the average value of the decay time. In figure 10 the temperature-dependent decays of Marlotherm SH and Marlotherm LH after pulsed excitation at 532 nm and broadband detection using a PMT are shown. Thereby the fit window was in the range of 95%–20% after the maximum signal intensity. The heat transfer fluids show a relatively constant decay in the investigated temperature range, taking into account the measurement uncertainties of the measurement setup. For Marlotherm SH, a temperature ranging between 293 K and 623 K was investigated and the resulting time was found to be between 6 ns and 10.5 ns with a maximum standard deviation of ±0.5 ns. Marlotherm LH shows a time between 6 ns and 8.5 ns with a maximum standard deviation of ±0.3 ns in the temperature range of interest between 298 K and 548 K. The values obtained are in a range to be expected according to the results reported in the literature [9, 39].
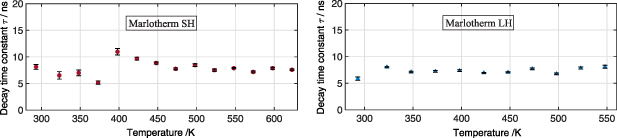
Figure 10. Temperature dependent fluorescence decay time of Marlotherm SH and Marlotherm LH after 532 nm excitation at ambient pressure. Temperature ranges from 293 K to 623 K, fluence: 24 mJ cm−2. Signal was detected with a photomultiplier tube and fitted with a mono exponential fit. Error bars correspond to the standard deviation of 50 measurements.
Download figure:
Standard image High-resolution imageIn conclusion, a delay of 70 ns should be perfectly sufficient to avoid mixing of the undesired fluorescence of the fluids and the desired phosphorescence of the SCASN:Eu2+ in the relevant temperature range and additionally taking into account the respective laser and detection system exposure jitter. Therefore, based on the findings obtained, a delay of 70 ns between laser pulse and detection via PMT or spectrometer was applied for further investigations.
5.3. Temperature-dependent spectral emission and sensitivity of the phosphor
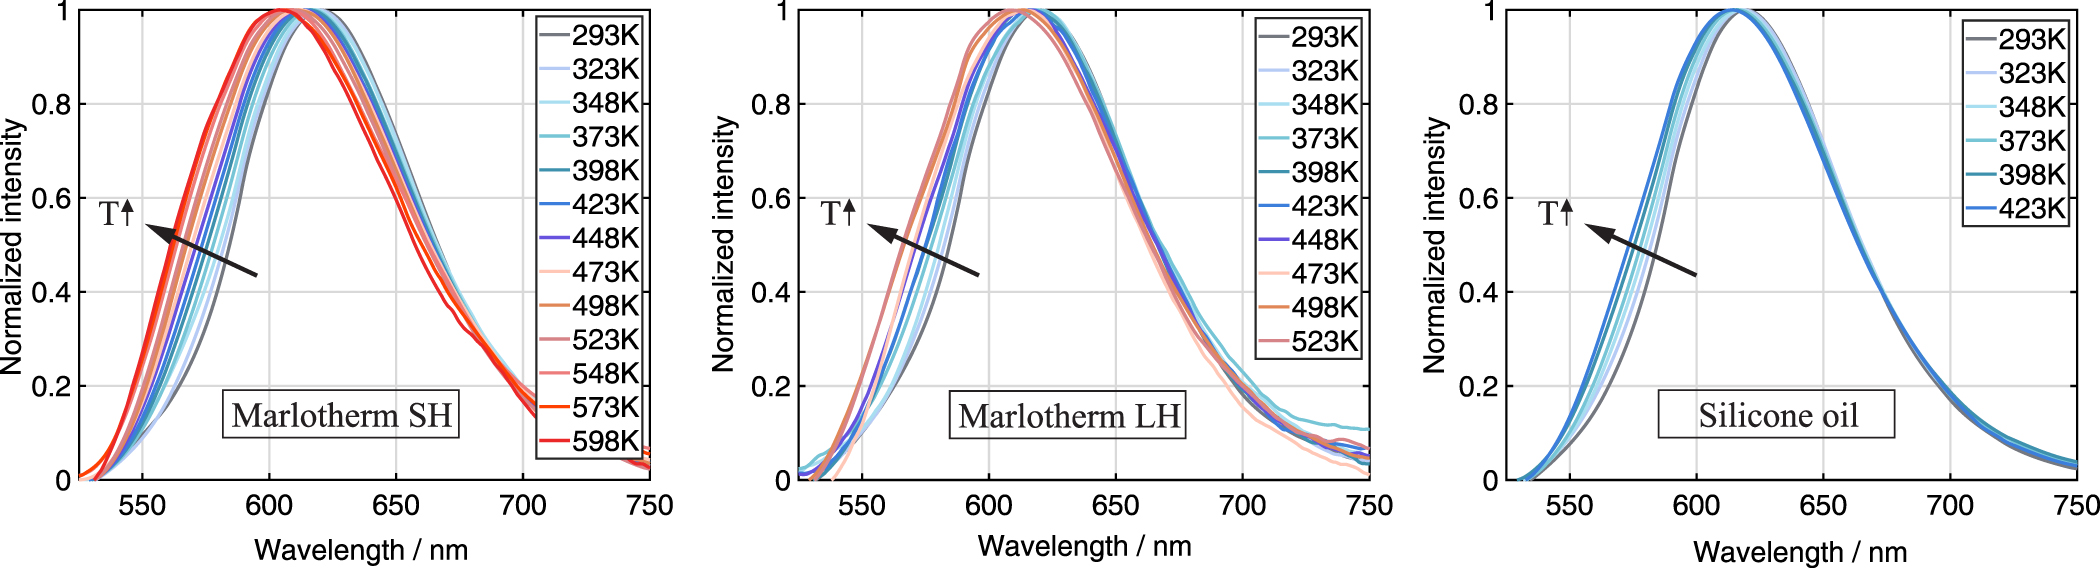
The recorded temperature-dependent luminescence emission spectra of SCASN:Eu2+ dispersed in the different heat transfer fluids are presented in figure 11. The emissions were all acquired at ambient pressure for a temperature interval of 25 K in a range from 293 K to 598 K for SCASN:Eu2+ dispersed in Marlotherm SH, between 293 K and 523 K for SCASN:Eu2+ dispersed in Marlotherm LH and in a temperature range between 293 K and 423 K for SCASN:Eu2+ dispersed in silicone oil. The temperature ranges were selected according to the manufacturer's specifications for the fluids' operating conditions. Normalization of all luminescence emission spectra shown was performed to the maximum value at each temperature. For all three fluids SCASN:Eu2+ showed a broadband emission and the peak was centered at about 620 nm as expected according to [19]. With increasing temperature, a broadening of the emission band and a shift towards smaller wavelengths were observed. The crystal field has a strong influence on the position of the lower 5d state at the 5d-4f transition of Eu2+. Consequently, isotropic thermal expansion might have a complex effect on the position of the emission peak and could explain the blue shift of the temperature-dependent emission spectrum [8, 19]. In general, the broadening of the emission band is due to the fact that higher vibrational levels of the excited state (as well as the ground state) are stimulated with increasing temperature [56].
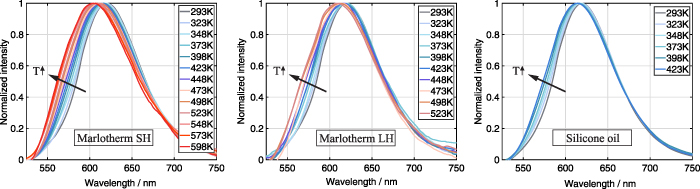
Figure 11. Temperature-dependent luminescence emission of SCASN:Eu2+ dispersed in Marlotherm SH, Marlotherm LH and silicon oil after 532 nm excitation at ambient pressure. Temperature ranges from 293 K to 598 K, fluence: 24 mJ cm−2. All spectra are normalized to the maximum peak at each temperature.
Download figure:
Standard image High-resolution imageFigure 12 shows the intensity ratios for the SCASN:Eu2+ dispersed in the different fluids based on the spectral emissions given in figure 11. The three intensity ratio curves indicate a steep rise over the whole measured temperature range from 293 K to 598 K. Furthermore, they are all within the displayed standard deviations in an almost similar range for the respective temperature level. In summary, the intensity ratio is independent of the fluid surrounding the SCASN:Eu2+, allowing fluid independent temperature measurements. The slightly increasing standard deviations with increasing temperature are caused by the lower signal levels. In general, a fit of the intensity ratio of two thermally coupled levels can be made according to the Boltzmann distribution law shown in equation (2). For this reason, the temperature-sensitive intensity ratio was calculated according to equation (3) from the ratio of integrated phosphorescence emissions based on an emission band from 550 nm to 700 nm and a second band from 637.5 nm to 662.5 nm. Various emission bands were analyzed in advance with respect to the maximum temperature sensitivity of the SCASN:Eu2+ dispersed in the fluids, and the bands presented were selected because they exhibited optimal values. The same emission bands were selected for all heat transfer fluids.
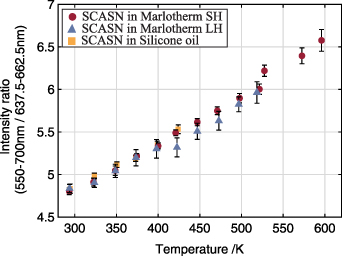
Figure 12. Temperature calibration curve of the SCASN:Eu2+ phosphor dispersed in Marlotherm SH, Marlotherm LH and silicone oil from 293 K to 598 K at ambient pressure. Excitation with a 532 nm pulse laser, fluence: 24 mJ cm−2 and delayed acquisition 70 ns after the laser pulse. The ratio is calculated based on an emission band from 550 nm to 700 nm and a second band from 637.5 nm to 662.5 nm. Error bars correspond to the standard deviation.
Download figure:
Standard image High-resolution imageThe relative sensitivity calculated according to equation (4) is in the range between 0.12% K−1 and 0.09% K−1 for Marlotherm SH, and between 0.11% K−1 and 0.09% K−1 for Marlotherm LH and silicone oil. The maximum relative sensitivity is always reached at 293 K and then decreases constantly. For comparison, the relative sensitivity of phosphor thermometry in liquids (temperature range between 293 K and 333 K) performed with SMP:Sn2+ was 0.6% K−1 and 0.24% K−1 when BAM:Eu2+ was applied [45].
Using equation (5) the maximum temperature precision based on the observed standard deviations is about 2.6 K for Marlotherm SH, 5.4 K for Marlotherm LH and 2.8 K for silicone oil, each at ambient temperature. For comparison, the temperature precision at 300 K was 4.0 K for SMP:Sn2+ and 7.3 K for BAM:Eu2+ when used in liquids [45]. In comparison, our system shows a slightly weaker performance, but excitation of SCASN:Eu2+ was performed at a wavelength of 532 nm, which is clearly advantageous for the present and certainly some other applications.
5.4. Temperature-dependent decay time and sensitivity of the phosphor
Decay times for the PDT method were recorded under the same conditions as the emission spectra described in section 5.3. Two recorded temperature-dependent phosphorescence decay curves of SCASN:Eu2+ dispersed in Marlotherm SH are shown as an example in figure 13. The decay curves are normalized and plotted on a logarithmic scale to clearly reveal deviations from single exponential decay. In general, a bi-exponential decay behavior was observed for SCASN:Eu2+ dispersed in the fluids as described in the literature [19]. An evaluation of the bi-exponential decay behavior with a bi-exponential fit showed a relatively temperature-independent behavior of the second decay region. Since only the first decay shows a temperature-dependent behavior, only this section was evaluated in the following according to equation (7) using an intensity threshold fit window as proposed by [54, 55]. The lifetime was fitted using a Levenberg–Marquardt nonlinear least square regression method and a fit window between 80 ns and 500 ns after the maximum signal intensity.
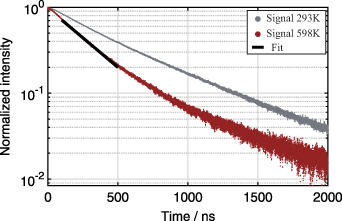
Figure 13. Temperature-dependent phosphorescence decay of SCASN:Eu2+ dispersed in Marlotherm SH after 532 nm excitation at ambient pressure. Temperatures: 293 K and 598 K. Fluence: 24 mJ cm−2. Signal was detected with a PMT and was fitted using the Levenberg–Marquardt nonlinear least square regression method.
Download figure:
Standard image High-resolution imageIn figure 14 the temperature-dependent decay time constant τ of SCASN:Eu2+ dispersed in the fluids after pulsed excitation at 532 nm and broadband detection using a PMT is shown. The decay times of all fluids were acquired at ambient pressure for the respective temperature intervals. The determined decay time constant represents an average of 50 individual measurements. The repeatability of the PMT is in the range of ±3% of the average value of the decay time. The SCASN:Eu2+ shows a decay time constant of about 520 ns for temperatures between 293 K and 423 K for all fluids. This is also in good agreement with data from Hertle et al [19], who obtained a similar value for bulk powder and coating measurements at room temperature. The calculated lifetimes are also in good agreement with the data of CaAISiN3:Eu2+, which were also obtained using a PMT [57]. Between 423 K and the maximum considered temperature of 598 K, a strongly temperature-dependent decrease of the decay time is observed, which can be used for the temperature measurements. This behavior is consistent with the literature, as non-radiative processes increase with increasing temperature, resulting in a shorter lifetime.

Figure 14. Decay time constants of SCASN:Eu2+ phosphor dispersed in Marlotherm SH, Marlotherm LH and silicone oil from 293 K to 598 K at ambient pressure. Excitation with a 532 nm pulse laser, fluence: 24 mJ cm−2 and delayed acquisition 70 ns after the laser pulse. The lifetime was fitted using a Levenberg–Marquardt nonlinear least square regression method and a fitting window between 80 ns and 500 ns after the maximum signal intensity. Error bars correspond to the standard deviation of 50 single measurements.
Download figure:
Standard image High-resolution image
The resulting decay times of SCASN:Eu2+ dispersed in the different fluids are all within the indicated standard deviations in an almost similar range for the respective temperature levels. The relative sensitivity calculated according to equation (4) for temperatures above 423 K is in the range between 0.06% K−1 and 0.56% K−1 for Marlotherm SH, between 0.04% K−1 and 0.49% K−1 for Marlotherm LH and around 0.08% K−1 for silicone oil. The maximum relative sensitivity for every fluid is always reached at the highest investigated temperature. The different sensitivities can be attributed to the different standard deviations. Using equation (5) the minimum value for temperature precision based on the observed standard deviations is about 1.3 K for Marlotherm SH, 2.4 K for Marlotherm LH and 9.0 K for silicone oil, in each case at the highest temperature considered. As a consequence of the results shown, the decay time method is better suited for temperature measurements above 423 K for the applications shown due to its higher precision.
6. Conclusion and outlook
In the present work, to the best of our knowledge, the phosphor SCASN:Eu2+ was characterized for the first time with respect to its suitability for phosphor thermometry in heat transfer fluids and LOHC systems. In order to detect interference of the fluorescence of the liquids with the temperature marker signal, the absorption and emission characteristics of Marlotherm SH, Marlotherm LH and silicone oil were investigated first.
To avoid unwanted strong absorption and to reduce fluorescence of the heat transfer fluids, an excitation wavelength of 532 nm was used for the investigations. Absorption measurements showed strong absorption below 300 nm for all three fluids at ambient temperature, with absorption cross sections in the order of 2 × 10⁻²² cm2 for silicone oil and 4.5 × 10⁻²² cm2 for Marlotherm SH. Between 300 nm and 400 nm, the absorption cross section decreased for all heat transfer fluids, and above 400 nm only Marlotherm SH showed significant absorption. The temperature-dependent absorption studies showed that excitation of the phosphor particles at 532 nm was associated with low absorption for all fluids.
Upon 532 nm excitation, Marlotherm SH and Marlotherm LH showed a temperature-dependent broadband fluorescence signal in the wavelength range between 500 nm and 800 nm with an emission peak centered at about 580 nm. Neither a shift in the peak nor a broadening of the signal was visible with increasing temperature. Since the emission of the phosphor material SCASN:Eu2+ is broadband and the peak is centered at 620 nm, signal overlap occurs and the phosphorescence signal must be detected with a time delay. After measuring the temperature-dependent decay times of the heat transfer fluids and taking into account potential jitter of the laser and detection system a delay of 70 ns turned out to be reasonable for this purpose.
The results obtained for the PIR and the PDT measurements show for the two-color method a usable temperature range between 293 K and 598 K with a maximum relative sensitivity of 0.12% K−1 and a minimum temperature precision value based on the observed standard deviations of about 2.6 K at 293 K. For the decay time method, the phosphor allows measurements between 423 K and 598 K with a maximum relative sensitivity of 0.56% K−1 and a minimum temperature precision value of about 1.3 K at 598 K. Consequently, the decay time method is the preferred technique for thermometry at elevated temperatures.
Based on these results, our future work targets planar temperature measurements to evaluate heat transfer phenomena. A particular focus will be on the application of the PDT method with SCASN:Eu2+ to determine temperature fields during endothermic hydrogen release from LOHC systems. The here-presented study of the fluids Marlotherm SH and Marlotherm LH, which are the hydrogen-lean components of the respective LOHC systems, is a necessary prerequisite for these future investigations, which promise great potential for the development of reactor and process optimization strategies as well as for the validation of reaction engineering models.
Acknowledgments
This work has been funded by the Bavarian State Ministry of Economic Affairs, Regional Development and Energy through the Helmholtz-Institute Erlangen-Nürnberg for Renewable Energy (HI ERN). We also acknowledge funding of the Erlangen Graduate School in Advanced Optical Technologies (SAOT) by the Bavarian State Ministry for Science and Art. Furthermore, we thank our colleagues Dr Andres Osvet (i-Meet), Thomas Dressel, Peter Demmelmeyer and Silvan Keim at LTT for supporting the measurements.
Data availability statement
The data that support the findings of this study are available upon reasonable request from the authors.