

Abstract
In this work a range resolved interferometry (RRI) instrument for absolute distance measurements is integrated into a wire + arc additive manufacturing (WAAM) system to provide in-process monitoring of layer height, and prospects for volume and profile monitoring are discussed. In this experiment titanium feedstock was used to create a 150 mm long, 13.5 mm high wall comprised of 11 WAAM deposited layers. The RRI in-process measurements are in very good agreement ( 0.05 mm) with both mid-process, on-machine micrometre measurements taken by hand after each WAAM deposition, and post-process laser scanning measurements of the completed wall. The high depth of field allows direct referencing of the layer height measurements to the build plate making the measurement independent of the motion system and build plate bending, considerably lowering uncertainties. This, together with the capability for cost-effective in-process measurements in harsh environments, should make the proposed approach very interesting for routine use in WAAM systems.
Export citation and abstract BibTeX RIS

Original content from this work may be used under the terms of the Creative Commons Attribution 4.0 license. Any further distribution of this work must maintain attribution to the author(s) and the title of the work, journal citation and DOI.
1. Introduction
In this publication in-process absolute distance measurements provided by the range resolved interferometry (RRI) technique [1] are applied to wire + arc additive manufacturing (WAAM) to determine the layer heights after successive depositions. Additive manufacturing technology offers reduced costs and increased design freedom compared to solid billet or forging techniques [2, 3]. In WAAM a series of deposited layers are laid down atop one another to build up a wall or a part, previously including titanium aircraft spars and landing gear assemblies, and wind tunnel models for rapid prototyping [2–4]. WAAM uses an electric arc torch as a heat source, wire feedstock, and a motion system which will typically either be a robotic arm or a 3-axis computer numerical control (CNC) machine. Titanium requires an inert atmosphere for the arc torch WAAM deposition process so an airtight enclosure must be used [2, 3]. These features combine to result in relatively low capital cost for WAAM (circa  200k) [3, 4], part size limited only by motion system range and the airtight enclosure volume, moderate wire feedstock costs (
 100–250/kg for titanium) with easy handling compared to powder feedstock [3, 4].
In-process monitoring is required to maximise the benefits of WAAM [2]. With in-process monitoring for quality assurance, if a defect that will require scrapping the part arises early in deposition, the part can be scrapped immediately, saving the feedstock and time (and hence implicitly staff and capital costs) that would be wasted if the part failed quality assurance after it was completed. Further, the use of in-process monitoring for process control offers the opportunity for the process parameters (for example arc torch temperature, wire feed speed, the speed the arc torch is moved by the CNC system) to be adjusted according to the conditions to prevent defects arising, or to repair a minor defect in the previous layer by adjusting the deposition parameters of the next layer [4–7].
The layer height of the WAAM deposited material is a critical parameter [8]. The amount of material deposited in a layer is determined by the wire diameter and its feed speed, with the height and shape it adopts atop the previous WAAM depositions determined substantially by how quickly it cools from molten to solid. This is in turn determined by the thermal conductivity of the previously deposited layers, which is itself dependent on the height and shape of those layers [4, 6, 7, 9]. In this way the height of future layers depends on the height of past layers allowing minor defects to grow into significant ones [4, 5].
Conventionally the arc torch is lifted by a step height after each completed layer, with the extent of the lift either assumed based on the deposition parameters or measured by hand using a micrometre if glove access to the enclosure is available [5, 8]. Such measurements can be at no more than a few locations on the part, and these locations will be inconsistent from layer to layer. Therefore reliable measurements of layer height are important for in-process quality assurance and critical for WAAM in-process control [4, 7]. Takushima et al determine a target accuracy of ±0.15 mm for distance from the arc torch and wire feed to the meltpool, in order to avoid droplets or stubbing during the deposition which would degrade the surface quality potentially leading to defects developing [8].
Optical systems have been demonstrated to be a powerful tool for monitoring WAAM processes [4, 6, 7, 10]. Passive camera-based systems have been shown to achieve measured height resolutions of approximately 0.04 mm [4, 6, 7, 11, 12] but require significant image analysis and processing time limiting their applicability for process control. Laser profiling systems have achieved similar resolutions [8, 13] with simpler post-processing (although they can be sensitive to distortion of the laser beam due to surface roughness [8]), and in any case require angular separation between the illuminating laser and the detector increasing the required size of the WAAM head unit significantly [4, 8], leading to difficulties with integration into gas shielding devices. Interferometric techniques (including RRI) offer illumination and detection from an instrument mounted at a single location and are hence more easily integrated into mounting structures. Optical coherence tomography (OCT), an interferometric technique conceptually similar to RRI, has been widely applied to welding research [14–17], although in these implementations the ability of OCT to image structure within turbid materials [10] such as human skin is not utilised as the light cannot penetrate the metal surface. OCT can in principle achieve 0.01 mm but typically has a working range of only a few millimetres (compared to up to 10 s of cm for RRI). The limited working range of OCT system therefore does not allow the self-referenced wall height determination demonstrated in this work using the RRI approach. Furthermore, typical swept source (or broadband source plus spectrometer) OCT systems for material processing applications are sold at a cost of approximately  100k, which would compromise the low-capital-cost advantage of WAAM when used in production systems. For OCT system, the complex laser source typically used makes up a significant part of the component cost, and here RRI, with its use of a cost-effective monolithic laser diode from the telecommunication industry and other low-cost fibre components, compares very favourably.
Interferometry as a coherent optical technique offers a straightforward in-process measurement even in the harsh titanium WAAM environment, as compared to non-coherent techniques based either on laser profiling or camera vision systems. WAAM using titanium, as undertaken in this publication, represents a particular challenge for optical techniques due to the high level of specular reflection (the material is shiny). This leads to bright reflections of light from the arc torch that can confuse the algorithms interpreting passive camera systems, and directly reflect the light from actively illuminated systems away from the detectors [4]. Interferometric techniques such as OCT and RRI are less affected by this as they utilise phase information which can be extracted from scattered light even at low intensities and the coherent operating principle results in strong rejection of signals due to the non-coherent arc light. Due to the coherent operating principle both OCT and RRI (unlike camera and laser profiling systems) allow for straightforward in-process measurements, which by removing a second post-process measurement pass provides major productivity benefits.
In general in-process measurement systems for WAAM operate behind the arc torch [8], providing an immediate quality assurance measurement on the WAAM deposition, albeit one before the layer has fully cooled to the inter-layer-deposition temperature. From a process control point of view this results in a map of the entire deposition which can then be used to plan the next layer. This stepwise approach is disadvantageous as the CNC or robot arm motion system must precisely repeat the x and y motions used to capture the map when following the plan for the next deposition, whilst at a different z-position. This is particularly difficult for robot arms where x, y and z are not independent [18] although sensors have been proposed to monitor and correct robot arm end-effector position and velocity [19]. For many in-process monitoring implementations this stepwise approach is necessary as significant processing time is required to create the map from the in-process measurement [8]. RRI (and OCT) are straightforward techniques requiring minimal data processing. Thus the instrument can measure the surface to be deposited upon in-process a few centimetres in advance of the arc torch, in principle allowing adjustment of the WAAM deposition parameters to the conditions of that surface in near real time. This also provides fully cooled quality assurance measurement a few centimetres in advance of the arc torch deposition, although this does require a final, on-machine measurement pass without WAAM deposition for quality assurance of the completed wall.
In this paper we first introduce the RRI technique and its implementation within the WAAM system. Then results from a series of layers building a wall on a single axis with the arc torch following the RRI instrument are shown and compared with independent reference measurements, before concluding the paper with a thorough discussion. This publication represents the first laterally scanned use of this technique (with a galvanometer mounted turning mirror), and the first use of this technique with titanium. A novel feature of RRI in comparison to other techniques (such as OCT) is the high depth of field allows direct referencing of the layer height measurements to the build plate making the measurement independent of the motion system and build plate bending, considerably lowering uncertainties.
2. Principle of operation
2.1. Range resolved interferometry (RRI)
The RRI technique deployed here is conceptually similar to and derived from OCT but is tailored, through the use of different processing algorithms, to the use of much more cost-effective, monolithic laser diodes. The underlying principles of RRI have been reported in [1, 20, 21]. In brief the technique comprises the sinusoidal optical frequency modulation of a low cost diode laser, fibre coupled delivery and collection of light reflected from the target (layer surface), and interference of that light with light reflected from the fibre tip which serves as a reference. Demodulation of the interference signal using a smooth window function gives a sinusoidal signal, with the frequency of the sinusoid giving the position of the light reflected from the target as referenced to the fibre tip position, and the amplitude of the sinusoid indicating the brightness of the reflection. Sinusoids with amplitudes greater than a particular limit are considered to correspond to valid reflections (as opposed to detector or laser noise), and their centre position along the laser beam, relative to the fibre tip position, is recorded. Distance resolutions of typically 0.01 to 0.1 mm have been reported previously [20], including for WAAM in a very early version of this approach on steel and without laser beam scanning [21]. Furthermore, RRI phase measurements are used in other areas such as fibre optic sensing [22] or precision metrology [23].
2.2. Use of scanned RRI with CNC motion system
The RRI instrument provides a data rate of 3.2 kHz, the data output is the distance along the laser beam from the fibre tip at which reflection occurred at each instance, plus the signal amplitude and galvanometer scan angle (equivalent to angle θ as shown in figure 1). The distance from the galvanometer mirror to the reflection, and the galvanometer angle, essentially give the position of the reflection in polar co-ordinates which can be converted to Cartesian co-ordinates relative to the RRI head unit using the geometrical relations given in equations (1a )–(1c ):


Figure 1. Outline of scanned range resolved interferometry technique for 2D implementation. Angle θ is the galvanometer angle, d is the length from galvanometer mirror to the target, and dm
is the length from the galvanometer mirror to the fibre tip. The RRI instrument measures  , i.e. the length from fibre tip to the target. xR
and zR
are the axis in the co-ordinate space of the RRI head unit. A non-motorised turning mirror is used to direct the beam on the y-axis, and is set to ensure the y-axis value is zero (i.e. that the beam exists in the flat plane of the diagram).
, i.e. the length from fibre tip to the target. xR
and zR
are the axis in the co-ordinate space of the RRI head unit. A non-motorised turning mirror is used to direct the beam on the y-axis, and is set to ensure the y-axis value is zero (i.e. that the beam exists in the flat plane of the diagram).
Download figure:
Standard image High-resolution imagewhere θ is the galvanometer angle, d is the length from the galvanometer to the reflection, and dm
is the fixed length between the galvanometer and the fibre tip. The length dm
can be calibrated precisely using the RRI instrument itself by turning the galvanometer mirror to reflect the light directly back to the fibre tip. This equation is valid in two-dimensional cases (x-axis and z-axis, across the wall and vertically), and the non-motorised turning mirror is calibrated such that the beam is angled vertically (so long as the galvanometer mirror angle θ is zero) and components on the y-axis (along the wall) do not exist (i.e. the 2D diagram shown in figure 1 describes the physical situation). The RRI instrument output thus becomes a point cloud where each point corresponds to a reflection occurring at a particular spatial location and a particular time, given by an array of values ( ). In this implementation the y-value is always zero but has been included as it will later be combined with the yC
position of the CNC system (and to support future 2D scanning applications). The (
). In this implementation the y-value is always zero but has been included as it will later be combined with the yC
position of the CNC system (and to support future 2D scanning applications). The ( ) spatial positions in the point cloud are relative to the position of the RRI head unit mounted on the CNC bracket. The time value (tR
) recorded by the RRI instrument is used to combine these with the pre-programmed position of the CNC system (
) spatial positions in the point cloud are relative to the position of the RRI head unit mounted on the CNC bracket. The time value (tR
) recorded by the RRI instrument is used to combine these with the pre-programmed position of the CNC system ( ) in the fixed co-ordinate space of the build platform giving a point-cloud of (
 ) reflection positions and times. The time synchronisation and co-ordinate adjustment are performed in post-processing, although for more complex movements either of the CNC motion systems or robotic arms integration of the motion system position reporting with the RRI instrumentation is desirable. This is the subject of ongoing work.
3. Experimental work
3.1. Range resolved inteferometry instrument
An enclosed, portable prototype RRI instrument similar to those previously described in [22, 23] was constructed, with the addition of a galvanometer driver time synchronised to the RRI acquisition to allow the beam to be scanned across a range of angle (θ in figure 1). The use of these elements made the instrument robust enough to be installed on a WAAM CNC motion system. Custom 5 m galvanometer cables and 5 m steel armoured fibre optic cables were used, providing sufficient length for installation of the RRI sensing head on the CNC motion system within the enclosed bubble (to be argon purged) whilst the RRI prototype instrument remained outside (see figure 2).
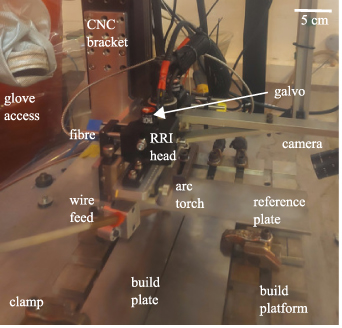
Figure 2. Annotated picture of setup prior to WAAM deposition. The photograph is taken through the airtight enclosure bubble. 5 cm scale bar is shown top right.
Download figure:
Standard image High-resolution imageAn RRI head unit was constructed from commercially available parts and a custom bracket was fabricated copying the standard mounting of the arc torch, wire feeder and Xiris camera whilst accommodating the RRI head unit, pictured in figure 2. The approximate distance between the RRI head and the build plate was 200 mm, a working distance comfortably accommodated by the RRI instrument. The RRI head unit comprised of an antireflection coated collimator (Thorlabs CFC5-C) used to collimate and weakly-focus the beam. This was cage-mounted to a two-axis galvanometer mounting block (Thorlabs GCM102-M), in which one galvanometer with silver turning mirror (Thorlabs GVS001) and one non-motorised high-quality 10 mm diameter,  flatnes silver turning mirror (Newport optics) on a standard Thorlabs half-inch mounting post were installed. The open port of the mounting block was sealed with a 3 mm thick, 50 mm diameter window of BK7-glass (also antireflection coated) preventing any ingress of spatter or fumes from the WAAM deposition process.
3.2. RRI calibration procedure
The RRI head unit was installed on the WAAM CNC system bracket, and a flat silver mirror was placed on the build platform. The galvanometer (scanning the beam in the CNC system x-axis, across the wall) and the non-motorised turning mirror (angling the beam in the CNC system y-axis, along the wall) were preliminary aligned close to the vertical position, first by ensuring the beam returned along its original path, then by maximising the returning RRI signal. The titanium build plate to be used was then clamped to the build platform. The collimator was adjusted to be weakly focused on the build plate position. The galvanometer was then turned such that it reflected the RRI beam directly back to the collimator, allowing the component of the distance from the collimator to the galvanometer mirror to be measured directly. The build plate was then replaced with a near-infrared (NIR) camera with 20 dB optical density attenuation but without other focusing optics (essentially a flat detector).
The NIR camera was necessary to quantify the beam focus, to ensure the non-motorised mirror was aligned to y = 0, and the galvanometer was aligned to x = 0 when θ = 0 (i.e. the beam came vertically down from the RRI head unit). To achieve this the position of the beam on the detector was identified. Then CNC x-axis and y-axis adjustment were used to move the beam and the x-axis and y-axis orientation of the NIR camera adjusted to match. The beam was then centred on the camera and the CNC z-axis stage was adjusted. If the beam moved across the surface of the detector, this indicated that the beam was angled in that axis. The galvanometer zero position, and physical position of the non-motorised y-axis mirror, were adjusted until the beam remained centred as the CNC z-axis stage moved. This fine-tuned the vertical alignment of the beam. The NIR camera also produced a cross-section of the beam profile at the detector. The CNC z-axis stage was then again adjusted to allow beam profiles to be taken at a range of distances along the beam from the collimator. This served two purposes: First, to determine the diameter of the beam at focus (the beam waist, 0.015 mm), and the z-axis length it took for that beam waist to double in size (giving depth of field of 200 mm). Second, recording the position of these profiles allowed the extent of x and y axis isolation to be determined to be 1:1 000 000 (i.e. a 1 m z-axis move would result in approximately 0.001 mm x-and y-axis displacement).
3.3. WAAM and CNC system equipment
The WAAM CNC system comprised three stages aligned in the z, x and y axis each with a total travel of 300 mm, controlled by computer using a script in the python software language. The y-axis stage is mounted suspended approximately 1 m above the build platform, the x-axis stage is mounted to the y-axis stage and the z-axis stage is mounted to the x-axis stage, hanging down over the build platform (see figure 2). Attached to the z-axis stage was a fixed bracket serving as a mounting for the arc torch, wire feeder, RRI sensing head and a Xiris XVC-1000 welding camera. The arc torch was powered by a TransTig 5000 plasma welding power source, controlled using start-deposition and stop-deposition commands embedded in the python script. The source was programmed to operate with a 13.5 A pilot arc, striking at an arc current of 64 A and rising to an operational arc torch current of 160 A over 1.5 s, with a wire feed rate of 1.6 mm s−1 (the CNC motion system provided a WAAM deposition speed of 3 mm s−1 using the y-axis stage only). The wire feeder is angled at 30∘ vertically to the build plate and 15∘ to the CNC motion system y-axis (along the wall) so as not to block the RRI beam. The wire used was Titanium 64 of size 00.0472 (diameter 1.2 mm meeting specification AMS4954K). A TI64 build plate was secured to the base plate using four robust bolt-driven clamps. An additional steel plate was bolted in position near (but not touching) the build plate such that its edge provided a fixed position reference unaffected by any bending of the build plate due to the WAAM deposition. The system was enclosed in a bubble which was purged with argon gas to maintain an oxygen level of below 1500 ppm during the deposition, sufficient to prevent oxidization of the titanium during the WAAM process.
3.4. WAAM deposition and measurement process
The physical build geometry is shown schematically in figure 3, and a time series of the z-axis positions measured by the RRI instrument is shown in figure 4, with layer five being chosen as an example. Videos of the actual WAAM depositions recorded by the Xiris camera which capture these actions are available in the supplementary materials. It is recommended to watch one before reading the following paragraph. To begin building the planned wall, the python script controlling the WAAM CNC system was started, returning the x-, y-, and z-axis stages to their home position, then moving them to a pre-programmed initial position 80 mm behind the start-deposition position on the y-axis (along the wall), figure 4 point (A). This allows the RRI head unit, positioned ahead of the arc torch on the bracket, to measure the start-deposition position. During this move both the Xiris welding camera and RRI instrument recording were started. The CNC motion system and RRI instrument are not time-synchronised so an z-axis (up-down) motion of 6 mm at a speed of 3 mm s−1 was performed (figure 4 point (B)) to put a detectable trough in the RRI measurement to allow time synchronization of CNC python control script and RRI measurement. The CNC motion system moved at a speed of 3 mm s−1 along the y-axis to the start-deposition position, allowing the RRI instrument to detect both the edge of the steel position-reference plate (figure 4 point (C)) and the titanium build plate (point (D)). The start-deposition position (figure 4 point (E)) was predetermined to place the tip of the arc 8 mm above the build plate. Once the start-deposition position was reached the arc was struck, and a 5 s wait occurred to allow operating current to be reached and the meltpool to form. The WAAM CNC motion system then moved at 3 mm s−1, feeding titanium wire into the meltpool on the build plate which solidifies into a deposited layer as the arc torch moves on, until the full length of 210 mm was travelled (figure 4 point (F)), and the arc torch was disengaged. There was a 10 second pause to allow for a check that the wire had properly retracted (that the wire feeder attached CNC bracket had not welded itself to the build plate), then the CNC motion system continued at a speed of 3 mm s−1 for a further 80 mm allowing the RRI instrument to measure the end of the build plate (figure 4 point (G)) onto the build platform (point (H)). The CNC motion system then returned to the home position. In addition to measurements taking during the WAAM deposition process, the CNC motion system was used to perform both a dry-run pre-deposition and a post-deposition RRI measurement following the same program except that the arc was not struck. Typical measurements for described motion programme are also shown in figure 4, which also demonstrates measurements over a total depth range  40 mm, however, while not shown here measurements over depth ranges 100 mm and above are also deemed possible using the RRI system.

Figure 3. Diagram (not to scale) showing the build geometry and WAAM CNC mounting bracket (attached to the CNC z-axis motion stage, itself suspended from above) holding wire feed positioner, arc torch and RRI head unit. The CNC motion system home position, far above and to the right of the build plate, is shown. An RRI time series recorded during the deposition of the sixth layer (and therefore measuring the fifth layer ahead of the arc torch and WAAM deposition) is shown in figure 4. The diagram is shown from the side, i.e. from the perspective of the camera shown in figure 2.
Download figure:
Standard image High-resolution image
Figure 4. In-process RRI time series of layer five recorded during deposition of the sixth layer. The z-axis values show the reference plate (A), the v-shaped trough (B, added by CNC motion system rather than a real feature of the target), the build platform (C) beneath the build plate, the build plate (D) continuing through the start of the wall (E), since the plot shows the point cloud at all positions across the wall, see figure 5), the end of the wall (F) and the end of the build plate (G), and the build platform (H). The signal levels indicated by I and J represent measurement of the wall and build plate at different galvo scan angles (figure 5 occurs across points I and J. Isolated points between the wall top and the build plate correspond to intermittent measurement of the sides of the wall.
Download figure:
Standard image High-resolution imageThe height of the wall was measured using a micrometre via glove access into the enclosed, argon purged bubble, and the python script controlling the WAAM CNC motion system was modified to raise the CNC bracket on the z-axis by the height of the layer, such that the tip of the arc would remain 8 mm above the surface as further layers of the wall were deposited. Temperature measurements were taken at the same time as the micrometre measurements using a contact heat probe and the inter-layer-deposition temperature was typically 45 Centigrade. This process was then repeated until eight layers of wall had been built, at which time the tail-off at the far end of the wall began to result in spattering of the molten titanium. To accommodate this the length of the layer deposition was shortened by 10–200 mm, and the post-deposition move lengthened by 10–90 mm, maintaining the total length of the move. A further three layers were deposited resulting in an eleven layer wall 12.5 mm in height. The completed wall was removed from the WAAM system then sampled using a Romer RA7325SI repeatable measuring arm and reflection based laser scanner to 0.07 mm accuracy.
4. Data analysis and calibration
4.1. Single galvanometer scan
The ( ) values for two single scans of the galvanometer are shown in figure 5 for the pre-deposition build plate, and the fifth layer. The galvo scan occurred 50 s into the measurement, which corresponds to a y-axis position along the wall of 136 mm once calibrated using the procedure discussed below. The data rate was 3.2 kHz and the galvanometer frequency was 25 Hz with an angular amplitude of 4.8∘. The angular amplitude could be increased if necessary to provide better build plate coverage for higher, broader or curved walls. For the 124 points of the build plate measurement the z-axis height standard deviation was 0.046 mm, due to a small initial bend in the right hand side of the build plate from y = 0 to y = 4 mm. Considering only the points on the build plate from
  to y = 0 mm there were 60 points with a standard deviation of 0.014 mm. Therefore only the left side of the build plate around
  mm will be considered and later used as a reference. For the layer five measurement, the z-axis height standard deviation of the 15 build plate points centred around −4 mm on the y-axis was 0.012 mm. The standard deviation of the 29 captured points of the wall surface was 0.097 mm, likely as there is physical slumping towards the edges of the wall. Considering only the 12 points most directly atop the wall gives a standard deviation of 0.015 mm. These results are in agreement with an expected RRI resolution of 0.01 mm theoretically achievable by the instrument for good quality surfaces [1, 21, 22]. The steeper sides at the front and edges of the wall reflect too much light away from the instrument and fall below the detectable noise level (for optically rougher materials such as steel there will be less specular reflection and more scattered light from angled sidewalls and hence significantly improved coverage of the sidewalls from the RRI instrument [21]).
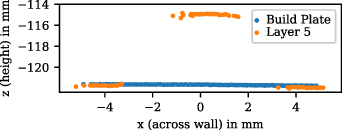
Figure 5. RRI z-axis heights and x-axis position captured for a single scan of the galvanometer. The build plate measurement was made on-machine in advance of the WAAM deposition, whilst the fifth layer measurement was made in-process during deposition of the sixth layer (since the RRI instrument is ahead of the arc torch), lasting 0.04 s and occurring 50 s into the measurement, corresponding to a y-axis position of 136 mm.
Download figure:
Standard image High-resolution image4.2. Timing synchronization
Both the python script controlling the WAAM CNC system, and the RRI instrument measurement, are started manually and therefore not automatically synchronized from measurement to measurement and deposition to deposition. A z-axis up-down motion of the CNC system prior to the WAAM deposition, measured as a v-shaped trough in the RRI data, which is used to synchronise the y-axis position calculation via a least-squares fit.
The ( ) data for the move of the CNC motion system is shown plotted, z-axis position against time, in figure 4, with the physical build geometry shown schematically in figure 3. The fifth layer measurement has been used. The x-direction position across the wall has been compressed into the two dimensions of the plot (i.e. all values shown in figure 5 appear at a single time), hence multiple z-direction heights can be seen at the same locations where different heights exist across the y-direction galvanometer scan, most notably when the wall and build plate are both detected.
4.3. 3D point cloud
The 3D point cloud ( ) of the eleventh, final layer is shown in figure 6, plotted using the data captured by the RRI instrument in the co-ordinate space of the build platform and post-process data captured using a Romer RA7325SI measurement arm mounted laser scanner in the co-ordinate space of the base of the measurement arm. The build plate with the wall was removed from the WAAM CNC system and secured to a flat table along with the RA7325SI measurement arm for this post-process measurement. In the RRI measurement the build plate and a portion of the substrate supporting it can be seen, along with the upper surface of the wall. In some locations along the wall a portion of the smooth slope at the end of the wall can be seen, but often due to the high specular reflectivity of titanium they cannot, as was the case in figure 5. In the RA7325SI measurement the same features can be seen more clearly, as the ability of the measurement arm to rotate around the wall allows the laser scanner to address the wall from different angles providing superior imaging of the sloped sides of the wall. More bending can be seen in the RA7325SI measurement than the RRI measurement, especially apparent in the bottom plot of figure 6, likely due to the release of the clamps used to restrain the build plate on the build platform in-process. As these clamps were installed to secure the build plate prior to WAAM deposition, they resist the bending of the build plate. The build plate is also secured for the RA7325SI measurement, but only sufficiently to prevent movement, not to apply significant bending forces.
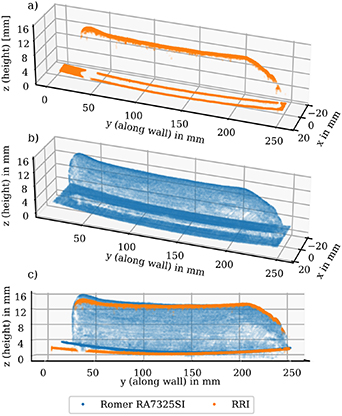
Figure 6. 3D point clouds measurement of the eleventh, final layer. Plot (a) is from the RRI instrument mounted on the CNC bracket above the wall and build plate. Plot (b) was recorded off-machine post-process using a Romer RA7325SI measurement arm mounted laser scanner able to address the wall from a variety of angles and distances. Plot (c) shows the two measurements together seen as a side view.
Download figure:
Standard image High-resolution image4.4. CNC system referenced wall height determination
In order to determine the height of the wall from the point cloud data, bins of 2 mm along the wall (y-direction) and 1 mm across the wall (x-direction) were defined. The median height (z-direction) of the points in each bin was determined and taken to be the value for that bin, although bins with fewer than ten points were rejected. Along the top surface of the wall (bins centred on  mm) each bin contained between 250 and 400 points, excepting those bins at the sloped ends of the wall, with the resolution improving proportionally to the square root of the number of points. This process was repeated for each measurement. Since the CNC motion system is raised for each successive layer in order to keep the arc torch a constant height above the wall, the known z-displacement of the CNC motion system is added to the heights recorded for that layer. Note that this introduces any error in the CNC motion system z-axis calibration into the measurement.
A cross section across the wall taken at y = 98 mm is shown in figure 7. Gaps in the data appear at the sides of the wall where the light from the RRI instrument is reflected away, rather than back towards, the RRI head unit, although the relatively shallow curve on the left flank of the first wall has been measured successfully. In order to determine the height throughout the WAAM deposition process, a similar cross-section has been performed along the length of the wall shown in figure 8, using the y-direction row of bins along the top of the wall (bin position centred on  mm, location marked in figure 7). The RRI beam is ahead of the arc torch, so the measurement is recorded whilst the subsequent WAAM deposition is performed, for example the first layer is recorded whilst the second layer is deposited. As the final layer, layer 11, has no subsequent deposition this measurement was captured by an additional run of the WAAM CNC system with the arc torch inactive (although it should be noted that if the RRI head unit were located behind the arc torch an initial, preliminary scan without deposition would have been required to capture the pre-deposition condition of the build plate).
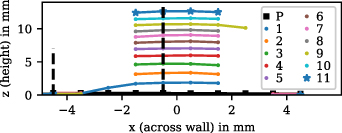
Figure 7. Wall and build plate height in the z-direction plotted against position across the wall in the y-direction. The legend indicates the number of the layer which was captured, with 'P' indicating the pre-deposition build plate. Each measurement was performed ahead of the arc torch during the subsequent deposition, in the co-ordinate space of the CNC system, and the arc torch height adjustment has been added to the z-direction value. Dashed lines at  and
and  indicate the center of the bins used to measure the wall and the build plate reference in figures 8–11.
Download figure:
Standard image High-resolution image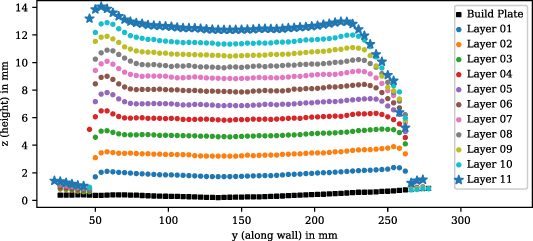
Figure 8. Wall height in the z-direction plotted against position along the wall in the y-direction. Each measurement was performed in-process ahead of the arc torch during deposition of the subsequent layer, and the arc torch height adjustment has been added to the z-direction value. As the final layer, layer 11, has no subsequent deposition this measurement was captured by an additional run of the CNC system with the arc torch inactive.
Download figure:
Standard image High-resolution imageA hump can be seen at the start of the wall in figure 8, likely because wire feeding begins momentarily before the start of the y-direction move of the CNC motion system along the wall, although the ability to continue to apply further deposited layers to the wall was not limited by this feature. Fine-tuning of the wire feeder settings is not relevant for the purpose of validating the RRI instrument for this application, and it is useful to know that the RRI instrument can identify this process error.
4.5. CNC system referenced build plate height determination
A similar cross section to that presented for the wall in figure 8 was performed for the build plate alongside the wall, for which the row of bins centred at  mm was used (4 mm across from the wall, position marked in figure 7). Substantial bending of the build plate, introducing 1 mm of height increase at the ends of the wall, is visible in both the wall-centre measurement beyond the end of the wall (figure 8) and in the build plate measurement alongside the wall (figure 9). It could be that the build plate had some initial curvature, or that the CNC machine follows a curved path along the y-direction motion (possibly due to dragging forces exerted by the titanium wire feedstock over the length of the motion). There is some evidence for these latter explanations in that curvature can be seen even in the measurement of the pre-deposition build plate in figure 5. It is likely there is also some thermally induced bending of the wall as additional layers are laid down, as the later layers appear more curved than the build plate did initially.
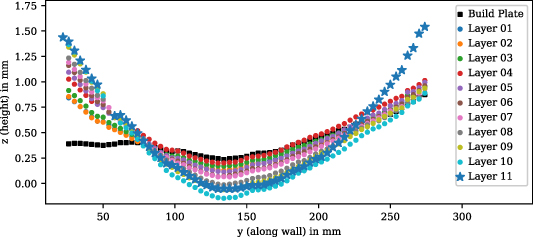
Figure 9. Build plate height in the z-direction plotted against position along the wall in the y-direction, for a measurement 4 mm alongside the wall. Each measurement was performed ahead of the arc torch during deposition of the subsequent layer, and the arc torch height adjustment has been added to the z-direction value.
Download figure:
Standard image High-resolution imageBending at y = 100 mm, one-quarter of the way along the wall and 4 mm across from it is comparatively less, leading to 0.5 mm of height increase appearing in figure 9. Changes in height can also be seen occurring at y = 150 mm (midway along the wall, and 4 mm across from it) but are largest for layers five and six extending to 0.3 mm of height increase, whilst by layer 11 the midway point of the build plate has returned to its original position prior to the first deposition. This may a real effect upon the build plate due to specific interaction between WAAM deposition thermally-induced bending forces and the particular clamping positions used, or it may an effect related to inconsistency in the CNC system positioning between measurements.
4.6. Self-referenced wall height determination
In order to compare to the reference measurements and assess the wall without the effects of build plate bending, the height of the build plate shown in figure 9 was subtracted from the height of the wall shown in figure 8. This also removes the requirement to account for the CNC motion system height making the measurement independent of CNC motion system-induced errors. The plot of these self-referenced measurements are shown in figure 10, along with micrometre reference measurements taken between the layer depositions. These measurements were taken with the micrometre resting on the build plate (i.e. referenced to the build plate) hence this is the appropriate comparison. The height uncertainty of the micrometre measurements is around 0.05 mm, significantly worse than the nominal micrometre accuracy of 0.01 mm, and the y-direction position accuracy along the wall is as low as 30 mm, due to the difficulty of obtaining repeatable measurements using gloves in an enclosed bubble. Eliminating this source of human uncertainty is a significant benefit of automated measurement techniques such as RRI. The post-process Romer RA7325SI laser scanner measurements, naturally only available for the final layer of the completed wall, were similarly compared from the centre of the wall to a position 4 mm away on the build plate, and are accurate to 0.07 mm considering position error both of the arm and the laser scanner. For both reference measurements the agreement between the RRI measurement and the reference measurement is noticeably better than the nominal accuracy of the reference measurements. This clearly shows the benefit of a self-referenced measurements that are possible due to the large depth-of-field of the RRI measurement approach. When comparing figures 8 and 10, it can clearly be seen that the influence of the build plate bending as a major source of error WAAM layer height measurements is eliminated.
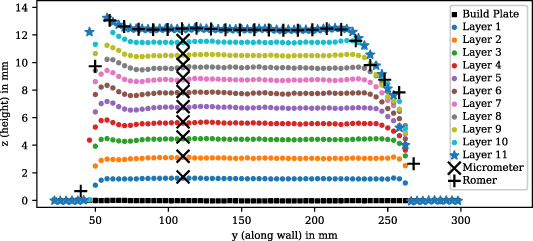
Figure 10. Build plate height in the z-direction subtracted from wall height in the z-direction, four millimetres apart across the wall, plotted against position along the wall in the y-direction. Micrometre reference measurements and Romer RA7325SI laser scanner post-process reference measurements are shown.
Download figure:
Standard image High-resolution imageThe height added to the wall by the initial layers is greater than that added by the later depositions. This agrees with theory, in that the initial layers cool quickly due to fast thermal transfer to the broad build plate and hence are quite steep, whilst later layers cool more slowly as they are thermally isolated by the height of the wall and hence have time to slump before hardening, adding less height to the wall. Similarly the built wall can be seen reducing in height towards the end. This is likely because at this location cooling can only occur back along the wall, hence increasing the hardening time and allowing for more slumping. As this effect compounds across multiple layers of WAAM deposition, the distance between the arc torch and the top of the wall increases, until spattering of the wire feed material begins to occur. In-process control using the RRI data could resolve this issue, but for this work the WAAM deposition was merely shorted by 10 mm for layers eight through eleven.
4.7. Repeatability
In order to assess the repeatability of the RRI measurements, pre-deposition, during-deposition, and post-deposition measurements were made for every layer. Hence there are three measurements of each layer (except the pre-deposition build plate and the final layer). The post-deposition measurement of the previous layer, the pre-deposition measurement of the current layer, and the measurement made ahead of the arc torch whilst depositing the current layer all record the previous layer. These on-machine pre-and-post deposition measurements were obtained by repeating the CNC system motion without activating the arc torch.
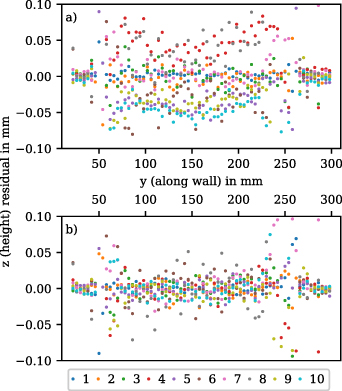
The mid-process pre-deposition measurement for the current layer was chosen as a reference, and the residual between this and the previous layer mid-process post-deposition measurement is shown in figure 11(a), and the measurement made during the in-process WAAM deposition of the current layer are shown in figure 11(b). Effectively these are the differences between pre-deposition, prior post-deposition and during-deposition measurements shown in figure 10. The in-process result is a perfect repetition of the CNC system motion, whilst the mid-process result includes a z-axis offset to maintain the arc torch height to the top of the wall for the next layer. In both cases the height of the build plate alongside the wall has been used to self-reference the height. In the in-process measurement figure 11(b), along the main length of the wall, the residual is approximately 0.025 mm at most, although this increases significantly at the sloped ends of the wall. This is due to a combination of a worse surface (from the point of view of an coherent measurement) generating more spurious point, and simultaneously generating fewer correct points resulting in worse averaging over the inherent noise of the instrument. There were between 250 and 400 points in each bin along the mid portion (y = 75 mm to y = 225 mm) of the wall surface. In the mid-process measurement figure 11(a) the residual is larger, approximately 0.05 mm at most, indicating that the self-referencing is not perfectly effective at removing z-axis CNC system motion. The residuals with low noise levels and without obvious bias in the mid-portions of the in-process measurements in figure 11(b) clearly demonstrate that the measurement quality is totally unaffected by the presence of the arc light in the proposed technique.
Figure 11. (A) Mid-process height residual between post-deposition measurement of the previous layer, and pre-deposition measurement (including a CNC z move between the measurements). (B) In-process height residual between post-deposition measurement of the previous layer, and measurement taken during WAAM deposition (without CNC z move between the measurements). Both plots are self-referenced using the build plate alongside the wall.
Download figure:
Standard image High-resolution image
5. Conclusion and future work
The RRI instrument has been demonstrated to be a promising and straightforward tool for in-process monitoring of WAAM. Measurements could be obtained with no discernible difference in quality between in-process and post-process results. This is the first reported use of this technique for additive manufacturing with lateral scanning across the weld. The high depth of field (compared to other techniques such as OCT) allows the layer height measurements to be directly referenced to the build plate, significantly reducing uncertainty by making the measurement independent of the motion system and build plate bending. For the titanium wire feedstock and build plate used here, which is difficult to measure due to its high degree of specular reflection, reliable height measurements were obtained from a wall comprising of eleven WAAM deposited layers, in very good agreement ( 0.05 mm) with both mid-process references measurements taken by micrometre and post-process laser scanning of the completed wall. These positions were determined by averaging the measured points within width 0.5 mm and length 2 mm bins containing between 250 and 400 points. Resolution improves by the square root of the increase in the number of points, itself achieved by decreasing the WAAM deposition speed. The 3 mm s−1 deposition speed used gave acceptable resolution and WAAM productivity.
Using the self-referencing of the layer height measurement to the build plate that is possible due to the long depth of field of the RRI measurement, it has been shown that the considerable uncertainty (up to 1.5 mm) in layer height determination due to build-plate bending and imperfect motion of the CNC system can be completely eliminated.
The galvanometer scanned RRI measurement provides reasonable coverage build plate up to scan angles of 4∘, i.e. for reflections within 4∘ of normal incidence from the (approximately) flat build plate surface. The top of the wall is at close to zero degrees incidence since the instrument is co-aligned with the arc torch depositing the wall; however, the wall itself has a curved profile and beyond 1.5 mm from the centre of the wall this creates sharp angles of incidence that reflect light away from instrument. Titanium has a high level of specular reflection and for a more scattering surface such as steel greater angles of incidence are expected to be measurable. The off machine, post process measurement made by the Romer scanning arm achieves full coverage 3D profiling of the wall by rotating the scan head around the wall. Methods to achieve this in-process from above with an RRI instrument mounted on the end effector will be considered in future work.
Currently only a single scanned RRI beam, located before the arc torch, has been considered. This is well positioned to provide in-process control based on the surface features the arc torch is approaching, and can simultaneously provide quality assurance for the previous layer of the wall; however, it cannot confirm that the applied in-process control has actually rectified an identified defect. For this, a second RRI beam located after the arc torch would be ideal. The use of multiple beams may also be necessary to accommodate the building of more complex structures. Integrating a second beam will be the topic of a future publication.
Data availability statement
The data that support the findings of this study are openly available at the following URL/DOI: 10.17862/cranfield.rd.16594772 [24].
Acknowledgments
The authors acknowledge the support of our colleagues in the Cranfield University Welding Engineering and Laser Processing Centre for the provision and training in the use of automated WAAM equipment, and particularly Mr J Thrower for performing the Romer RA7325SI reference measurement on the completed wall. This work was supported by the EPSRC through Grant Nos. EP/R027218/1, EP/M020401/1, EP/S01313X/1 and EP/N002520/1. T Kissinger acknowledges support from the Royal Academy of Engineering via Research Fellowship RF/201718.1745. The authors declare that they have no competing interests.