


Abstract
This study experimentally examined the flow phenomena and pressure distribution on the wing of Advisory Group for Aerospace Research and Development Model B (AGARD-B) at a Mach number of 0.83. For simultaneous pressure and temperature measurement, a mesoporous pressure-sensitive paint (PSP) sensor was applied to one of the wings of AGARD-B at an angle of attack (AOA) of 0°–8° and a temperature-sensitive paint sensor was applied to the other wing. The collected temperature data were used for pixel-by-pixel temperature correction in a PSP experiment. The pressure distribution obtained on the AGARD-B wing through the PSP experiment with temperature correction agreed well with that obtained through computational flow dynamics (CFD) simulation and accurately indicated the low-pressure regions introduced by the vortex generated from the leading edge at an AOA larger than 4°. The lift coefficient calculated using the PSP data agreed well with that calculated using CFD.
Export citation and abstract BibTeX RIS
1. Introduction
Advisory Group for Aerospace Research and Development Model B (AGARD-B) is a standard calibration model for testing the flow quality of high-speed wind tunnels. It has a unique design with a slender body and a pair of thin delta wings, as defined by AGARD in 1952. This model can be integrated with force balance for testing the lift and drag coefficients induced on it and has been extensively used to understand the flow condition in test sections. Hills introduced five types of AGARD models for wind tunnel calibration and presented the experimental results [1]. Subsequently, Anderson measured the aerodynamic performance of the lift, drag, and moment coefficients of AGARD-B at different angles of attack (AOAs) ranging from 4° to 24° and Mach numbers ranging from 0.2 to 1. Anderson's experimental results agreed well with the results of other measurements performed in eight wind tunnel facilities [2]. Chou et al examined the aerodynamic performance of AGARD-B and corrected the results obtained when the back pressure was measured at the backward side of the model to improve the experiment accuracy [3]. Due to the thin airfoil design of AGARD-B, the experiment of the aforementioned authors mainly involved integrating the force balance with the test model, and only force data, such as lift, drag, and moment coefficients, were obtained. In addition, the surface flow field could only be retrieved using numerical simulation. Akgul et al used computational fluid dynamics (CFD) to obtain the surface pressure distribution and flow field developed around AGARD-B at an AOA of 12° and Mach number of 0.6 [4]. In addition to the suitable agreement of the back pressure between the simulation and experimental results, the simulation results presented a local low-pressure region, which was introduced by the vortex generated at the upper surface starting from the leading edge. Vidanovic et al conducted a numerical simulation to study the surface pressure distribution of AGARD-B at AOAs ranging from −5° to 12° and Mach numbers of 0.596 and 1.602 [5]. With an increase in the AOA, a low-pressure region, which was introduced by the leading-edge vortex, moved toward the wing base. The moment coefficient estimated by the simulation exhibited excellent agreement with the experimental data acquired from the force balance.
Since the 1980s, an experimental technique involving the use of luminescence images for surface pressure measurements, which is known as pressure-sensitive paint (PSP), has been adopted in aerospace engineering for wind tunnel testing. The PSP technique has been used to obtain experimental results for various flow regimes, including subsonic, transonic, and supersonic flows. Dowgwilo et al applied a PSP sensor to an F-15E model and tested the model in a high-speed wind tunnel [6]. The surface pressure obtained by the PSP measurement agreed well with the conventional pressure measurements performed using pressure taps and transducers. Klein et al evaluated the surface pressure of an EADS MAKO aircraft model with PSP measurement, where the calculated normal force applied on the aircraft model agreed well with the experimental data obtained from the force balance [7]. Nakakita et al applied both PSP and temperature-sensitive paint (TSP) on an ONERA M5 model for pressure measurement and temperature correction in transonic and supersonic wind tunnels [8]. Two calibration methods that involved using a priori and a priori/in situ hybrid approaches were examined during the measurements. Excellent agreement was obtained with PSP measurement and temperature correction using TSP data compared with both the pressure tap measurement and simulation data. The temperature correction method has been applied to PSP experiments not only for stationary models but also rotating blades. Weiss et al applied temperature correction for PSP lifetime measurements on fast rotating blades. Due to the challenges of both pressure and temperature measurements on rotating blades, the temperature correction has executed by mathematically generating 1D temperature profile on the blade and applied to the PSP experiments. Although the temperature profile obtained from TSP measurements was not selected for temperature correction, the mathematically generating 1D temperature profile has been compared with TSP experiments before applying to PSP experiments [9]. Jiao et al proposed 2D temperature profiles for correcting the temperature dependency of PSP measurements on rotating helicopter blades. They observed the temperature gradient in both chordwise and radial direction. The 2D temperature profiles were constructed by commercial CFD software FLUENT and compared with TSP experiments. After applying 2D temperature profiles for temperature correction, the experimental error has been reduced by up to 27% [10]. In the past decades, a fast-response PSP was developed for capturing the transient flow phenomena under high-speed flow conditions. The overall view of development and applications of fast-response PSP can be reviewed in the literatures provided by Peng et al and Gregory et al [11, 12]. Fang et al developed a polymer-ceramic PSP (PC-PSP) with a porous surface for reducing the reaction time between oxygen molecules and a PSP sensor [13], where the response time of PC-PSP improved to as fast as a few hundred microseconds. A PC-PSP-coated hemispherical dome model was positioned in a transonic wind tunnel for surface pressure measurement. The phase-averaged and temperature-corrected PSP data exhibited suitable agreement with the data obtained using pressure taps. Huang et al applied PC-PSP to square cavity models with different yaw angles and tested these model in a transonic wind tunnel [14]. The pressure contours acquired through PSP measurement provided global flow visualization, with the detailed information regarding open and closed cavity flows indicating the presence of imping and recirculation regions. In addition to the conventional experimental applications in wind tunnel tests, the PSP sensor has been applied to microscale measurements to retrieve a detailed flow field in various fluidic devices and flow regimes [15, 16].
Despite the extensive applications of the AGARD-B model for wind tunnel calibration, the detailed flow field and aerodynamic characteristics of its wing surface have mainly been evaluated through numerical investigation. Limited experimental data have been reported on the aforementioned aspects due to the limitation of the thin airfoil design. In this study, a PSP sensor was applied to one of the wings of AGARD-B to acquire the surface pressure distribution. In addition, a TSP sensor was applied to the other wing for temperature measurement and the correction of the PSP data. The acquired surface pressure data were then integrated to calculate the lift coefficient. The acquired flow field information and aerodynamic performance were compared with numerical simulation results and previously published data.
2. Experimental method
Due to the thin airfoil design of AGARD-B, embedding pressure taps on its wing is almost impossible. AGARD-B has a slender fuselage with a diameter (D) of 48 mm. The wing span (b) is 4D, and the model's overall length is 8.5D. In this study, a porous PSP sensor was used as the pressure probe for measuring the pressure distribution on a wing of AGARD-B at different AOAs ranging from 0° to 8°. The porous PSP sensor was prepared by dissolving a luminescent molecule of tris(4,7-diphenyl-1,10-phenanthroline) ruthenium(II) (Rudpp) in toluene and then adding the RTV 118 polymer binder and 2 μm diameter hollow SiO2 mesoporous particles to the mixture. The SiO2 mesoporous particles were used to increase the oxygen permeability in the polymer binder and those PSP sensors are known as mesoporous PSP (MP-PSP) [17, 18], which is a new kind of PC-PSP sensor. Before coating the PSP sensor on AGARD-B, the fuselage of the model was coated with black paint (TS-5, TAMIYA) to reduce the reflection of the PSP signal from the wing. A white base coating (TS-27, TAMIYA) was applied to the wing surface before coating the PSP sensors. Then, MP-PSP was sprayed on one wing of AGARD-B and a commercially available TSP (UNT 400, ISSI) was coated on the other wing of AGARD-B for monitoring the temperature variation during the experiment. The temperature dependency of the PSP sensor, which can introduce measurement error during the experiment, was reported [8]. TSP measurements have been widely performed in wind tunnel tests under various flow conditions for acquiring not only the flow field but also a detailed temperature distribution [19]. To correct the temperature effect in PSP measurement, TSP and PSP sensors were applied to different wings of AGARD-B for simultaneous temperature and pressure measurements. The temperature data acquired from the TSP measurement were used to correct the PSP data. Figure 1 shows AGARD-B with TSP and PSP sensors coated on its two wings, in which c denotes the chord length of the wing and b is the span of the wing. x is the location on the wing along the free stream direction. For further analysis of the flow field generated on the wing surface, five locations—V1 (x/c = 0.17), V2 (x/c = 0.32), V3 (x/c = 0.48), V4 (x/c = 0.64), and V5 (x/c = 0.80)—were selected, as depicted in figure 1.

Figure 1. AGARD-B coated with PSP and TSP sensors and the definition of different spanwise locations of V1–V5.
Download figure:
Standard image High-resolution imageBefore conducting the AGARD-B experiment in a transonic wind tunnel, AGARD-B was placed inside a pressure calibration chamber for a prior calibration. A schematic of the pressure calibration chamber and instrumentation is illustrated in figure 2. The forward part of AGARD-B was removed, and only the central part with wings (AGARD-B wing model) was placed in the calibration chamber. In addition, a 14-bit scientific-grade charged coupled device (CCD) camera (Pixelfly, PCO) with a 600 nm long-pass filter and a 2100-lumen light source (SLG-55, Revox) with a 550 nm short-pass filter were used as the photodetector and excitation light source, respectively. A white light source with a 550 nm short-pass filter was used to cover the excitation wavelength of 441–467 nm for Rudpp and 460 nm for UNT-400. Calibration was performed with AGARD-B wing model and a CCD camera, rather than conducting a single-point calibration with a calibration coupon, to achieve pixel-by-pixel calibration with improved accuracy when transforming the luminescent intensity to surface pressure after the wind tunnel measurement [20]. AGARD-B was then placed inside a temperature-controlled chamber for temperature calibration. Figures 3(a) and (b) illustrates the pressure and temperature calibrations performed for the PSP and TSP sensors, respectively. The PSP sensor had a pressure sensitivity of 0.59% kPa−1 in the pressure range of 40–140 kPa with reference pressure of 101 kPa, which enables pressure measurement in current flow regime. It is noted that the pressure calibration was performed at fixed temperature of 24 °C, which was the room temperature in the laboratory. The selected TSP sensor (UNT-400) had a minimum pressure dependency and did not change its luminescence intensity with pressure variation. The TSP sensor had a temperature sensitivity of −1.28% °C−1 with reference temperature of 25.4 °C; however, the PSP sensor exhibited a temperature sensitivity of −0.95% °C−1 and caused pressure deviation when the temperature changed. The pressure was fixed at ambient pressure of 101 kPa while executing temperature calibration. During the calibration and measurement, the CCD camera recorded 50 images during the test and the averaged image was used for data reduction. In addition, an in-house Matlab code was used to transform the luminescent intensity to pressure data along the image registration between the calibration and the experiment. A median filter function in the Matlab program was used to remove the shot noise and preserve the pressure gradient at the edge in the acquired image. The uncertainty of pressure measurement in the current study is estimated around 6.51% considering the noise from CCD camera, the accuracy of the pressure transducer used in calibration, and the deviation from calibration curves. The pressure coefficient (Cp), which was normalized with a dynamic pressure of 57 kPa, was used for analyzing the pressure contours. The aforementioned coefficient was calculated as follows:
where p is the static pressure on the wing surface, p∞ is the free-stream pressure, and q∞ is the free-stream dynamic pressure.

Figure 2. Schematic of the pressure calibration chamber and instrumentation.
Download figure:
Standard image High-resolution image
Figure 3. (a) Pressure calibration curves of the PSP and TSP sensors with reference pressure (Pref) of 101 kPa at fixed temperature of 24 °C. (b) Temperature calibration curves of the PSP and TSP at reference temperature of 25.4 °C and ambient pressure condition of 101 kPa. Iref is the luminescence intensity taken at reference pressure or temperature condition.
Download figure:
Standard image High-resolution imageFor temperature correction with PSP data, Yamashita et al tested a simplified car model in a subsonic wind tunnel and observed pressure deviation under the temperature effect [21]. They proposed a temperature correction factor that can be applied to convert the luminescence intensity to pressure data during data reduction. In the present study, a simple temperature correction factor method was applied. The intensity ratio obtained during the calibration process in the calibration chamber can be written as
where I is the luminescence intensity acquired at difference pressure (P) condition in the calibration chamber. Iref is the reference intensity taken in the calibration chamber at reference pressure (Pref) and reference temperature (Trefc). For experiment, the obtained intensity ratio can be written as:
where I is the luminescence intensity acquire at experimental condition with the wind tunnel turned-on and at the pressure (P) and temperature (T) according to the flow condition. Iref is the reference intensity obtained at reference pressure (Pref) condition and reference temperature (Tref) condition before starting the wind tunnel. The reference pressure (Pref) between experiment and calibration is the same as ambient pressure; however, the reference temperature (Tref) during the experiment might be differed from the controlled temperature (Trefc) during the calibration. In order to resolve the temperature difference between experiment and calibration, the intensity ratio acquired during experiment can be modified by
In equation (4), the term on the left-hand side is the intensity ratio acquired during the experiment and the first term on the right-hand side is the intensity ratio in the calibration. The modification process can be expressed as
The temperature correction factor αTref can be used to correct the difference of reference temperature between calibration and experiment, and it can be estimated from temperature calibration of the PSP sensor. The temperature correction factor αT can be obtained by performing pressure calibrations at different temperature settings, and it can be used to correct the local temperature difference on the model surface [14]. Finally, the calibration equation of Stern–Volmer equation can be re-arranged as
where A0 and A1 are the coefficients obtained from calibration.
3. Results and discussion
To examine experimentally the pressure distribution and surface flow field on the AGARD-B wings, both PSP and TSP sensors were applied to separate wing surfaces and the model was positioned in a transonic wind tunnel facility in the Aerospace Science and Technology Research Center at National Cheng Kung University in Taiwan. The transonic wind tunnel was a blow-down wind tunnel with Mach number varying from 0.2 to 1.4. The test section was 1500 mm long with a 600 mm (width) by 600 mm (height) cross-section. In this study, the Mach number was 0.83 in the flow condition and the Reynolds number was calculated as 2.33 × 10⁷ m−1. The same CCD camera and excitation light source as those used for the calibration were placed in the wind tunnel facility for the measurement. Figure 4 illustrates the arrangement of AGARD-B and the instrumentation in the test section of the transonic wind tunnel facility.
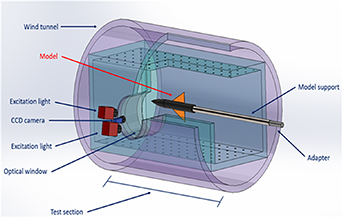
Figure 4. Schematic of AGARD-B positioned in the test section of the wind tunnel facility.
Download figure:
Standard image High-resolution imageFigure 5 presents the pressure profiles of the wings of AGARD-B at AOAs ranging from 0° to 8°. The low-pressure region, which is indicated by the light green and blue regions and was introduced by the vortex starting from the leading edge, was identified on the upper surface of the wings at an AOA above 4°. The strength of the vortex increased as the pressure decreased with an increase in the AOA. At the lower surface of the wings, the pressure continued to increase with the AOA. Figure 6 shows the temperature distribution on the AGARD-B wing surface. A small temperature difference was observed between the experiments conducted at different AOAs, which is attributed to the different dates and times of conducting the experiments. Although the experiments conducted at different dates and times had different ambient temperature conditions, which affected the stagnation temperature in the wind tunnel facility, the temperature data could be used for correcting the PSP results because the temperature and pressure measurements were conducted simultaneously with TSP and PSP coated on different wings. Figure 7 presents the temperature distributions at V1, V3, and V5 on the surface at an AOA of 8°.

Figure 5. Pressure coefficient contours of the upper and lower surfaces of the wings of AGARD-B at AOAs ranging from 0° to 8°.
Download figure:
Standard image High-resolution image
Figure 6. Temperature contours of the upper and lower surfaces of the wings of AGARD-B at AOAs ranging from 0° to 8°.
Download figure:
Standard image High-resolution image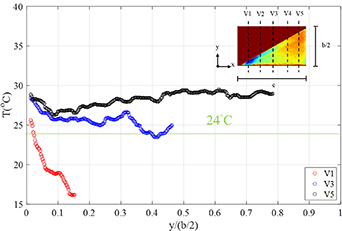
Figure 7. Temperature variations at V1, V3, and V5 obtained at an AOA of 8°. The green line (24 °C) indicates the temperature condition during pressure calibration.
Download figure:
Standard image High-resolution imageThe temperature in the pressure calibration chamber during pressure calibration was fixed at 24 °C, as indicated by the green line in figure 7, but the temperature was 24.7 °C while taking the reference image during the experiment. The temperature variation on the wing during experiment was changed from 16 °C at leading edge at V1 to 30 °C at wing tip at V5. These temperature difference, not only between calibration and experiment but temperature variation locally on the wing, will introduce incorrect pressure information in PSP experiment. For example, with 3 °C temperature deviation occurred on PSP measurement, it will contribute 2.85% intensity change estimated by the temperature sensitivity of PSP. Such 2.85% intensity change will be considered as 4.83 kPa pressure deviation in the experiment estimated by the pressure sensitivity of PSP. To resolve the error caused by the temperature difference, the temperature profiles obtained through TSP measurements were subjected to pixel-by-pixel correction in the PSP data. Figure 8 presents the raw PSP measurements without temperature correction and the PSP data obtained after temperature correction at an AOA of 8°. At V1, where the local temperature was lower than the temperature during calibration, the PSP data were adjusted to a marginally higher value. By contrast, at V3, where the local temperature was higher than the calibration temperature, the PSP data were adjusted to a lower value. The PSP data at V2 were not altered considerably because the local temperature was close to the calibration temperature. Figure 9 shows the comparison of pressure deviation between simulation and PSP measurements before and after temperature correction. The pressure deviation was calculated by subtracting PSP data with CFD data then divided by CFD data. The temperature correction applied to PSP measurements have effectively reduced the overall pressure deviation from 30% to less than 10% at AOAs from 0° to 8°. The streak-like pressure deviation showing on the AOA greater than 4°, similar pattern as the secondary flow, is attributed to the slightly difference between the locations of secondary flow presented in CFD and experimental data. Such misalignment between the locations of secondary flow in CFD and experiment will amplify the pressure deviation. Figures 10–14 present the pressure coefficient distributions at V1–V5 measured by the PSP sensor after temperature correction. These data were compared with the numerical data obtained through CFD. The pressure profiles at the lower surface exhibited minimum variation, and only a small difference between the wing tip and base was observed when the AOA increased to approximately 8°. On the upper surface, the patteren of pressure distribution changed at an AOA larger than 4°, where a local low-pressure region was introduced by the vortex near the wing tip. The low-pressure region started from the leading edge at V1 and propagated to V5 near the trailing edge. With an increase in AOA to 8°, the low-pressure region moved from the wing tip toward the wing base (near the fuselage). Due to the triangular wing design of AGARD-B, the flow phenomena identified in the PSP measurement were similar to those observed in the PSP experiments conducted with the delta wing structure by Chu et al and Konrath et al [22, 23]. Overall, the temperature-corrected PSP data accurately represented the flow field with a low-pressure region triggered by a vortex on the delta wing and closely agreed with the CFD data.

Figure 8. Comparison of the uncorrected and temperature-corrected (Tcorr) pressure coefficient distributions at V1, V3, and V5 at an AOA of 8°.
Download figure:
Standard image High-resolution image
Figure 9. Comparison of pressure deviation between simulation and PSP measurements before and after temperature correction.
Download figure:
Standard image High-resolution image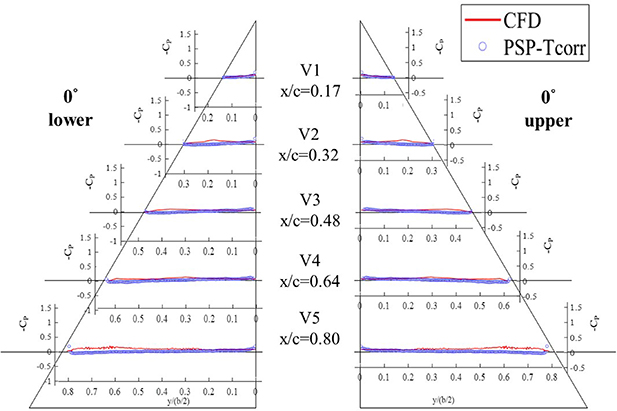
Figure 10. Comparison of the temperature-corrected pressure coefficient distribution obtained through PSP measurements and the simulation data at an AOA of 0°.
Download figure:
Standard image High-resolution image
Figure 11. Comparison of the temperature-corrected pressure coefficient distribution obtained through PSP measurements and the simulation data at an AOA of 2°.
Download figure:
Standard image High-resolution image
Figure 12. Comparison of the temperature-corrected pressure coefficient distribution obtained through PSP measurements and the simulation data at an AOA of 4°.
Download figure:
Standard image High-resolution image
Figure 13. Comparison of the temperature-corrected pressure coefficient distribution obtained through PSP measurement and the simulation data at an AOA of 6°.
Download figure:
Standard image High-resolution image
Figure 14. Comparison of the temperature-corrected pressure coefficient distribution obtained through PSP measurements and the simulation data at an AOA of 8°.
Download figure:
Standard image High-resolution imageBy using the pressure data acquired on the upper and lower surfaces of the AGARD-B wings, the aerodynamic performance can be calculated in terms of parameters such as the lift coefficient. Figure 15 illustrates the lift coefficient calculated using the PSP data and compared with CFD data. The lift coefficient exhibited a favorable agreement between the PSP and CFD data for an AOA of 0° to 8°. Table 1 presents the lift coefficient obtained from the PSP experiment, CFD simulation, and previously published data [2, 3, 24, 25]. The lift coefficient exhibited the minimum deviation between the data of the PSP experiment and previously published data, and it shows good agreement between PSP experiment and CFD simulation.

Figure 15. Comparison of the life coefficient obtained from the PSP data and simulation data at AOAs ranging from 0° to 8°.
Download figure:
Standard image High-resolution image
4. Conclusion
In this study, an MP-PSP sensor was applied to the surface of a wing of AGARD-B for obtaining the flow fields and pressure profiles. The PSP data were temperature-corrected by measuring the temperature and pressure simultaneously by coating one wing with a TSP sensor and the other wing with a PSP sensor. The temperature-corrected pressure distribution acquired through PSP measurement exhibited close agreement with the CFD data. The flow phenomena of the low-pressure region introduced by the leading-edge vortex were successfully captured by the PSP experiment at an AOA above 4°. The aerodynamic performance was evaluated in terms of the lift coefficients by using the PSP data. The lift coefficients estimated from the PSP measurement exhibited a favorable agreement those estimated from the CFD data. The experimental results presented in this study demonstrate the capability of PSP measurement on AGARD B wing with thin airfoil design and the effectiveness of applying temperature correction on PSP data while large temperature variation observed in the flow field.
Acknowledgments
The authors thank Professor Y T Wu from the Department of Engineering Science in National Cheng Kung University for providing the CFD data and the Ministry of Science and Technology, Taiwan, for its financial support under the Project No. MOST 108-2221-E-007-030-MY3.
Data availability statement
The data that support the findings of this study are available upon reasonable request from the authors.