

Abstract
The sidewall angle (SWA) of a nanostructure exerts influence on the performance of the nanostructure and plays an important role in processing nano-structural chips. It is still a great challenge to determine steep SWAs from far field measurements especially when the SWAs are close to 90°. Here, we propose a far-field detection system to determine steep SWA of a cliff-shape step structure on a silicon substrate by combining a split detector with a scanning method. The far-field radiation field is asymmetric due to the scattering of the step structure, and further numerical analysis demonstrates the reliability of this far-field measurement method. In the simulations, two key variables, i.e. the polarization state and the focus position of the incident laser beam, are considered to explore their impacts. By scanning over the structure laterally and longitudinally with both TE and TM polarizations, polarization effects on the far-field occur. These effects show higher sensitivity to steep SWA variation for TM polarization as compared to TE. Furthermore, with a comprehensive longitudinal scanning analysis for the TM polarization case, a feasible focus interval can be optimized to retrieve the steep SWA. As the proposed method is fast, highly sensitive and easy to implement, it provides a powerful approach to investigate the scattering behavior of nanostructures.
Export citation and abstract BibTeX RIS

Original content from this work may be used under the terms of the Creative Commons Attribution 4.0 license. Any further distribution of this work must maintain attribution to the author(s) and the title of the work, journal citation and DOI.
1. Introduction
In the semiconductor industry, the photomask is a key component in the lithographic system. The accurate evaluation of the structures on the photomask dominates the performance of the end products. Consequently, a strictly precise description of the shape of the groove on the photomask plays an important role in the in-line process control and process development. Those structures are often gratings whose shape can be described by some geometrical parameters, such as period, middle critical dimension (MidCD), height and sidewall angle (SWA). In practical applications, the grating period is generally the best controlled parameter, and the SWA is more difficult to determine optically than the MidCD and the height [1]. In recent years, with continuous miniaturization of photonic and electronic devices, the mask feature sizes become smaller and smaller, and consequently, the SWA has become increasingly important in lithography mask fabrication. For example, EUV masks need steep vertical SWA, since in case of non-vertical SWA, the transferred pattern sizes on the wafer will be affected by shadowing effects. If there is a large deviation in the final etched pattern, it will deteriorate the subsequent fabrication of further layers on the nanostructure, and it may even lead to the failure of the chip. The verticality of the SWA, therefore, has become a crucial factor in mask fabrication [2]. Non-destructive determination of the SWA, especially for reconstruction of steep SWA with high precision is obviously indispensable in nanostructure metrology.
Several techniques have been used to measure the SWA, currently, atomic force microscopy (AFM) and scanning electron microscopy (SEM) are the two most popular methods. For SEM [3–5], both the cross-sectional SEM (X-SEM) and critical dimension SEM (CD-SEM) have drawbacks, for instance, in the case of X-SEM, one needs to cut the sample to observe its cross-section, which might introduce extra errors, while with CD-SEM the SWAs have to be computed indirectly, with the resolution being limited by the primary electron beam diameter. For AFM [6–9], it is hard to measure SWAs greater than the slant angle of the tips, and also its low throughput is an obstacle. Moreover, these methods are all based on near-field measurements, and the experimental systems are very complex, with rigorous operating conditions. To overcome these drawbacks in dimensional and structural metrology, a non-destructive, fast and quantitative method such as optical scatterometry has become commonly used for nanostructure profile reconstruction, in particular in in-line lithographical manufacturing process. Optical scatterometry [10, 11] is inherent a model-based metrology technique that is used to reconstruct the optimal nanostructure profile parameters by continuously matching the theoretical signatures with the measured ones. The theoretical model for the scattering process is based on the rigorous solution of Maxwell's equations. Many methods have been proposed, depending on the structure features, such as the so-called C method [12, 13], the rigorous coupled wave analysis (RCWA) [14–16], the finite element method (FEM) [17–19], and the finite difference time domain (FDTD) [20–22], etc. For instance, RCWA is primarily suitable for calculation of diffraction field of periodic structures, while FEM is more flexible to solve boundary value problems.
In this work, we propose a novel detection optical system for the determination of steep SWAs that explores asymmetries in the far-field scattering light. The proposed approach is appropriate for all values of SWAs but here we focus on steep SWAs because there it is still a lot of challenges associated with them. Numerical calculations using the FDTD method are carried out to verify the detection capabilities of the scheme. The rigorous electromagnetic interaction between a cliff-like structure and the focused laser beam generated by a cylindrical lens is modeled to distinguish different steep SWAs, which is closer to the experimental situation and more accurate than the scalar analysis [23]. We conduct lateral and longitudinal scanning of the structure for both TE and TM polarization, and monitor the scattered light by a split detector to analyze the polarization effect in the far field. The results reveal that TM polarization is more sensitive for steep SWA detection, and is able to distinguish SWA differences below 1°, which meets the technological requirement of absorber SWA in ITRS2008 roadmap [24]. We define a quantity called the 'visibility' to quantify the influence of the longitudinal focus position to steep SWA detection in the TM case. The results reveal that there is a feasible longitudinal focus interval which can be used to distinguish steep SWAs with different heights of the structure, and within this interval, there is an optimal focus position. Our findings present a robust and sensitive determination method for steep SWAs in far-field detection, and we believe it will provide a feasible approach for accurate measurement of more complicated nanostructures.
2. Method
A cliff-like structure is shown in figure 1(a). We select one cliff-like subarea as the target structure as it is the pivotal part of a general grating profile. Grating profiles are obtained by varying the height and SWA of the structure. Figure 1(b) is the proposed detection system for SWA determination, where the cliff-like structure is centered in a right hand coordinate system and is illuminated by a probe beam. For simplicity we assume that the cliff-structure is infinite along the x-axis and invariant with respect to the y coordinate. Consequently, the disturbances from other parameters are avoided, and the structure can be fully described by the SWA and height in the x–z plane. A collimated laser beam with polarization in the pupil, which is either parallel (TE) or perpendicular (TM) to the y-axis is focused on the upper interface of the structure through a cylindrical lens. By using a cylindrical lens, the interaction of the light with the structure is a two-dimensional scattering problem.

Figure 1. (a) Scheme of the cliff-like structure showing its geometrical parameters. The structure is fully described by height and SWA. (b) Diagram of a reflection scanning system with a split detector. A collimated laser beam with wavelength of 633 nm is focused onto the sample by a cylindrical lens with NA of 0.6. The scattered light is collected by the same lens and finally recorded by a split detector. (c) The simulated near-field intensity showing the interaction between the focused beam and silicon-based cliff-like structure in x–z plane for TM polarization.
Download figure:
Standard image High-resolution imageIt has been demonstrated in previous work [23, 25, 26] that an object can be described as a phase step if its slope is sufficiently steep. The phase step will introduce an offset to the scattered light due to the path difference on either side of the step, as shown in figure 1(c). Furthermore, the relative movement between the structure and the incident beam will bring a dynamic variation in the far field, which can be collected through the same cylindrical lens. To get a high sensitivity at high speed, a split-detector technology is implemented, which is often used in differential phase-contrast microscope [27–29]. The split detector measures the intensity in both halves of the exit pupil and integrates each of them and then subtracts them after normalization:
where  defines the detection area, NA is the numerical aperture of the cylindrical lens, ƒ is the focal length, and ξ is the coordinate in the exit pupil. Theoretically, the detection sensitivity and anti-noise performance can be improved by the difference between the integrals of these two halves.
To study the interaction between the cliff-like structure and probe beam, we performed simulations using the commercial software 'FDTD solutions' (Lumerical Inc., Canada). A two-dimensional FDTD model is built with a total simulation region of 10 × 8 μm, where the silicon step structure (as described in figure 1(b)) is created in the bottom region and all other part is air. A 633 nm-wavelength TM- or TE-polarized light source is generated through a self-written script based on [30, 31], and focused on the upper surface of the silicon structure with the NA of 0.6. The refractive index of silicon is 3.882 + 0.019i at the wavelength of 633 nm given by the FDTD material database. Perfectly matched layer boundary conditions are used at all boundaries of the simulation domain without causing reflections. In order to provide enough computational precision to distinguish different SWAs, the grid size in the cliff-shape region (as described in figure 1(c)) is chosen as 2 nm in x-direction and 5 nm in z-direction; Finally, the far-field is calculated by projecting the near-field scattered field obtained from FDTD simulation to the pupil plane.
3. Results and discussion
To better understand the offset caused in the scattered light by the step, we begin with the height set to λ/4 and SWA of 90°, which satisfies the quadrature condition (i.e. the phase difference between the reference and the signal beam is around π/2) [25]. We first perform a lateral scanning, with the probe beam focused on the upper interface of the structure. The translation of the focus spot along the x-direction is defined by xt, and the probe beam moves from negative to positive xt, where xt
 0 means that the center of the spot is on the edge of the step, as shown in the figures 2(a) and (b). Figures 2(c) and (d) show the far-field radiation field in the pupil plane for TE polarization, and figures 2(e) and (f) for TM polarization. Figures 2(c), (e) and (d), (f) correspond to two scanning positions, namely xt
 −0.6 and 0 μm, respectively. For xt
 −0.6 μm (figures 2(c) and (e)), a major portion of the radiation field is concentrated in the center with two small side lobes, which means that when the probe beam is relatively far from the cliff-structure, the probe beam is mainly reflected by the surface. As one can see, the intensity of the two twigs in figure 2(c) is much bigger than in figure 2(e), which indicates that the TE and TM modes have different edge scattering behavior; for both figures 2(c) and (e), the far-field intensities for 80° and 90° highly coincide, when the probe beam is far from the cliff-structure. For the beam focused at the center xt
 0, the scattered light from the right and left halves of the step exerts a π phase difference. The scattered light in the middle part becomes very weak after interference, leaving two asymmetric radiation fields at divergence angle around ±40° with a high intensity, as shown in figures 2(d) and (f). Although the intensity ratio between the two lobes in figure 2(d) is larger than in figure 2(f), the difference between the intensity patterns for 80° and 90° SWA is larger for TM (figure 2(f)) than for TE (figure 2(d)).
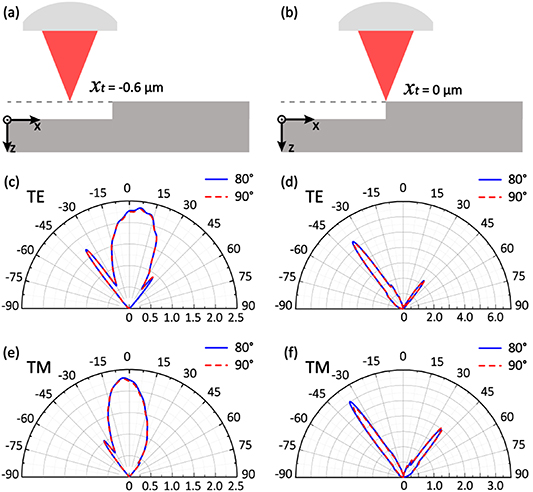
Figure 2. Explanation of the process of the lateral scanning of the focused beam. The probe beam is scanned along x-axis from left to right as shown in (a) and (b). The translation is denoted by xt. (c) and (d) are the far-field radiation field when xt
 −0.6 um and 0 for the TE polarization, respectively. (e) and (f) are the far-field radiation field when xt
 −0.6 um and 0 for the TM polarization.
Download figure:
Standard image High-resolution imageFigure 3(a) shows the variation of the intensity of the scattered far field for TE polarization, for scanning position xt in the range from −0.6 μm to 0.6 μm, with scanning step of 0.06 μm and for SWA of 90°. Figure 3(b) is analogous to figure 3(a) for TM polarization. The results show that the radiation distribution in far field for TE and TM polarization are similar. There is however a difference in the ratio of the intensities in the two lobes when the probe crosses the edge of the step; this phenomenon can be explained by the electromagnetic boundary conditions [32]. Figures 3(c) and (d) show the split detector signals for a cliff-like structure with different SWAs as function of the scanning position xt for TE and TM polarization, respectively. The height of the step is λ/4 again and SWA is 80°, 86°, 88°, 89°, and 90°. The longitudinal position of the focus is fixed at the upper interface of the sample, in accordance with the scheme in figure 2. The lateral scanning region ranges from −2 μm to 2 μm, with the same scanning step as before. According to figure 3(a), for TE polarization the scattered intensity in the left half of the pupil is always larger than in the right half, so the split detection signal is always positive. Furthermore, the split detector signals for all five SWAs highly coincide, meaning that TE polarization is not very sensitive to changes in steep SWAs.
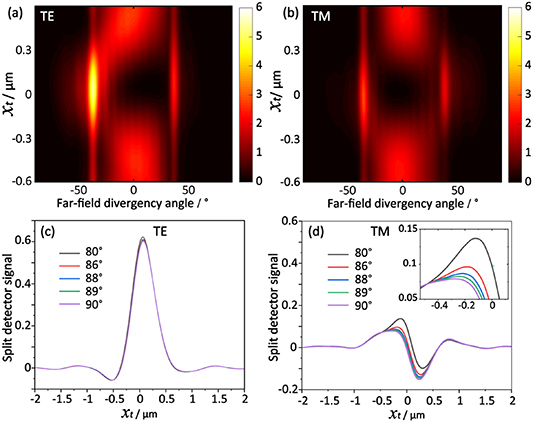
Figure 3. Top: Stacks of the far-field radiation field for different scanning positions xt in (a) TE and (b) TM polarization for a cliff-like structure with height  λ/4 and SWA
  90°. Bottom: split detector signals for a cliff-like structure with different SWAs, namely 80°, 86°, 88°, 89° and 90° under two different polarizations: (c) TE polarization and (d) TM polarization.
Download figure:
Standard image High-resolution imageIn contrast, for TM polarization shown in figure 3(d), the split detection signal clearly differs for different SWAs. Each SWA produces a unique 'heartbeat' signal, with different amplitudes. The insert in figure 3(d) shows that the difference between 89° and 90° is still visible and possibly could be measurable, which makes us conclude that the scattering due to TM polarization has the potential for applications in determining steep SWA to the order of 1°. Although the absolute value of the split detect signal for TE polarization is higher than for TM, its sensitivity to SWA variation is smaller. The results show thus that TM polarization is preferable for steep SWA determination.
Since we consider the dependence on the longitudinal position of the focused spot, it is hard to determine the exact position of the focal plane of the laser beam w.r.t. the structure. Figures 4(a) and (b) show the far-field radiation signals by longitudinal scanning of the same structure (height  λ/4, SWA
  90°) showed in figure 2. The lateral position of the beam is fixed at xt
 0, and the beam moves from top to bottom with focus plane position (zt) changing from 0.3 μm to −0.3 μm. Note that zt
 0 corresponds to the probe beam being focused at the upper interface of the structure. As shown, the divergence angle of the scattered fields is still located mainly around ±40° scattering angle for both polarizations. As consequence, the scattered light could be collected without any position adjustment when the polarization changes.
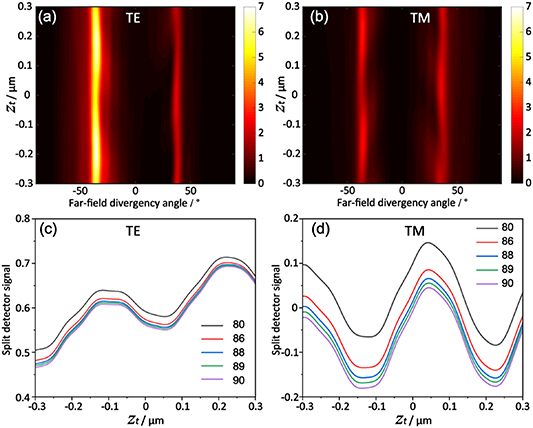
Figure 4. The stacks of the far-field radiation field along different vertical scanning positions zt in (a) TE and (b) TM polarization for a cliff-like structure with height  λ/4 and SWA
  90°. The split detector signals for five different SWAs for two different polarizations: (c) TE polarization and (d) TM polarization.
Download figure:
Standard image High-resolution imageFigure 4(a) shows the far-field intensity for TE polarization. The intensity is for all focal positions more strongly scattered to the left than to the right side of the pupil, but the ratio of the left and right intensities changes gradually with longitudinal focal position. As shown in figure 4(b), the scattered field much more strongly varies with longitudinal focus for TM polarization than for TE. Figures 4(c) and (d) show the split detector signals for different steep SWAs for TE and TM polarizations, respectively, when xt
 0. The parameters of the tested structure are kept the same in figure 3, i.e. the step height is λ/4 and the SWA is 80°, 86°, 88°, 89°, and 90°. The scanning range is from 0.3 μm to −0.3 μm and step size is 0.01 μm. As demonstrated in figure 4(c), although the longitudinal focus position changes the far field distribution, the overall trend of the five split detection signals looks quite similar. While for the TM case, as shown in figure 4(d), the difference between the split detector signals for different SWAs is more obvious. In conclusion, the signals generated by changing the longitudinal focus positions could also be used to retrieve the SWAs of the nanostructure.
The comparisons of TE and TM polarization for both lateral and longitudinal scanning, imply that TM polarization is more sensitive than the TE polarization for difference in SWAs. We have also studied the transitional polarizations between the TE and TM mode, and as result, we conclude that TM polarization is the optimal one. We therefore further explore the TM case. For a quantitative description of the detection sensitivity, we define a contrast value of split detector signals, as:
where max() and min() are the maximum and minimum of the split detector signal χ. It should be noted that the absolute value of minimum χ can be greater than that of the maximum, the visibility value can be negative at some conditions. For each vertical focus position, a horizontal scanning is performed to get a series of far-field radiation patterns, referring to the horizontal rail in figure 3(b). We further get the split detector signal of the far-field from equation (1) as function of xt. The visibility value is calculated from equation (2) by getting the extreme value of the split detector signal. Finally, only one scalar quantity is obtained from the stacks of far-field radiation field with respect to zt.
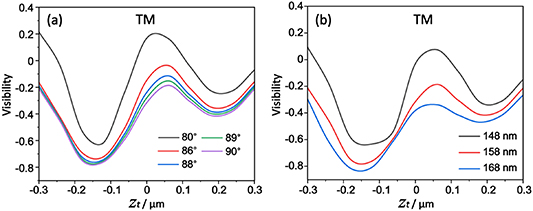
The visibility is plotted as a function of the longitudinal focus position in figure 5(a). It demonstrates that the visibility of 80° is always higher than the other four SWA values, and thus very distinguishable. For quasi-vertical SWAs, however, the optimum focus position should be used, since the difference between the visibilities is small. The largest variation of the visibility as function of focus position for SWA close to 90° occurs for focal position zt
 0.05 μm, hence 50 nm above the upper surface. The results of visibility are logical and consistent with expectation: focusing on the upper interface of the structure is not the only valid position, there is indeed a feasible focus interval to detect steep SWAs.
Figure 5. (a) Visibility of the split detector signal as function of the focal position zt of the spot for five values of SWA. The visibility is defined by equation (2), as explained in the main text. (b) The visibility as function of the position of the focal spot for three different heights when the SWA is fixed to 90°.
Download figure:
Standard image High-resolution image
The above simulations are based on the condition that the height is equal to λ/4. The cases for other heights are also investigated, as shown in figure 5(b). The SWA in this case is fixed at 90° and the height is equal to 148, 158 and 168 nm. We can see that the height also has a strong influence to the visibility values, but the better focus interval around zt ≈ 0.05 μm is still good to use. In addition to 90°, we also investigated other SWAs with different heights, and the results show the same tendency as in figure 5(b). These indicate that our method is still valid when the wavelength of the focused beam is fixed and the structure height has a tolerant deviation from 1/4 wavelength, and with the right focus interval we can accurately retrieve the steep SWAs. It is important to emphasize the requirement on the physical height of the sample is not stringent, our method can be used in a wide range of height by adjusting the incident wavelength.
4. Conclusions
In conclusion, we proposed an efficient approach for distinguishing steep SWA of a cliff-like structure by analyzing the far-field scattering signals. An incident beam is focused onto the structure by a cylindrical lens, and the scattered light is collected by the same cylindrical lens and detected by a split-detector to record the far-field signals. Both lateral and longitudinal scanning of the structure under TE and TM polarization are performed to optimize the detection sensitivity. The simulations demonstrate that the polarization state is an important factor to modulate the far-field scattering field, and TM polarization is much more suitable for steep SWA detection than TE polarization. A parameter called 'visibility' is defined to quantify the influence of the longitudinal focus position on detecting steep SWA. There is a feasible vertical focus interval that can be used to distinguish different SWAs, and inside this interval there is an optimum focus position. For step height of a quarter wavelength, TM configuration can be applied to detect the SWA difference with accuracy higher than 1° at a suitable focus position. Also, according to simulations, the method is robust even after adding a small surface roughness to the step. The proposed approach is fast, highly sensitive and easy to implement. Moreover, the influences of height deviations are also analyzed. For realization of the experiments, there are many factors that need special attentions, such as the alignment between the structure and focused beam, focusing and tilting errors. There should be also special attention to the detector, as this should have low noise amplifiers and probably with heterodyne techniques given that the expected voltage differences are small. We envision in the future using machine learning [33] to solve the inverse problem in scatterometry by building a comprehensive database based on calculations as presented in this paper to analyze the experimental data.
Data availability statement
The data that support the findings of this study are available upon reasonable request from the authors.
Funding
National Natural Science Foundation of China (NSFC) (91750205, U1701661, 61935013, 61975128); Leading Talents of Guangdong Province Program (00201505); Natural Science Foundation of Guangdong Province (2016A030312010); Science and Technology Innovation Commission of Shenzhen (JCYJ20180507182035270, KQTD2017033011044403, ZDSYS201703031605029).