


Abstract
Terrestrial laser scanners (TLSs) are increasingly used in several applications such as reverse engineering, digital reconstruction of historical monuments, geodesy and surveying, deformation monitoring of structures, forensic crime scene preservation, manufacturing and assembly of engineering components, and architectural, engineering, and construction applications. The tolerances required in these tasks range from few tens of millimeters (for example, in historical monument digitization) to few tens of micrometers (for example, in high precision manufacturing and assembly). With numerous TLS instrument manufacturers, each offering multiple models of TLSs with idiosyncratic specifications, it is a considerable challenge for users to compare instruments or evaluate their performance to determine if they meet specifications. As a result, considerable efforts have been made by research groups across the world to model TLS error sources and to develop specialized performance evaluation test procedures. In this paper, we review these efforts including recent work to develop documentary standards for TLS performance evaluation and discuss the role of these test procedures in establishing metrological traceability of TLS measurements.
Export citation and abstract BibTeX RIS
1. Introduction
1.1. Terrestrial laser scanners (TLSs)
A '3D imaging system' is a non-contact measuring instrument used to produce a 3D surface representation (for example, a point cloud) of an object or a site (ASTM E2544-11a [1]). This definition includes laser scanners, optical range cameras, triangulation-based systems, and interferometry-based systems. In this review, we focus on TLSs, a specific type of 3D imaging system that acquires 3D point clouds in spherical coordinates, see figure 1 for an example and schematic. These systems typically comprise a ranging unit mounted on a two-axis gimbal to record range, the horizontal angle, and vertical (typically, zenith) angle, of each surface point in the scene. In addition to 3D point coordinates, the intensity of each point is also sometimes recorded. More specifically, TLS systems may be classified as camera-scanners, hybrid scanners, and panorama scanners based on the beam deflection type [2]. Camera and hybrid scanners have limited field-of-view while panorama scanners can scan an entire spherical volume except in a small region directly underneath the scanner. In this paper, we review panorama scanners as they are more universally available, and more applicable to manufacturing and other indoor applications. Unlike laser trackers [3] which use spherically mounted retroreflectors (SMRs), these systems do not require cooperative targets as they record passive reflectance from the scanned surfaces. This review concerns methods to evaluate the performance of TLSs; for a more general introduction to TLS systems, their construction, operating principles, and typical usage, see [4].
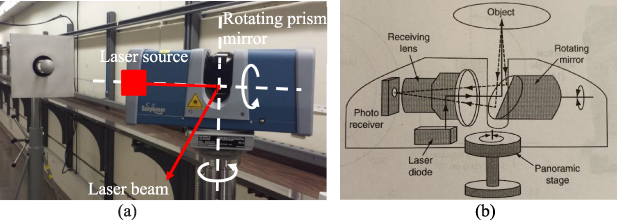
Figure 1. (a) TLS 1 setup to measure a hybrid plate-sphere target at the tape tunnel facility at NIST. (b) Schematic of a TLS showing some internal components more clearly. The laser diode generates a laser beam that is deflected by the rotating mirror in a vertical plane towards the object, the reflection from the object is again deflected by the rotating mirror into the receiving lens and the photo receiver. The panoramic stage allows the TLS head to rotate 360° about the vertical axis, thus covering the full spherical volume except directly beneath the instrument. [4] 2009, reprinted by permission of the publisher (Taylor & Francis Ltd, http://www.tandfonline.com).
Download figure:
Standard image High-resolution imageTLS systems today have a measuring range from a few tens to a few hundreds of meters. Range errors are on the order of sub-millimeter to several millimeters, while range noise (standard deviation of the residuals from a best-fit to a measured plane) is on the order of a few hundred micrometers and angle uncertainties are on the order of tens of arc-seconds. TLS systems are used in a variety of applications such as digital reconstruction of historical monuments [5, 6], Earth sciences (spectral and structural geology, seismology, natural hazards, geomorphology, and glaciology) [7], environmental sciences [8], geodesy and surveying [9–11], deformation monitoring of structures [12], forensics crime scene preservation [13], reverse engineering, manufacturing and assembly of engineering components [14], architectural, engineering, and construction (AEC) applications [15]. Tolerance requirements of historical monument preservation and some surveying applications may be on the order of a few millimeters, while tolerance requirements for some high precision manufacturing and assembly applications may be on the order of a few tens of micrometers. Periodic performance evaluation is critical to ensure the reliability of the data and to establish metrological traceability of the results; this is especially true for the high precision applications.
1.2. Performance evaluation and error sources
Performance evaluation typically consists of test procedures to quantify the errors in a measurement. In the context of documentary standards, performance evaluation is a standardized procedure to characterize instrument performance. This characterization allows a user to determine if the instrument meets the specifications provided by the instrument manufacturer, i.e. to verify that actual measurement errors are smaller than specified maximum permissible errors (MPEs) or to determine if the instrument meets the user's requirements for a specific application. The test may be as straightforward as the measurement of a calibrated reference object in the measurement volume or may involve more complicated procedures such as those described in later sections. The objective of the performance evaluation is not to provide an uncertainty statement; rather, it is to provide a numeric quantity that can be compared against the manufacturer's or user's specifications to determine if the instrument meets those specifications.
Performance evaluation test procedures and the study of TLS error sources are closely related topics. Clearly, the objective of a performance test is to reveal underlying error sources. A sensitive performance test, i.e. one that reveals underlying errors, can only be designed if we understand the nature and effect of the error sources. Thus, we first review error sources in TLS systems and then address how performance tests may be designed to detect those error sources. Coşarcă et al [16] note that TLS errors may be classified into the following four broad categories:
1.2.1. Instrument errors.
These may be further partitioned into ranging errors and volumetric errors. Ranging errors are primarily due to the ranging system employed while volumetric errors, which primarily manifest themselves as errors in the measured angles, are due to geometrical and optical misalignments in the system. We describe these errors in more detail in section 2.
1.2.2. Laser-surface interaction and surface properties.
The reflectivity of the object affects range measurement; highly reflective (mirror finish) or dull (black) surfaces typically result in significant errors in the measured range. The angle of incidence of the laser beam on the object surface, multi-path reflections, etc, also contribute to errors in the measured range. The laser spot size increases with increasing range, leading to increased spatial averaging (i.e. reduced resolution). When the laser spot falls on a region of the target surface that is not continuous, for example, the edge of a step, the return signal may not be able to capture the true range, resulting in errors in the measured range.
1.2.3. Environmental conditions.
The environment in which the measurement is performed can have a significant influence on measurement errors. From Coşarcă et al [16], 'A difference in temperature of 10 °C or in air pressure of 35 hPa may leads to a scanned distance error of 1 mm/100 m.' In addition to the errors due to temperature dependent changes in the wavelength of the laser beam, thermal expansion/contraction of the objects being measured is an additional factor to consider.
1.2.4. Scan strategy.
Other sources of error arise from choices made by the operator during the scanning process. These include scan density, data processing and algorithms employed, and registration errors when scanning large areas which cannot be covered in a single scan.
Staiger [17] summarizes the same information (although grouped slightly differently) in the form of a figure, see figure 2. Of the four categories of error sources described above, instrument error sources are well understood, documented clearly in the literature, and standardized tests exist for their evaluation. We therefore limit our discussion to instrument error sources in this review. Errors due to laser-surface interaction are also documented in the literature but standardized tests do not yet exist for their evaluation. We briefly address these error sources in section 7.

Figure 2. Influence factors in a TLS measurement. Reproduced with permission from [17].
Download figure:
Standard image High-resolution imageBefore we proceed, we want to clearly note the difference between performance evaluation and any manufacturer (for example, see Walsh [18]) or user performed calibration. Both may involve specialized test procedures, but their objectives are not the same. A manufacturer/user performed calibration is designed to quantify different system parameters through a series of measurements, these parameters are then updated to improve the accuracy of the system. As mentioned earlier, performance evaluation test procedures, on the other hand, are performed to quantify the magnitude of errors prevalent in a system to determine if the system meets manufacturer's or user's specifications.
1.3. The path to standardized performance tests
Establishing the performance of TLS systems or comparing across instruments has been a considerable challenge because there are numerous manufacturers of TLS systems, each producing multiple models with idiosyncratic specifications. This has led to numerous specialized test procedures being developed to characterize TLS errors and to evaluate their performance; we describe these in later sections. Some early work in error characterization and performance testing is reported by [19–28] leading up to the first comprehensive study by Boehler et al [29] in 2003 where they note:
The accuracy specifications given by laser scanner producers in their publications and pamphlets should always be doubted. Experience shows that often these cannot be trusted [...] Every point cloud produced by a laser scanner contains a considerable number of points that show gross errors. If the point cloud is delivered as a result of surveying, a quality guarantee, as possible for other surveying instruments, methods, and results, cannot be given.
Comprehensive TLS performance evaluation studies have also been reported by Hiremagalur et al [30] in 2007 and later, by Wunderlich and Wasmeier [31] in 2013. In the latter study, the authors note that 'standardized specifications of terrestrial laserscanners' performance features are still missing which would allow an objective comparability of different scanner models.'
In early to mid-2000s, the only available guideline for testing optical 3D systems was the VDI/VDE 2634 series [32]. This guideline was primarily intended for triangulation-type systems such as stereo-vision cameras, fringe projection systems, etc. Heister [33] proposed performance evaluation tests for TLS systems based on these guidelines that involved the measurement of eight lengths oriented in different ways in the measurement volume. These tests were subsequently realized by others, for example, see Gottwald et al [34], Kern [35], Huxhagen et al [36], and Wehmann et al [37]. While Heister's proposal involved comparing measured lengths against a reference value, much of the early work among the surveying community in Germany was related to the development of field check procedures that are quick and easy to realize in the field. For example, test procedures proposed by Gottwald [38] involved comparing the distances between pairs of targets measured from different positions of the TLS, thus, no reference values are used in the evaluation. The work by Gottwald and others were primarily in support of the development of field-check standards within ISO technical committee TC172. Their effort was directed along the lines of test procedures developed for other geodetic systems (ISO 17123 series of Standards [39]), eventually resulting in the publication of ISO 17123-9 standard in 2018. Although not a performance evaluation standard, we discuss this standard (in section 5.3) for purposes of completeness.
Recognizing the need to develop comprehensive performance evaluation standards for TLSs, the ASTM E57 committee on 3D Imaging Systems established a working group in 2006 to develop a documentary standard. Given the number and complexity of influence factors, the working group limited the scope of their first TLS standard to the evaluation of relative range errors. The ASTM E57 committee released ASTM E2938-15 [40] in 2015, this standard specified a method to evaluate the relative range performance of 3D imaging systems. In 2013, another subcommittee was formed to build on the previous effort by developing a standard to evaluate the point-to-point distance performance of TLS anywhere in the measurement volume leading to the release of the ASTM E3125-17 [41] in 2017.
1.4. Scope and organization
In this article, we discuss instrument error sources in TLS systems (section 2), review test procedures reported in the literature to evaluate those errors (sections 3 and 4), describe research activity in support of and key aspects pertaining to published documentary standards for performance evaluation including field check procedures (section 5), address measurement uncertainty and traceability issues (section 6), discuss performance tests for other error sources not described in prior sections such as for reflectance and angle of incidence (section 7), and present a discussion (section 8) and conclusion (section 9).
2. Instrument error sources
2.1. Sub-systems and usage
2.1.1. Construction.
A TLS system is similar in construction to a theodolite or a laser tracker in that the range finding unit is mounted on a two-axis gimbal mechanism so that the laser beam can be steered to different points in the measurement volume. In the case of a theodolite, the telescope is mounted directly on the instrument head [42] while in the case of a laser tracker the source is either mounted in the fixed base or on the head [3]. The TLS is different from both these instruments in that the laser source is mounted on the rotating platform as shown in figure 3 and the laser beam is deflected to the target through a rotating mirror assembly, also shown in figure 3. As a result, opto-mechanical misalignment error sources in TLS systems differ from error sources in theodolites and laser trackers. An angle encoder attached to the fixed base (not shown in figure 3) measures the horizontal angle and another angle encoder on the rotating platform (also not shown in figure 3) measures the vertical angle.
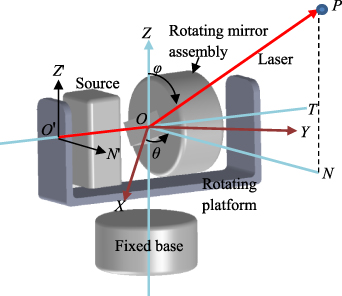
Figure 3. Construction of a TLS and coordinate system definition. Reprinted from [43], Copyright (2015), with permission from Elsevier.
Download figure:
Standard image High-resolution image2.1.2. Operation.
TLS systems function differently from a laser tracker in that TLSs do not track a target, instead they scan a region of the measurement volume. In the case of laser trackers, the operator carries a cooperative target and manually probes the locations on the object where a measurement is required. In the case of the TLS, the operator establishes various scan parameters in the software such as the resolution, region in the measurement volume where scan is required, and sometimes other parameters such as scan density, scan quality, scan speed, etc. The operator then initiates the scan, allowing the instrument to automatically acquire 3D point cloud data in the selected region of the measurement volume.
Performance evaluation procedures consider two modes of TLS operation—front-face and back-face modes. The mirror that deflects the laser beam from the source to the measurement volume rotates continuously and in only one direction. As the mirror deflects the beam in a downward motion from the zenith towards the base of the instrument (or the tripod), the vertical angle increases from 0° to 180°. The face from which the laser beam emerges can be regarded as the front-face of the instrument. The same region in the measurement volume can also be measured when the TLS head has rotated about the vertical axis by approximately 180° so that the laser beam now emerges from the opposite face of the TLS (vertical angle is now larger than 180° but smaller than 360°), i.e. the back-face. In an ideal case where there are no instrument error sources, the measured horizontal and vertical angles of a target in the front-face and in the back-face are identical. That is, however, not the case in practice. In fact, disparity in the measured angle using the two faces is a measure of the opto-mechanical misalignments in a TLS. A two-face test is a type of performance test where a single target is measured in both faces. The apparent distance between the front-face and back-face coordinates is a measure of the TLS's health. We discuss this test in section 4.6.
2.1.3. Coordinate system.
For purposes of describing opto-mechanical errors, we define the following coordinate system. A Cartesian coordinate system XYZ is fixed to the scanner base with its origin located at O as shown in figure 3. Two axes OT and ON are attached to the platform that rotates about the Z axis. Axis OT is referred to as the horizontal or transit axis. The Z axis is referred to as the vertical or standing axis. The mirror rotates about OT. Axis ON is orthogonal to OT and OZ. Axes OT and OZ intersect at O (the gimbal point), which also coincides with the point where the laser beam strikes the mirror and is deflected towards a point P in the measurement volume. The outgoing laser beam path lies in the ONZ plane. Point O' lies on the OT axis and is near the source where the laser is emitted. We refer to the plane O'OP as the laser plane; this plane contains the laser beam emitted from the source and the beam deflected to the point P. Axes O'N' and O'Z' are parallel to ON and OZ respectively.
2.1.4. The use of targets.
As we mentioned earlier, TLS systems measure 3D coordinates from passive reflection of the laser beam from surfaces in the scene, thus no specialized targets are necessary. However, for purposes of performance evaluation, it is common to employ targets, for which measurement data can be reduced to a single point. Examples of such targets includes planar artifacts, spheres, cylinders, pyramids, contrast targets, etc. These targets typically also allow the measurement of the same point using an instrument of higher accuracy such as a laser tracker or a total station. Because this paper describes methods for evaluating the performance of a TLS, it is assumed that the TLS systems are measuring targets in the measurement volume.
2.2. Ranging errors
TLS range is measured with respect to point O in figure 3. The range measurement error can be described using two components—a constant zero offset and range-dependent errors. If the zero of the ranging scale does not coincide with point O, the result is a zero-offset error, and this is a constant error in the range. The range-dependent errors can take a number of forms, i.e. they are not necessarily linear. Periodic errors have been reported in the literature [44, 45]. See Rüeger [46] for a more detailed description of ranging errors in electronic distance meters (EDMs). In addition to the intrinsic errors in the range measurement technology, ranging errors of a TLS are strongly influenced by other factors such as the angle of incidence, the environment, and the characteristics (material and optical) of the measured surface. Methods to assess ranging errors are reviewed in section 3.
2.3. Volumetric errors
Mechanical and optical misalignments comprise offsets, tilts, and eccentricities in the construction of TLSs that result in volumetric errors, i.e. errors in the measured horizontal and vertical angle (and sometimes in the range as well). As mentioned earlier, TLS systems are similar in construction to theodolites and therefore early work in modeling TLS errors were based on theodolites, see Deumlich [42] for a comprehensive review of theodolite error sources.
Two common error sources in theodolites are transit tilt (also known as trunnion axis error, figure 4(a)) and collimation error (figure 4(b)). Both sources contribute to error in the measured horizontal angle. Transit tilt [43, 47–55] is the non-orthogonality (i.e. squareness error) between the transit (horizontal) axis and the standing (vertical) axis. The effect of this error source is a tilted trajectory of the laser beam such that the beam never passes through the zenith. An aligned transit axis would result in the laser beam tracing the arc AC in figure 4(a), while arc AB is an example of a tilted beam trajectory.
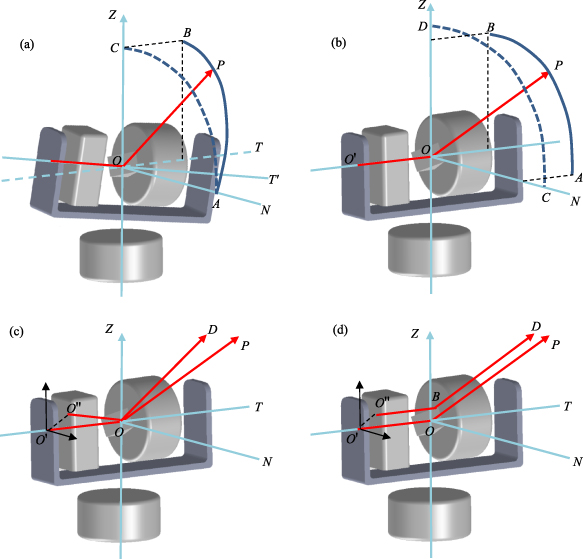
Figure 4. (a) Transit tilt (trunnion axis error), (b) collimation error, (c) beam tilt error, and (d) beam offset error.
Download figure:
Standard image High-resolution imageIn theodolites, collimation error is the non-orthogonality between the telescope (collimation axis) and the transit axis. In TLSs, non-orthogonality of the laser beam (collimation axis) with the transit axis may be due to a tilt in the mirror or a tilt in the laser beam emerging from the source. This distinction is not clearly brought forth in early literature [47–55], where it is assumed that mirror tilt is the only cause of the non-orthogonality of the laser beam. In figure 4(b), the effect of collimation error due to mirror tilt is that the laser beam follows the arc AB instead of the arc CD. The laser beam never passes through the zenith of the instrument.
It is also possible to produce an effect similar (though not identical) to mirror tilt if the laser beam emerges from the source O'' with a tilt as shown in figure 4(c). One component of this tilt causes the beam to follow the path AB in figure 4(b) resulting in a horizontal angle error while another component produces a vertical angle error, see Muralikrishnan et al [43] for a description of this error source.
In the case of theodolites, if the telescope axis (collimation axis) does not intersect the transit axis, it results in an error in the measured vertical angle, see Deumlich [42]. While early modeling reported by [21, 50, 52, 54] simply adopted this offset as an error source, a more careful analysis of this error source is described by Muralikrishnan et al [43] where they consider the true source of this error, i.e. an offset in the laser beam source which in turn produces an offset of the collimation axis, see figure 4(d). Another error source is the non-intersection of the transit and standing axis, an error source referred to as transit offset. This error source results in a small ranging error but the more significant effect is on the measured vertical angle, see Muralikrishnan et al [43].
Vertical index offset, i.e. non-zero vertical angle at the zenith, is another TLS error source that is also common to theodolites. This offset results in a constant error in the measured vertical angle. This error is discussed in [43, 47, 48, 50, 51, 53, 56, 57]. Another error source is due to the bearing errors of the trunnion axis and are described by Ingensand et al [21]. Wobble of the head as it rotates about the vertical axis is another error source, it is described by Neitzel [55]. Another error source is due to the angle encoders themselves. Encoder scale errors can be resolved into different harmonics. First order scale errors (see Muralikrishnan et al [43] and Holst and Kuhlmann [50]) are due to the eccentricity of the encoder with the corresponding axis while second order scale errors may be due to tilt of the encoder with the corresponding axis, see Lichti [51] and García-San-Miguel and Lerma [57]. Higher order terms have also been included in models based on experimentally obtained data; these are referred to as additional parameters in the literature, for example, see Chow et al [58].
The objective of performance testing is to design test procedures that are sensitive to these error sources, see section 4 for more on this topic. As mentioned in section 2.1.2, several error sources described here are sensitive to two-face testing. That is, the sign of the error in the measured horizontal or vertical angle changes between the front-face and the back-face measurements of a target, resulting in an apparent shift in the target location. Thus, two-face testing is a quick and easy approach to detect numerous geometric/optical misalignments; see section 4.6 and Muralikrishnan et al [43] for more information.
2.4. TLS error models
An important objective of modeling errors is clearly to improve the accuracy of TLS measurements. This is typically achieved through an error model that captures the cumulative effect of different systematic sources of error on the measured coordinates. A generic form of an error model may be described as shown below:
where (
 ,
,  ) are the corrected range, horizontal angle, and vertical angle, respectively,
 ,
,  are the measured range, horizontal angle, and vertical angle, respectively,
  (i = 1 to q) are q misalignment parameters (for example, collimation error, transit tilt, encoder eccentricity, etc), and
  ,
,  , and
, and  are functions that captures the relationship between the measured and corrected coordinates.
There is a significant body of work reported by Lichti and his research group [51, 59–65] in the area of TLS error modeling for the purposes of improving TLS measurement accuracy. See section 4.5 under the topic of self-calibration for other examples of reported work in the area of TLS error modeling. The NIST error model [43] is an advancement from prior reported work in that it carefully considers the error arising due to the different sources described in section 2.3. This model was developed primarily to assist in designing test procedures that are sensitive to the different error sources in support of the development of documentary standards within ASTM. This model has since been adopted by other researchers [63, 66, 67]. We briefly address such sensitivity analysis based test-position determination in section 5.2.
3. Characterizing TLS ranging errors
3.1. Overview
The range measurement system is a critical component of a TLS and provides the link to the SI unit of length, the meter. Evaluating the ranging errors is therefore an important step towards establishing metrological traceability of TLS measurements. Although the range measurement system of a TLS may be based on time-of-flight or phase-shift technology [4, 68], the overall test procedures remain the same and are discussed next.
The zero error (which is the constant error in the range) is typically evaluated by comparing the distance measured between two targets on opposite sides of the TLS as shown in figure 5(a) against a reference value established by an instrument of higher accuracy. In figure 5(a), if the instrument has a positive range error, i.e. it always reads longer than the true value, that error is manifested in measurements of both targets A and B, thus, the distance between A and B is larger by twice this amount. An alternate least-squares adjustment-based method to detect zero error without requiring a reference measurement is briefly mentioned at the end of section 3.2.

Figure 5. (a) Test for zero error, (b) test for relative range error. Reprinted, with permission, from [41], copyright ASTM International, 100 Barr Harbor Drive, West Conshohocken, PA 19428. A copy of the complete standard may be obtained from ASTM International, www.astm.org.
Download figure:
Standard image High-resolution imageThe component of the ranging error that scales with distance cannot be as easily quantified. This is because absolute range measured by a TLS is with respect to its gimbal point O in figure 3, which is at the intersection of the horizontal and vertical axes of the instrument, and this point cannot be probed by a reference instrument. Ranging error tests of a TLS are therefore relative in nature, i.e. with respect to a point in space that can be probed by both the TLS and a reference instrument. In figure 5(b), target A is at the reference position (position either arbitrarily chosen or at the minimum stand-off distance). Targets B, C, and D are at the test positions (additional targets E, F, etc, are not shown), where we are interested in evaluating the relative-range error. The TLS distances between targets B and A, C and A, D and A, etc, are compared against the corresponding reference values obtained by an instrument of higher accuracy. The combination of the zero error and the relative range errors provide an overall picture of the ranging errors expected of a TLS. The errors obtained from these tests are valid for the targets employed and in the environmental conditions at the time of testing.
While the basic structure is the same, these tests have been realized differently over the years—i.e. in controlled and outdoor environments, using targets made of materials commonly used and those carefully devised, over short and long distances, and comparing against nominal values and against reference values carefully realized using instruments of higher accuracy such as a laser interferometer, total station, laser tracker, etc. Each method has its own advantages and limitations; from the perspective of performance evaluation, i.e. whether a TLS meets the manufacture's specifications depends on the rated conditions associated with those specifications. For example, if a manufacturer provides an MPE specifications that is valid for just one type of target, then, clearly, the performance test must be performed with that type of target. We review different realizations of the zero error and relative ranges tests in the next sub-sections and address standardized performance tests in section 5.
3.2. Zero error
The method to determine the zero error in spherical coordinate measurement systems using two targets placed on opposite sides as shown in figure 5(a) is well established; the method has been used for laser trackers since their invention in the mid-1980s [3]. It is generally referred to as the 'inside-outside' test or the 'buck-in buck-out' test. For laser tracker testing, the laser tracker has a ranging unit of sufficient accuracy that it can be used to establish the reference value from the outside, i.e. from a position that is in-line with the targets but with both targets on the same side of the laser tracker (such as shown in figure 5(b) for targets A and B). This position is not sensitive to the zero errors in the ranging unit and therefore the length obtained can be considered as the reference value. The measurement performed with the laser tracker in-line with the targets and inside the length is the test measurement. This position (shown in figure 5(a)) will register twice the zero error. It is preferable to measure one target in front-face and the other in back-face to deconvolve the effects of zero-error and transit offset (the offset between the standing axis and the transit axis, see section 2.3). When performing the zero error test as described above, it is necessary to ensure that the instrument under test and the two targets are collinear to the extent possible to reduce the contribution of angular errors into the zero error measurement. For example, the ASTM E3125-17 requires this alignment to be performed so that both targets are within ±10° of the nominal azimuth location from the TLS (i.e. if one target is at 0°, the other must be within 180°± 10°).
In the case of TLS systems, the ranging unit might not be sufficiently accurate to establish the reference value; therefore, instruments of higher accuracy might be required for that purpose. The targets are generally placed close to the TLS system (on the order of a few meters), but not closer than the minimum stand-off distance, if such a distance is specified by the manufacturer. Placing the targets at a large distance will combine the range-dependent term of the ranging error with the zero error, thus making the test less sensitive to the zero error term.
This inside-outside approach was used by Boehler et al [29] using spherical targets. The zero errors for the TLS systems tested ranged from about 4 mm to 72 mm. One difficulty with using spherical targets is that it can be challenging to establish the reference values with an instrument of high accuracy such as a laser tracker. Rachakonda et al [69] used a laser tracker as the reference instrument and manually probed the surface of each sphere target with an SMR to obtain the center of the sphere and therefore the reference value for the distance. This method is labor intensive and time consuming.
In another experiment, Ferrucci et al [70] used TLS manufacturer provided contrast targets instead of sphere targets. The contrast targets are flat plate targets with black and white triangles printed on the front side; see figure 6(a). A partial 38.1 mm (1.5 in) nominal diameter sphere is mounted on the back side in such a manner that the center of the sphere is coincident with the intersection of the triangles on the front side; see figure 6(b). The target in-plane concentricity error between the mechanical and optical centers was reduced by averaging measurements from two orientations of the target that were rotationally 180° apart. Because the targets can be mounted on magnetic nests designed for standard 38.1 mm (1.5 in) diameter SMRs, the reference distance between the targets can be easily calibrated using a laser tracker. In the case of the experiments conducted by Ferrucci et al [70], the zero error was about 0.1 mm before factory calibration and about −0.4 mm after factory calibration (i.e. factory calibration appeared to somewhat increase the zero-error).
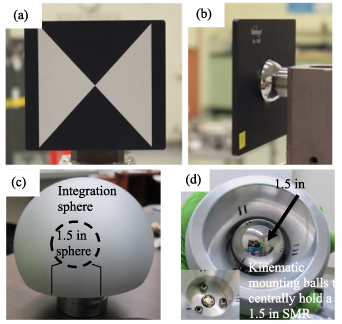
Figure 6. (a) Front-side of contrast target showing intersecting black and white triangle, (b) back-side of contrast target showing partial 38.1 mm (1.5 in) sphere, (c) specialized sphere targets, and (d) back-side of sphere target showing 38.1 mm (1.5 in) sphere and kinematic nests in the inset. Parts (a) and (b) are reproduced from [70]. © IOP Publishing Ltd. All rights reserved. Parts (c) and (d) are reproduced with permission from [71].
Download figure:
Standard image High-resolution imageMuralikrishnan et al [71] performed the zero error test using specialized sphere targets that centrally house a 38.1 mm (1.5 in) SMR nest, see figures 6(c) and (d). These sphere targets are available commercially (and referred to as integration spheres), and the concentricity between the outer sphere and the center of the SMR was found to be within 0.01 mm. Two such specialized spheres were mounted so that they were separated by several meters but facing each other. The TLS was placed in line and equidistant from the spheres to realize the inside-test. Because the SMRs located inside the spheres face opposite directions, a laser tracker from a single location did not have line-of-sight access to both SMRs. The center-to-center distance was calibrated using a laser tracker and three additional registration nests as described in their study.
We note here that the zero error can also be determined through an alternate procedure based on distance measurements on a test line from a least-squares adjustment process. The method is described in ISO 17123-4 for EDMs and described by Tsakiri et al [72] for TLSs. The procedure is as follows. Several locations are identified on a test line as shown in figure 7. The instrument is centered on position 1 of the test line and the six distances to the targets 2 through 7 are measured. The instrument is then centered on position 2 and the five distances to the targets 3 through 7 measured. This process is repeated as the instrument is moved successively to the next position until all 21 distances are measured. The test line is not calibrated. A measurement model is setup where the unknown parameters are the zero error and the distances between pairs of positions. The zero error is then obtained from the consistency of the measured distances, i.e. through a least-squares bundle adjustment. The disadvantage of this technique is that the zero error obtained in this manner might be expected to have larger uncertainty because range-dependent errors (for example, environmental effects) contribute to the estimate of the zero error. However, the clear advantage is that no special reference instrument of higher accuracy is necessary. Rüeger [46] describes the detection of the zero-error and other ranging errors in his seminal textbook on this topic.

Figure 7. Test line for determination of zero error. Reproduced from [72], © IOP Publishing Ltd. All rights reserved, redrawn for clarity.
Download figure:
Standard image High-resolution image3.3. Relative-range error
3.3.1. Baseline pillar studies.
EDM calibrations of surveying instruments are performed on baselines established and maintained by organizations around the world. In the United States, the National Geodetic Survey has established more than 400 baselines to calibrate EDMs. Because early TLS applications were in surveying and such baselines were often used in assessment of surveying equipment, early ranging performance tests on TLS systems were performed on geodetic baselines. See Rüeger [46] for a detailed overview of baseline designs for EDM calibrations. The baselines are easily realized using stable pillars mounted on straight line, but care must be taken in positioning the pillars so that ranging errors (as well the zero error) can be detected with low uncertainty, as noted by Rüeger.
An early TLS ranging error study reported by Gordon et al [20] was conducted using the Curtin University EDM calibration baseline. The baseline is approximately 600 m long (see figure 8(a)) and represents the primary EDM calibration facility in Western Australia and regularly maintained using instruments with higher accuracy than TLSs. Targets comprised of low-cost reflectors mounted on standard surveying targets were fixed to five pillars on the baseline, 20 m apart from each other. Ranging tests revealed errors in the pillar-to-pillar distance between 3 mm and 15 mm. Studies on the same baseline were also reported by Lichti et al [25, 26].
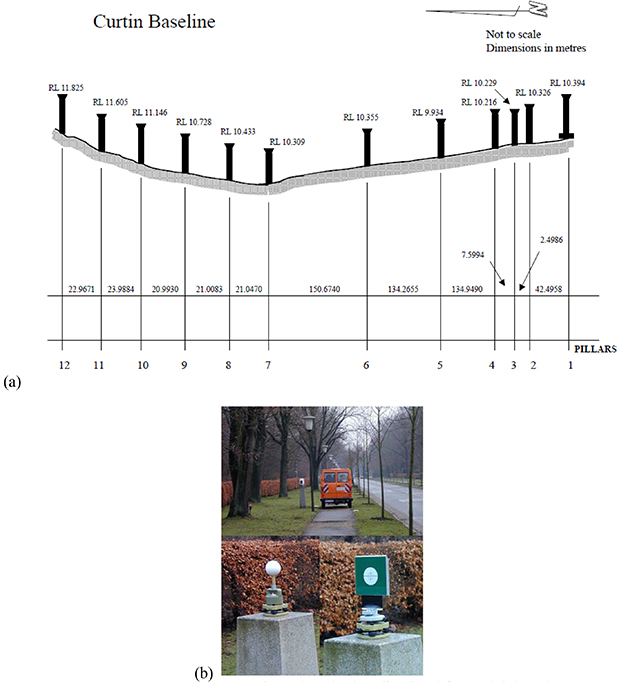
Figure 8. (a) Curtin University baseline in Western Australia. Reproduced with permission from [25]. (b) Measurements made at the HAW baseline in Hamburg-Ohldorf, Germany—TLS shown on top (on pedestal next to the van) with sphere and special targets shown at the bottom. Reproduced from [73]. CC BY 3.0.
Download figure:
Standard image High-resolution imageKersten et al [73] described measurements made at the baseline in the Department of Geomatics, Hamburg University of Applied Science, located in Hamburg-Ohldorf, Germany. Eight pillars over a range of about 100 m were equipped with both spheres and targets using special adaptors, see figure 8(b). The results showed that the distances to the targets on the baseline are consistently longer by 3.4 mm compared to reference distances. The distances to the spheres appeared longer by 8.3 mm when using automatic sphere center determination routines. Whereas when using manual computation with point dispersion elimination, the sphere center distances were 3 mm shorter. This indicated that sphere point cloud dispersion was a potential problem in ranging error estimation. We address the problems with sphere targets for ranging in section 5.1.
Zhang et al [74] described ranging experiments conducted using baseline pillars with the reference values established using a Kern Mekometer. Targets comprised of reflective tape on a standard survey plate were fixed to seven pillars distributed over 800 m. All 21 inter-pillar distances were calibrated using the Mekometer and subsequently measured by the TLS under test. Large errors, on the order of 100 mm, were observed over the first 100 m while the scale errors over longer distances were on the order of 14.8 mm + 5.9 mm km−1.
While baseline pillars allow range error evaluation over large distances, environmental effects play a significant role in the measurements, and therefore, it is difficult to evaluate the intrinsic ranging error of the instrument under test. We describe ranging tests performed in a more controlled environment by direct comparison against reference instruments in the next section.
3.3.2. Comparison against reference instruments.
Relative-range errors of a TLS can be evaluated in a setup as shown in figure 5(b) where the distances between the Target A at the reference position and Targets B, C, etc, in the test positions are determined using both the TLS and a reference instrument. The TLS measured distances are then compared to the same distances measured by the reference instrument to determine the relative-range error. Such tests have been performed with different target designs and different reference instruments.
A laser interferometer is an obvious choice for a reference instrument because it offers high accuracy and is frequently available in metrology laboratories. Boehler et al [29] reported on ranging tests performed on about a dozen TLS systems where a sphere was placed on an interferometric comparator and moved to six positions at 1 m spacing. The test was performed over a short range from 3 m to 8 m distance. The measured displacements were compared against the interferometer. The resulting errors were as small as a few tenths of a millimeter for some TLS systems and as large as 20 mm for others.
Ingensand et al [21] reported on range measurements on a TLS performed on a 52 m calibration track, where the reference values were established using an interferometer. The TLS manufacturer-provided target was moved from a distance of 5 m to 45 m in steps of 5 m. The results showed a 400 mm km−1 error, i.e., an error of about 18 mm at 45 m, which exceeded the instrument specification of 6 mm for single point accuracy for distances above 20 m.
Schulz and Ingensand [75] reported on range measurements of a TLS in two modes—the static mode and the scanning mode. In the static mode, the TLS is used as a total station in that the laser beam was oriented to the object by an initial rotation of the mirror, after which the mirror remained stationary. This mode of operation is not commonly available in commercial systems today. Evaluation of both modes were performed on an interferometric bench over a length of 52 m using white paper targets with a black scale (to align the laser beam) marked on it. Errors in distances between two near positions along the bench were within ±4 mm. Scanning mode measurements were performed using white sphere targets. The measurements were performed separately for spheres of two different sizes, 151.4 mm and 120.2 mm. For each case, the distances between sphere targets were computed in two different ways—using unconstrained and constrained-radius fitting. The results indicated that deviation in the distances between center points and reference values established interferometrically showed a constant error of about 4 mm. The result with constrained (i.e. fixed diameter) fitting showed smaller errors in the distance between sphere centers. For the unconstrained fitting case, errors were generally smaller than 8 mm until a distance of approximately 15 m, above which the errors increased. The results show that fixed radius fitting provided smaller errors, a conclusion that ASTM E57 group also came to when developing the E3125-17 standard, see Shilling et al [76].
A total station and a laser tracker are more convenient and practical choices as a reference instrument than a laser interferometer. Total stations are not as accurate as laser trackers at comparable distances but do offer longer measurement range. Johansson [22] described ranging tests of three different TLS systems by comparing them against a total station. Because the focus of the study was on as-built environments, the target was made of wood. The accuracies reported were on the order of 10 mm to 15 mm. Fuss et al [77] reported on ranging measurements performed using spherical targets mounted in a horizontal line on a wall and compared against a laser tracker. The TLS was placed close to the line of spheres so that angular errors did not contribute to the measurements. Mechelke et al [78] reported on ranging tests on four scanners over a distance ranging from 10 m to approximately 100 m in increments of 10 m. Reference values were established using a total station. Sphere targets were used for two scanners while flat targets were used for the other two scanners. The ranging errors were on the order of a few millimeters for these tests.
Salo et al [45] described an 80 m bench setup to determine errors of a TLS using a tacheometer as the reference. In that study, the TLS was placed at one end of the bench while the tacheometer was placed at the other end. A moving sled on the bench carried two targets, one for the tacheometer and another for the TLS. Measured errors were on the order of several millimeters. Staiger and Ettel [27] also report on a distance measurement accuracy study where reference values are established using a tacheometer. Ferrucci et al [70] described ranging tests performed on a scanner before and after factory calibration. They used a manufacturer-provided contrast target (figure 6(a)) that was mounted on kinematic seats located at 1 m increments from a distance of 2 m up to 14 m from the scanner, see figures 9(a) and (b). A laser tracker was used as the reference instrument in their studies. While the overall magnitude of the ranging errors was as large as 0.3 mm both before and after factory calibration (i.e. factory calibration did not reduce the relative-range errors), the behavior of the errors as a function of distance changed. Similar studies using a total station or a laser tracker have been reported by others, for example, see Gonzalez-Jorge et al [79] and Lee et al [80].
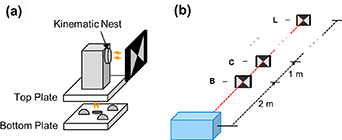
Figure 9. (a) Contrast target mounted on a kinematic seat so it can be moved from one position to the next along the measurement line, (b) showing the TLS and contrast targets at different test locations. Reproduced from [70]. © IOP Publishing Ltd. All rights reserved.
Download figure:
Standard image High-resolution image3.4. Range noise
TLS range data are inherently noisy. While the zero error and the relative-range error provide a measure of the systematic error in the range when measuring a target, they do not by themselves provide a measure of the noise. In order to quantify range noise, researchers have calculated the standard deviation from a best-fit plane to data obtained on a plane. For example, Hiremagalur [30] describe a test fixture consisting of two gray aluminum plates mounted on a white aluminum plate, see figure 10(a). This fixture was scanned at different distances (25 m, 50 m, 75 m, and 100 m) and the RMS values reported as a measure of the range noise. Wunderlich and Wasmeier [31] describe a fixture shown in figure 10(b). Their setup consisted of a 60 cm × 80 cm flake board coated with white diffusive material. Three photographic gray value cards are attached in the center (Opteka gray cards, black RGB 16/16/15, gray RGB 162/162/160 and white RGB 220/224/223) as shown in figure 10(b). The board was scanned at different distances and the least-squares best-fit values from each portion of the fixture determined. Other such studies on range noise [20, 81–83] have also been reported. Range noise is a quantity that is required to be reported as part of both the ASTM E2938-15 and ASTM E3125-17 standards.

Figure 10. Range noise test fixture reported by (a) Hiremagalur [30], (b) Wunderlich and Wasmeier [31]. Part (a) reproduced with permission from [30]. Part (b) reproduced with permission from [31].
Download figure:
Standard image High-resolution image4. Characterizing TLS volumetric performance errors
4.1. Overview
The objective of TLS volumetric performance evaluation is to quantify the effect of instrument opto-mechanical misalignments on the measured point coordinates and to determine whether the instrument meets manufacturer specifications. Because it is not possible to establish, using a reference instrument, the location of a point with respect to the TLS's coordinate system, volumetric performance evaluation typically involves the measurement of reference lengths in various orientations within the measurement volume. Reference lengths may be realized in different ways:
- Using pre-calibrated artifacts.
- Realized in situ using a laser interferometer, laser tracker, etc.
- Realized using a network of targets in the measurement volume that are calibrated using an instrument of higher accuracy such as a laser tracker, total station, etc.
- Realized using a network of targets in the measurement volume that are either un-calibrated or self-calibrated using the TLS itself.
We discuss these different approaches in this section. We also discuss two-face tests, which may be considered as a special case of zero-length test, for volumetric performance evaluation.
4.2. Pre-calibrated artifact-based methods
In early TLS accuracy studies, prismatic objects have been measured and compared [84–87] to either nominal or reference values to evaluate TLS systems. More careful metrological performance evaluation with carefully constructed artifacts has also been reported in the literature. For example, González-Jorge et al [88] developed an artifact comprising spheres and cubes as shown in figure 11(a). The center-to-center distances between the spheres were calibrated on a Cartesian coordinate measuring machine (CMM). The inter-sphere distance was designed to evaluate the accuracy of the TLS, the faces of the cubes were used to assess precision, and cubes themselves were used to determine resolution.
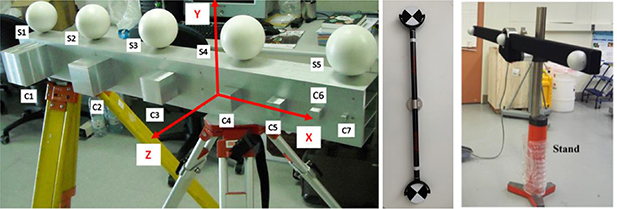
Figure 11. Artifacts used for performance evaluation of TLS systems: (a) scale bar with spheres and cubes, reprinted from [88], Copyright (2011), with permission from Elsevier. (b) twin-target pole, reproduced with permission from [Leica Geosystems]. (c) scale bar with three sphere targets, reprinted from [89], Copyright (2020), with permission from Elsevier.
Download figure:
Standard image High-resolution imageLong scale bars such as those used for the evaluation of laser trackers have been adopted for performance evaluation of TLS systems. Ferrucci et al [70] described the use of a 2.3 m long scale bar with contrast targets (targets shown in figure 6(a)) mounted on the ends. While long scale bars provide a larger angular sweep and therefore are more sensitive to some of the error sources outlined in section 2.3, their length is not constant and must therefore be calibrated in situ. Shi et al [90] described the use of a 1.15 m scale bar that can be rotated about one end to effectively form a 2.3 m long scale bar. The commercially available twin-target pole (figure 11(b)) can be used for field testing of TLS systems. The center distance between the targets is calibrated by NIST [91]. Another design of a scale bar is available commercially (figure 11(c)) with three sphere targets to realize all tests described in the ASTM E3125-17 standard. Wang et al [89] described methods to calibrate the lengths between centers of the spheres of this scale bar using a laser tracker.
4.3. In situ reference lengths
An alternate approach to realizing reference lengths is to construct the reference length during the time of the scan. This method is typically employed for the case of ranging performance evaluation because it is difficult to construct pre-calibrated artifacts that are tens or hundreds of meters long. The idea of realizing the reference length in situ has been also employed for volumetric performance evaluation. Hiremagalur et al [30] constructed reference lengths in situ using a translation stage. They placed a sphere and a custom target on the stage and moved it by 4.75 mm to determine the displacement error. This test was performed at a distance of 25 m and again at a distance of 75 m. In another study, Schulz and Ingensand [75] realized reference lengths using a calibration track. Shi et al [90] used a rail and carriage to characterize TLS volumetric errors where the reference values were established in situ using a laser tracker.
4.4. Calibrated network
One approach to realizing reference lengths is to construct a network of targets in the measurement volume and calibrate the target coordinates (and therefore, the inter-target distances) using an instrument of higher accuracy. Kersten et al [73, 92] and Mechelke et al [78] described a comprehensive study to characterize TLS errors through the network method. They established a network of 43 points in their facility at the Department of Geomatics, Hamburg University of Applied Science, located in Hamburg-Ohldorf, Germany, see figure 12. The reference points were measured using a total station with prism targets. These were then replaced with sphere targets for the TLS. All combinations of distances between sphere targets were compared against the reference values. The observed errors were on the order of 10 mm or so. Similar network tests have been reported by [17, 19, 25, 26, 28, 77, 93–95].
Figure 12. (a) 3D test field at the Hamburg University of Applied Science showing TLS and targets distributed in a large room (b) targets employed for the TLS and reference instrument, (c) example point cloud obtained from a sphere target. Reproduced from [73]. CC BY 4.0.
Download figure:
Standard image High-resolution image4.5. Uncalibrated or self-calibrated network
4.5.1. Uncalibrated network.
An uncalibrated network of targets measured from multiple positions of the TLS can provide statistics on the dispersion of the data and is the basic principle of the testing in the ISO 17123 series of standards, which have been adopted by Tsakiri et al [72] for TLS. Tsakiri et al [72] evaluated the angular precision for the horizontal and vertical angles as follows. A network of five targets was established as shown in figure 13(a) at distances ranging from 12 m to 100 m from the TLS, to evaluate the precision of the horizontal angle. Four targets were in a horizontal plane and one target was at a different height. Four series of measurements were performed on the targets; the TLS was rotated about the vertical axis by 120° between series. In each series, the targets were first measured sequentially from the first to the fifth and then again from the fifth to the first. The mean and standard deviation of the horizontal angles to the targets were determined through a least-squares adjustment process. A similar process was adopted to determine the precision of the vertical angle. A vertical rod with six targets was placed 30 m from the TLS, as shown in figure 13(b). The height of the TLS was adjusted so that three targets were below the TLS and three targets were above. Four series of measurements were performed, and, in each series, the targets were measured sequentially from the first to the sixth and then again from the sixth to the first. The TLS was not rotated about the vertical axis between series. The mean and standard deviation of the vertical angles to the targets were determined through a least-squares adjustment process.
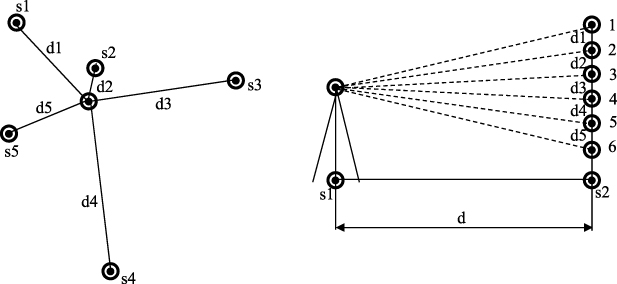
Figure 13. Uncalibrated network of targets for (a) horizontal angle testing, (b) vertical angle testing. Reproduced from [72], © IOP Publishing Ltd. All rights reserved, redrawn for clarity.
Download figure:
Standard image High-resolution image4.5.2. Self-calibrated network.
Self-calibration is the process of determining error model parameters of an instrument without the use of reference artifacts or measurements and is typically employed out in the field. Early discussions of self-calibration are provided in Geilsdorf et al [96], Lichti et al [51, 64, 65], and Reshetyuk [97], while subsequent studies are given in [47, 49, 50, 54, 56–58, 67, 98–100]. While self-calibration is not directly a topic of this review, it can be used to create reference lengths with sufficient accuracy that these lengths may then be used for TLS performance evaluation. This idea was briefly mentioned by Hughes et al [101] for laser tracker performance evaluation and has been explored in detail by Shi et al [102] for TLS performance evaluation. The basic idea is to use the TLS under test to measure a set of stationary targets from multiple positions. Shi et al [102] showed that the averaging process reduces the effect of the systematic errors in inter-target distances, but the uncertainty in those lengths might still be substantial. They suggest fitting the TLS error model as part of the bundle-adjustment, thereby significantly reducing the uncertainty in the inter-target distances. Those distances can then be used as reference values to evaluate the performance of the TLS. Some networks employ measurements of the targets in both faces (i.e. two-face measurements) of the TLS to obtain TLS error model parameters and reference lengths with lower uncertainty. We discuss two-face measurements as a stand-alone testing approach (as opposed to being a part of a network measurement) in the next section.
4.6. Two-face testing
Some TLS systems can measure a target in two faces as noted in section 2.1.2. In the absence of instrument misalignments, measurements from both faces should yield the same coordinate for the target. Various geometric/optical misalignments result in an error in the measured coordinate that changes with sign between the faces. Thus, measurement of a single target from the front-face and again from the back-face provides slightly different target coordinates, and therefore, the apparent distance between the coordinates is a measure of the inherent errors in the system. Such front-face/back-face measurement is also called a two-face test. Some error sources discussed in section 2.3 are sensitive to horizontal angle, some are sensitive to vertical angle, while others are sensitive to range. It is therefore necessary to perform this test at different combinations of range, horizontal angle, and vertical angle. Ferrucci et al [70] and Muralikrishnan et al [43] described two-face tests on a TLS system while Holst et al [103] describe the use of two-face measurements in a practical application.
5. Documentary standards
Clearly, there have been numerous efforts to characterize ranging and volumetric errors in TLS systems and each method has its own advantages and disadvantages. For a user interested in purchasing a TLS system, it is advantageous to have standardized test procedures that capture the error sources in these systems. Standardized test procedures also drive manufacturers to provide specifications that are comparable across systems, allowing users to make purchasing decisions more easily.
There are currently two published performance evaluation standards for TLS systems—the ASTM E2938-15 and the ASTM E3125-17. There is also one field check standard—the ISO 17123-9. We discuss research that supported the development of and key aspects of the published standards in this section. We do not discuss the VDI/DVE 2634 [32] series here because they primarily pertain to triangulation type systems.
5.1. ASTM E2938-15
With the goal of standardizing performance testing in mind, NIST researchers organized three workshops between 2003 and 2006 [104–106] to determine the needs and interests of all stake holders. The participants of these workshops agreed that the development of documentary standards would benefit TLS users and would help promote widespread use of the technology. After the end of the third workshop, the ASTM E57 committee on 3D Imaging Systems established a working group and commenced developing documentary standards for TLS systems. The group focused on test methods for ranging errors, as the ranging unit is a critical component of TLS systems and its standardization was a task that they believed was manageable in a reasonable time frame. Early progress in ranging error evaluation by committee members in this group is described in [82, 107–109].
5.1.1. Scope.
As part of the work performed to develop a ranging protocol, Cheok et al [107] note four influence factors that affect range measurement—distance to target, reflectivity, angle of incidence, and TLS horizontal angle. In early discussions, the committee considered evaluating the relative-range error for five different target distances, five different target reflectivity values, four different beam incidence angles on the target, and four different horizontal angles of the TLS. From the 400 possible combinations, 60 were initially proposed to be tested. A planar target was considered for the testing, thereby removing the effect of target geometry on the measurements. Eventually, the committee decided to only include one test procedure in the ASTM E2938-15 standard arguing that if the basic test procedure was available, the influence of reflectivity, distance, and other factors could easily be determined without any modification to the test procedure. That is, test procedure can easily be repeated for various reflectivities, distances, etc. The test procedure, which is described in section 5.1.3, was later also adopted in the more comprehensive ASTM E3125-17 standard described in section 5.2.3.
5.1.2. Choice of targets.
While the ASTM E2938-15 and the ASTM E3125-17 mandate the use of a planar target, practical realization of the test procedure using a planar target poses significant challenges because it is not easy to ensure that the TLS and the reference instrument measure the same point in space. We refer to this as the point coincidence problem and discuss it next. We also discuss the challenges with sphere targets (although these are not the mandated geometry in the standards), and present hybrid targets as an alternate that combine the advantages of both the sphere and the planar targets.
5.1.2.1. Point coincidence problem with planar targets.
Consider a plate target measured by a TLS as part of a relative-range test, shown in figure 14, where the reference instrument (a laser tracker) is positioned on the other side of the target. The reference instrument identifies points O1 and O2 at the two positions of the target. Suppose the TLS identifies A1 and A2 as the points on the target, then, figure 14(a) shows that displacement determined by the TLS A1A2 is larger than the reference displacement O1O2 by approximately d(1-cosα) (d is the offset A2O2), which is an error introduced by the measurement setup. Suppose instead the TLS identifies B1 and B2 as the points on the target, then, figure 14(b) shows that the displacement determined by the TLS B1B2 is larger than the reference displacement O1O2 by approximately e(sinα)+ d(1-cosα), where e is the offset A2B2. This additional error is also due to the measurement setup. The plate target must therefore be carefully aligned with the measurement axis to reduce the effect of this error source; this is a time-consuming task. We describe different ways reported in the literature to reduce or eliminate this alignment requirement.

Figure 14. Effect of plate misalignment (exaggerated for illustration purposes) on relative range tests (a) showing the effect of offset d along the ranging direction (b) showing the effect of offset e perpendicular to the ranging direction. Reprinted from [110], Copyright (2017), with permission from Elsevier.
Download figure:
Standard image High-resolution imageBridges [109] proposed a method that involves using a laser tracker as the reference instrument with stands placed at the desired locations, all nominally collinear with the laser tracker. Each stand holds a kinematic seat that can accommodate either the T-bracket shown in figure 15 or a flat-plate target for the TLS. The T-bracket has four SMR nests as shown in figure 15. An SMR is first located in the central nest of the T-bracket. The T-bracket is placed successively on each stand and the stands are raised/lowered so that the central nests are collinear and aligned with the laser beam emanating from the laser tracker. SMRs are then placed on the remaining three nests of the T-bracket. The T-bracket is placed successively on each stand, all SMRs are measured at each position and the stands adjusted for yaw and pitch. This ensures that the plane of the T-bracket in each stand is perpendicular to the measurement line. The laser tracker is removed from its stand and placed on an adjacent stand from where it is used to perform the reference measurements. The TLS is placed in the stand vacated by the laser tracker and raised/lowered as needed. The flat plate target is successively placed on the kinematic seat on each stand for the relative range test. The target is previously aligned so its front surface is perpendicular to the measurement line. This method requires alignment and is time consuming.

Figure 15. Plate target alignment method proposed by Bridges [109]. Adapted with permission from [109], re-drawn by Vincent Lee, NIST, for clarity.
Download figure:
Standard image High-resolution imageBeraldin et al [82] and Mak et al [108] proposed a method that does not require careful alignment and is therefore easier to perform but their method requires two sets of measurements. They used planar targets mounted on tripods at different positions along the ranging direction of a TLS with the reference distances established using a laser tracker. To establish the point coincidence, they performed their measurements as follows. The TLS was placed in line with a series of stands as shown in figure 16(a). A laser tracker was placed next to the TLS, and therefore somewhat offset from the line of stands. Each stand contained a kinematic nest to hold a plate containing four SMRs, see figure 16(b). The plate with the SMRs initially held a secondary plate with three large white spheres as shown in figure 16(b). For this discussion, we only focus on one of these spheres, say, the central sphere. The laser tracker and the TLS measured the central sphere (in the case of the laser tracker, by manually probing the sphere) at the near and far positions. The centers of the central sphere at the near and far position were used to define a vector in space for each instrument, see figure 16(d). The secondary plate with the spheres was removed and the secondary planar test plate (see figure 16(c)) was then mounted on the plate with the SMRs. The four SMRs were measured by the laser tracker while the plate is scanned by the TLS, see figure 16(e). This process was repeated at each location of the stand. For the laser tracker, a plane was obtained from the four SMRs and the intersection of the vector and the plane provides the point used as reference at each location of the stand. For the TLS, the intersection of the plane determined from the test plate based on the TLS data and the corresponding vector provides the test point at each location of the stand. These coordinates are used to calculate the test and reference distances, from which errors were calculated.

Figure 16. (a) TLS in-line with a series of stands, (b) a secondary plate with large spheres mounted on a plate with four SMRs, (c) a secondary test-plate mounted on the plate with four SMRs, (d) establishing the line of measurement for the laser tracker, (e) performing the measurements on the plate artifact. Parts (a)–(c) are reproduced with permission from [82]. Parts (d) and (e) are reproduced from [108]. CC BY 3.0.
Download figure:
Standard image High-resolution image5.1.2.2. Problems with sphere targets.
Given the challenges associated with using planar targets, it may be tempting to use sphere targets for ranging tests because the center of the sphere can be uniquely determined by both the TLS and a reference instrument such as a laser tracker. Cheok et al [107] discussed the use of spherical targets for ranging error evaluation and note that while spheres do not require alignment, acquiring large sized spheres for far distances will be a problem. An additional problem experienced with sphere targets is that the sphere point cloud appears squished or flared in the data from some scanners [110–112]. This squishing/flaring causes an error in locating the center of the target, which results in a ranging error when, in actuality, the error is due to the geometry of the target. The TLS obtains an accurate estimate of the range in the region of the sphere that is closest to the TLS because the laser beam is approximately normally incident on the target surface. However, there are significant ranging errors towards the extremities on the sphere surface (i.e., regions on the sphere where the laser has large angles of incidence) because of local surface averaging of the laser spot, oblique incidence, etc. As an illustration, the measured and actual surfaces are shown in figure 17 along with the constrained and unconstrained circle fits to the measured surface data. It may be observed that the center of the constrained fit and unconstrained fit circles, O1 and O2, respectively, do not coincide with the actual center O; thus, there is an error in the measured range which arises entirely from the geometry of the target. Muralikrishnan et al [110] show how these errors can be quantified using a sphere centrally mounted on a plate, where the movement of the sphere center with respect to the plate is an indication of the magnitude of squishing/flaring. In addition to this problem, there are numerous other considerations in the processing of sphere point clouds as described by Rachakonda et al [113] and Urbančič et al [114]. Sphere targets are therefore not preferable for ranging error evaluation.

Figure 17. Illustration of sphere squishing/flaring in 2D. Reprinted from [110], Copyright (2017), with permission from Elsevier.
Download figure:
Standard image High-resolution image5.1.2.3. Hybrid targets.
An alternate to the planar and sphere targets are hybrid targets that combine the advantages of both targets. Muralikrishnan et al [110, 115] present a hybrid target with spheres placed on the sides of a plate artifact where the spheres simply served as fiducials to identify a point on the plate that is common to both instruments, see figure 18. In their technique, the laser tracker is located on one end of the measurement line while the TLS is located at the other end, such as shown in figure 14. The spheres on the artifact are specially designed so that they centrally hold a 38.1 mm (1.5 in) SMR inside, as shown in figures 6(c) and (d). At each position of the artifact, the TLS scans the plate and the spheres while the laser tracker measures the two SMRs located inside the spheres. For the laser tracker, the average of the SMR coordinates is considered as the reference coordinate at each position of the artifact. For the TLS, the point on the best-fit plane closest to the average of the sphere centers determined from the scan is considered as the test coordinate. Because the artifact is designed so that the average of the SMR center coordinates lies on the front face of the plate and is nominally coincident with the sphere centers as determined by the TLS, the point coincidence is realized in principle. The coordinates determined as described earlier are used to calculate the test and reference distances, from which errors can be calculated. Their method also does not require alignment and is, therefore, easier to perform and can be completed with just one set of measurements, but does require a specialized artifact.
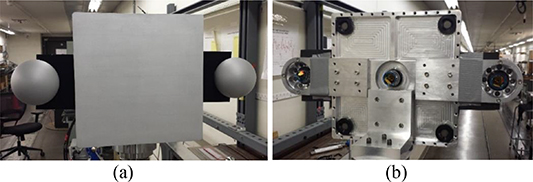
Figure 18. Plate-sphere target (a) front-side scanned by TLS, (b) back-side showing SMRs located inside the spheres. Reproduced with permission from [115].
Download figure:
Standard image High-resolution image5.1.3. Test procedure.
The ASTM 2938-15 standard describes a test procedure for evaluating the relative-range error of 3D Imaging Systems with maximum range of 2 m to 150 m. This test is applicable to all 3D Imaging Systems including spherical coordinate systems such as TLSs. The test procedure involves determination of the distance between two planar targets (or the displacement of a single target moved from position 1 to position 2) using the system under test, i.e. the TLS, and a reference instrument that provides substantially higher accuracy for the same distance, see figure 19. The error in the measured distance is compared against the MPE specification provided by the manufacturer to determine if the instrument under test has passed or failed. While the standard allows considerable flexibility in realizing the test, some aspects such as the flatness of the plate target(s), optical characteristics (reflectance factor, penetration depth), etc, must be within rated conditions accompanying the MPE. The standard does not prescribe how reference values shall be realized. It is up to the user to determine a suitable method to perform the reference measurement and estimate the uncertainty in that measurement. The plate target must be aligned carefully with the measurement axis to ensure that an offset between the center of the plate as determined by the TLS and the reference instrument does not affect the measurement as discussed in section 5.1.2. In addition to the distance error, the RMS value of the residuals from the best-fit plane are also reported.
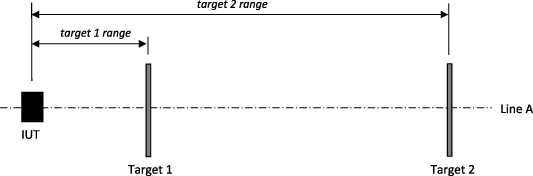
Figure 19. Relative-range test per the ASTM E2938-15 standard. Reprinted, with permission, from [40], copyright ASTM International, 100 Barr Harbor Drive, West Conshohocken, PA 19428. A copy of the complete standard may be obtained from ASTM International, www.astm.org.
Download figure:
Standard image High-resolution image5.2. ASTM E3125-17
Subsequent to the completion of the ranging protocol, the ASTM E57 committee on 3D Imaging Systems established a working group in 2013 to develop a documentary standard for volumetric performance evaluation of TLS systems. The group focused on test methods for point-to-point distance performance evaluation in the measurement volume. Early progress by committee members in this group is described by Muralikrishnan et al [116], while challenges and key decisions are described in a NIST report [117].
5.2.1. Scope.
The committee realized early on that error sources relevant for one class of 3D Imaging Systems may not be applicable to another class of 3D Imaging Systems. For the test positions to be sensitive to instrument error sources, the committee decided to narrow the scope of the standard to spherical coordinate 3D Imaging Systems that covers most TLSs. Point-to-point distance errors arise from several sources—two significant sources are the intrinsic opto-mechanical misalignments in the instrument and the surface properties of the workpiece. In order to complete the standard in a reasonable period of time, the committee decided to limit the scope to developing test procedures to reveal opto-mechanical misalignments in TLSs.
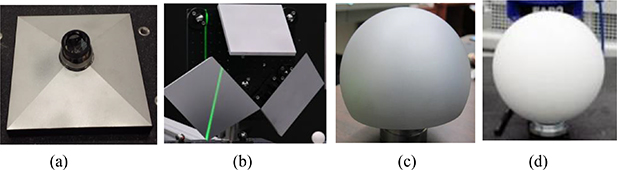
Figure 20. Different types of targets considered by the ASTM E57.02 committee, (a) tetrahedral target, (b) trihedral target, (c) dull grey aluminum sphere, (c) white plastic sphere. Reproduced with permission from [117].
Download figure:
Standard image High-resolution image5.2.2. Choice of targets.
The decision to limit the scope implied that the test must be performed with scanner friendly targets to minimize the effect of the laser-surface interaction on measurement results. The committee decided that allowing users to choose their own targets will result in manufacturers publishing specifications that cannot be compared. The committee considered different target designs and geometries (see figure 20) that could potentially be used such as spheres, contrast targets, trihedral, tetrahedral, and hybrid (for example, plate-sphere target described in section 5.1.2) targets. Contrast targets were not chosen because the derived point (i.e. target center) is determined using image intensity and therefore are not dimensional measurements. Further, such derived points are determined using proprietary algorithms that a user may not have access to. Trihedral targets (see Dorsey-Palmateer [118] for discussion on optimal slant angle) or tetrahedral targets were determined to be feasible but are not widely commercially available. Further, determining the reference distance using a trihedral or tetrahedral target can be challenging. A sphere, on the other hand, provides a unique derived point that can be determined easily using commercially available software tools. Further, there are commercial sphere targets that have a kinematic nest centrally located to mount a 38.1 mm (1.5 in) SMR. This special design allows a user to easily establish the reference distance using a laser tracker. The committee therefore decided that the standard will prescribe the use of sphere targets for all two-face tests and non-ranging direction point-to-point length tests. In order to determine suitable sphere targets for initial trials, committee members studied different sphere targets (see figure 21) to identify those that are friendly to TLSs. Repeatability measurements were performed on numerous sphere materials (aluminum, steel, titanium, plastic), color/texture (media-blasted, shiny, painted white), and sizes (diameters from 75 mm to 400 mm). It was determined that white spheres and dull gray, media-blasted metal spheres provide repeatable centers. The committee decided against specifying minimize size for the targets, instead decided to specify minimum number of points to be acquired from the surface of the spheres (at least 300 points) and plates (at least 100 points).

Figure 21. Different types of sphere targets considered by the ASTM E57.02 committee. Reprinted from [116], Copyright (2015), with permission from Elsevier.
Download figure:
Standard image High-resolution image5.2.3. Test procedures.
TLSs are similar to laser trackers in construction. The two key subsystems include a ranging unit and a two-axis gimbal to steer the laser to the target. The committee decided to adopt the ASME B89.4.19 [119] philosophy of testing the overall system performance and also to test the ranging unit separately. While the ranging direction point-to-point distance tests were based on the ASTM E2938-15, the non-ranging direction point-to-point distance tests in the measurement volume were based on systematic sensitivity analysis using the NIST [43] error model. Test positions, i.e. position and orientation of the reference lengths, were determined so that they clearly reveal the systematic errors in the instrument. For this purpose, a sensitivity matrix was developed, an example of which is shown in table 1 (only four rows are shown here for illustration). The rows in the table represent test positions and the columns represent model parameters. The entries in the matrix represent the sensitivity, i.e., the error in the length for one unit of a misalignment parameter. Thus, the entry corresponding to row 1 and column 3 is the error in a symmetric horizontally oriented reference length for one unit of transit offset x2. It is important to ensure that no column be entirely filled with zeros, because that would imply that there is no test that captures the effect of that parameter. Also, test positions are chosen so as to maximize the sensitivity to the different errors. Such a sensitivity matrix was also developed for two-face tests.
Table 1. Sensitivity coefficients for the different model parameters to length test positions. Reprinted from [116], Copyright (2015), with permission from Elsevier.
| Test # | x1n | x1z | x2 | x3 | x4 | x5n | x5z | x6 | x7 | x8x | x8y | x9n | x9z | x10 | x11a | x11b | x12a | x12b |
|---|---|---|---|---|---|---|---|---|---|---|---|---|---|---|---|---|---|---|
| 1 | 0 | 0 | −1 | 0 | 0 | 0 | 0 | 0 | 0 | 3 | 0 | 0 | 0 | −1 | 0 | −4 | 0 | 0 |
| 2 | 1 | 0 | 0 | 0 | 0 | 3 | 0 | 0 | 0 | 0 | 0 | 3 | 0 | −1 | 0 | 0 | 0 | 4 |
| 3 | 0 | 1 | −1 | 0 | 0 | 1 | 2 | 0 | −2 | 2 | 0 | 1 | 0 | −2 | 0 | −3 | 0 | 2 |
| 4 | 0 | −1 | −1 | 0 | 0 | 1 | −2 | 0 | 2 | 2 | 0 | 1 | 0 | −2 | 0 | −3 | 0 | 2 |
Note: Rows represent test positions and the columns represent model parameters. Rows 1 through 4 represent symmetric horizontal, vertical, left-diagonal and right-diagonal lengths, respectively. Columns represent model parameters, see [116] for explanation.
There are two broad series of test procedures in the ASTM E3125-17 standard—two-face tests and point-to-point distance tests. Wang et al [120] reported the first realization of the ASTM E3125-17 test procedures and described different materials and methods for this purpose.
5.2.3.1. Two-face tests.
Two-face tests are quick and easy to execute, and they are sensitive to several opto-mechanical misalignments. The standard requires that two-face tests be performed at three different elevation angles as shown in figure 22(a), two azimuth orientations that are 90° apart, and two distances (one close position within 10 m and a far position that is greater than 20 m), for a total of 12 two-face tests. Since the elevation angle φ is required to be larger than 40°, it may be difficult to realize the test at the far position for targets A and C. A single target in conjunction with fold mirrors may be used as shown in figure 22(b) to realize the tests.
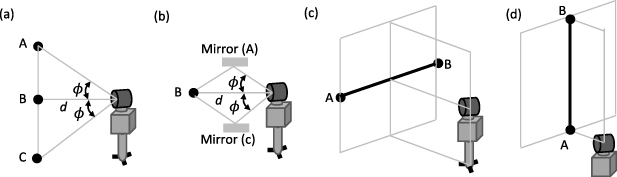
Figure 22. ASTM E3125-17 tests (a) two-face test realized using three targets, (b) two-face tests using one target and two fold mirrors, (c) symmetric horizontal length test, and (d) asymmetric vertical length test. Reprinted, with permission, from [41], copyright ASTM International, 100 Barr Harbor Drive, West Conshohocken, PA 19428. A copy of the complete standard may be obtained from ASTM International, www.astm.org.
Download figure:
Standard image High-resolution image5.2.3.2. Point-to-point distance tests.
The standard requires 20 point-to-point distance tests be performed. These tests are classified as symmetric tests, asymmetric tests, inside test, ranging test, and user-specified tests. Eight out of the 20 distance tests are symmetric tests, in which the TLS is placed symmetrically with respect to the reference length. An example is shown in figure 22(c) for a horizontal reference length. Other symmetrical positions include vertical and diagonally oriented reference lengths. Six out of the 20 distance tests are asymmetric tests, in which the TLS is placed closer to one end of the reference length. An example is shown in figure 22(d) where the TLS is placed closer to the bottom end of a vertical reference length. Other asymmetric positions include horizontal and diagonally oriented reference lengths. One out of the 20 distance tests is the inside test as shown in figure 5(a). All symmetric, asymmetric, and inside tests are performed with sphere targets. Three out of the 20 tests are relative-range tests as shown in figure 5(b); these are performed using plate targets, these conform to the ASTM E2938-15 standard. The remaining two tests are specified by the user. If the user-specified tests are along the ranging direction, the test shall be performed using plate targets, otherwise sphere targets shall be used.
5.3. ISO 17123-9
5.3.1. Background.
ISO Technical Committee (TC) 172 sub-committee (SC) 6 deals with geodetic and surveying instruments. In the mid-1980s, TC 172 SC 6 began developing documentary standards for testing geodetic instruments. The result from these efforts is the ISO 17123 series of standards, which cover most geodetic instruments, see Gottwald [38] for summary. Tsakiri et al [72] implemented the tests prescribed in ISO 17123 to evaluate a TLS, despite these tests not being designed specifically for TLSs. There have been several proposals for a standardized field check procedure for TLSs, such as by Gottwald [38], Walser and Gordon [121], and Wehmann et al [37]. The basic idea of the tests involved the measurement of the distance between a given pair of targets from more than one position of the TLS. The consistency in the results is the measure of the TLS health. Neitzel et al [122] released a proposal that became a German Association for Geodesy, Geoinformation and Land Management (DVW) guideline in 2014. This test procedure was later adopted by ISO TC172 SC6 leading to the publication of ISO 17123-9 standard in 2018. ISO 17123-9 is not a comprehensive performance evaluation standard, rather it is a quick field check procedure.
5.3.2. Test procedure.
ISO 17123-9 prescribes two test procedures—a simplified test procedure and a full test procedure. Both tests involve the measurement of four targets from two TLS positions as shown in figure 23. In the case of the simplified test, the targets are measured just once, whereas the full test prescribes three measurements of each target. The difference in the distance between a given pair of targets measured from the two TLS positions (S1 and S2 in figure 23) is compared to an uncertainty value for that distance. This uncertainty value may be computed from manufacturer's specifications, experimentally, or other means. Since the inter-target distances are not calibrated using an instrument of higher accuracy, this test is only a measure of consistency from the two TLS measurement positions.
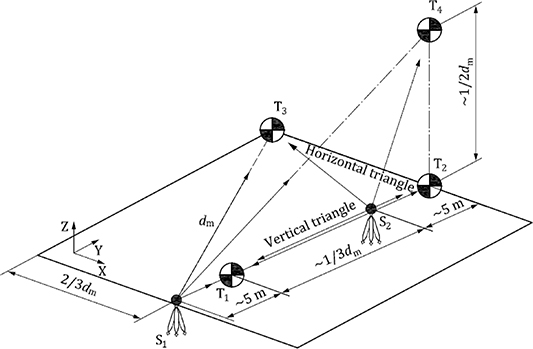
Figure 23. ISO 17123-9 test layout. Reproduced with permission from [39].
Download figure:
Standard image High-resolution image5.3.3. Adoption by ASTM E3125-17.
Although the ASTM E3125-17 was published prior to the ISO 17123-9 standard, the ASTM committee members were in contact with ISO TC 172 members and solicited their input for an interim test to be included within the ASTM E3125-17 standard. As a result, appendix X2 of ASTM E3125-17 standard includes this field check procedure as a recommended interim test for TLS systems.
6. Uncertainty and traceability
TLS users are typically interested in the accuracy of information derived from measured point clouds; for example, the accuracy of the dimensions of a room in a building model, accuracy of elevations in a terrain map, etc. These accuracies are in turn dependent on the accuracy of the individual point measured by a TLS, which is therefore, perhaps the topic of most interest and concern to users. Estimating this uncertainty requires an identification of all factors that influence the uncertainty, the magnitude of their individual contributions, and a measurement model that captures the effect of all those errors on the measured point coordinates. Figure 2 shows some of the primary influence factors that contribute to the uncertainty of a TLS point coordinate. Estimating the point coordinate uncertainty is a significant challenge and not within the scope of this paper.
We discuss another kind of uncertainty in this section. This uncertainty is associated with the test results (for example, the errors in the length tests) of the performance tests in published documentary standards, such as the ASTM E3125-17. This uncertainty is referred to as test value uncertainty or simply test uncertainty. Thus, this section primarily addresses the role of performance testing in estimating the overall point coordinate uncertainty, and therefore in establishing metrological traceability of TLS measurements.
During performance testing, the instrument performs measurements on (for example) lengths that have been independently calibrated (or in the case of two-face tests, it is known that the value of the 'length' is zero without separate calibration). A test value is calculated as the measured value minus the calibrated value, the difference is an estimate of the instrument error. The uncertainty of the test value arises from limitations in knowledge of the actual length as presented to the instrument for measurement. This could be the result of calibration uncertainty (documented on the certificate), changes in the length due to fixturing and vibration, and so on. Test value uncertainty is described in more comprehensive detail in the ASME B89.7.6 [123].
The test value uncertainty is taken into account when determining the test outcome by means of a decision rule (see ASME B89.7.3.1 [124] for more on this). One common decision rule is called the 4:1 Simple Acceptance. This rule states that as long as the k = 2 expanded test value uncertainty is at least four times smaller than the MPE, and the test value (i.e. the observed error in the length) is within the interval (−MPE, +MPE), the TLS has passed the test. The overall test described in the ASTM E3125-17 involves several such individual tests.
If the test value uncertainties are sufficiently smaller than the corresponding MPEs (i.e. meets the 4:1 criteria) and the errors are smaller than the MPEs, the user can be reasonably confident that the TLS will meet its specifications for subsequent measurements (i.e. measurements on real-world objects after performance testing) but two important caveats apply.
First, the standards discussed have focused on revealing the intrinsic errors of the instrument (i.e. those errors in the box titled 'Scanner' in figure 2). These errors are revealed by mitigating many effects of other categories that are shown in figure 2. For example, it is known that the surface of the object being measured can have an enormous and sometimes unpredictable effect on the accuracy of measurements (see section 7.1 of this paper). Surfaces that are, for example, shiny, translucent, of certain colors, or at an oblique angle to the instrument might significantly degrade the quality of the acquired point cloud. To separate out these effects, the standards employ targets that are particularly friendly to the TLS (in surface properties and orientation). This means that while the MPEs could be useful in comparing instruments, they do not generally encompass all the effects needed for evaluating measurement uncertainties in general usage.
Second, it is also important to recognize that the points used in testing are derived points as opposed to individual points that would be found in a point cloud produced by the instrument. For example, figures 6(a) and 23 show contrast targets used in testing. Many data points are taken on these targets, and software is used to determine the best estimate of the center point. This derived center point is more accurate than the individual points of data that went into its calculation. Thus, it would be incorrect to assume that the MPEs apply to each point arising in a point cloud scan.
In the (unlikely) event that the instrument is used for measurements that precisely match the kind of measurements made in testing, then ±MPE would represent bounds on the errors and these bounds could be directly converted into a quantification of the measurement uncertainty for individual points measured by the TLS. But for general measurements, this uncertainty contribution would represent one of many contributions in an uncertainty evaluation.
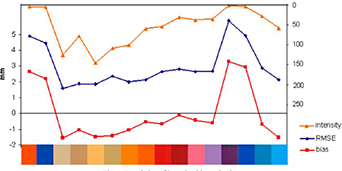
Download figure:
Standard image High-resolution imageThere are no standardized performance tests to quantify the effect of these additional influence factors (e.g. surface interaction effects) for TLS measurements, a topic that has yet to be addressed by documentary standards committees. Thus, demonstrating the overall metrological traceability of TLS measurements can still pose challenges, though these can be met without having standard performance tests in place. See ASME B89.7.5 [125] for a more general discussion on guidance to demonstrate metrological traceability for industrial dimensional measurements and Phillips et al [126] for more on 3D imaging systems. It should be noted that there are other ways to evaluate task specific uncertainty without using the MPE. One approach involves appropriate calibrated artifacts used according to the methods of ISO 15530-3 [127] (which was written for the context of CMMs).
7. Other performance tests
There are currently no standardized tests to quantify the effect of other TLS error sources. We briefly survey literature on these error sources here.
7.1. Color, materials, reflectivity, and angle of incidence
It is well known that range measurements from a TLS are influenced by target properties such as its color, material properties, reflectivity, and by angle of incidence and wavelength of the laser beam. We only cite some early and significant studies here. A detailed review of these error sources and their effects on TLS measurements is beyond the scope of this paper.
The effect of object color on TLS measurements has been discussed in [92, 93, 128]. The approach generally has been to measure color patches and study one or more of the following: the intensity of the return beam, the RMS noise from the best-fit least-squares plane, and the offset of the best-fit plane from its intended location. Figure 24 shows the results from one such study, Hanke et al [93], where they measured a reference color patch and plotted those three parameters. These parameters are clearly correlated, with highest RMS/intensity/bias for orange (Y30) and blue (B40) at the left end and purple-violet (RAL 4007) and ultra-marine-blue (RAL 5002) near the right end of this line.
A similar approach has also been adopted to study the effect of different materials. For example, Voegtle et al [129] scanned boards made of materials commonly used in construction such as wood, plaster, metal, and some translucent films, and recorded the mean squared error of the residuals from a best-fit plane as a metric to compare the different materials. Other such studies have also been reported [24, 80, 130, 131]. The challenge with such studies is that it is difficult to define a standardized target made of typical construction materials (such as wood, concrete, etc). Further, the behavior may be different when the material is wet and different types of the same material may exhibit different behaviors.
The effect of reflectivity has also been studied in a similar manner using boards with regions of different reflectivity. Hiremagalur [30] used the plate shown in figure 10(a) to study the effect of reflectivity in the three regions of the plate. See [22, 29, 132, 133] for similar studies.
The effect of angle of incidence has been reported in [23, 30, 31, 78, 128, 134–143]. In section 5.1.2, we mentioned the idea of using a plane as a reference to understand the effect of spheres appearing squished/flared. There, the distance between the center of the sphere and the plane at different distances provided an indication of the extent to which spheres appeared squished/flared. A similar idea, but with reversed roles for the spheres and the plane has been proposed by Mechelke et al [78] and Kersten et al [134] to study the effect of angle of incidence. Here, the distance between the centers of the sphere and the plane provide a measure of the errors due to different angles of incidence. Figure 25 shows the artifact proposed by them which consists of a plate with four spheres fixed as shown (ignore the spheres fixed to the black frame). As the plate is rotated to present different angles of incidence, the sphere centers are not impacted by this rotation. The centers of the spheres are therefore considered as the reference and the distance to the plate from a plane formed by the four sphere centers is used to determine the effect of angle of incidence. They observed that the distance between the centers of the spheres and the computed plane increases with the increasing angle of incidence. Time-of-flight scanners exhibited minor effects of up to 3 mm for an angle of incidence (measured with respect to the surface normal) of 80° to 85°, while phase-based scanners exhibited difference values of up to 12 mm for the same range of angles. They conclude that if the angle of incidence is larger than 45°, significant influence on the accuracy of the point cloud can be expected.
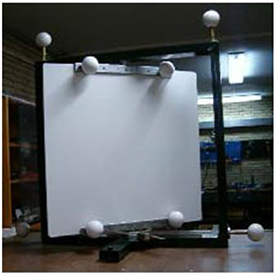
Download figure:
Standard image High-resolution image7.2. Resolution and edge-effect tests
The smallest feature that can be resolved by a TLS system is a parameter that may be of interest to many TLS users. Boehler [29] presented an artifact (see figure 26(a)) constructed out of a box 300 mm × 300 mm × 55 mm. This artifact has been used by others, for example by Hiremagalur [30] and Fuss et al [77]. Ingensand et al [21] have used an interferometric bench to test for range resolution. Angular resolution of TLSs is discussed by Lichti et al [144–146]. There are currently no standardized test procedures to evaluate the resolution of TLS systems.
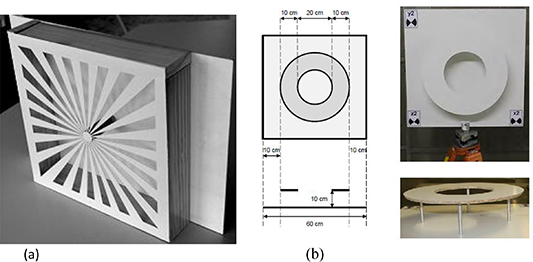
Figure 26. (a) Resolution artifact, reproduced from [29], CC BY 3.0, (b) edge-effect artifact by Wunderlich and Wasmeier [31], reproduced with permission from [31].
Download figure:
Standard image High-resolution imageResolution artifacts are not only useful to quantify smallest measurable feature size, they also can potentially serve another useful function. When processing the data to create measurement coordinates, the manufacturer may use filters. Increased filtering can potentially improve performance test results, but at the expense of the system resolution. If a standardized resolution artifact can be included in performance testing along with calibrated scale bars, this would discourage excessive filtering because it would result in a penalty in the form of decreased performance when measuring the resolution artifact. This trade-off would force manufacturers to minimize the amount of data filtering when realizing the length tests such as those described in ASTM E3125-17.
A key challenge with processing TLS data is the determination of edges in scanned point-clouds. Wunderlich and Wasmeier [31] propose the artifact shown in figure 26(b) to study this problem. The artifact consists of a plate on which a large ring is mounted. The edges of the ring are beveled inwards to present a sharp edge to the laser beam of the TLS. Wunderlich and Wasmeier define a metric based on the number of data points that lie within certain threshold of the true surface to quantify geometric truth concerning edge determination.
7.3. Inclination sensor test
Some TLS systems incorporate an inclination sensor so that the data can be transformed into a gravity aligned frame. This feature is important in surveying applications, and in engineering manufacture and assembly applications, such as when laying machine tools beds so that large machine tools rest stably with respect to gravity.
Mechelke et al [78] and Kersten et al [134] described a test for the inclination sensor in a TLS. Their procedure involved placing 12 spheres in steps of 30° on the circumference of a circle of radius 50 m. The spheres were adjusted to the same height using a high precision level. The spheres were then scanned and the derived Z coordinate of the center of the spheres were compared to the reference horizontal plane. Their studies showed that the level sensor appeared to function well for time-of-flight scanners, but some systematic error was observed for phase-shift scanners.
The ongoing draft revision of the ASME B89.4.19 [119] standard for laser trackers has a test procedure for evaluating the performance of the inclination sensor. In their approach, no reference instrument is needed. The test procedure involves measuring the Z coordinates of targets B and C which are distributed on the floor in a gravity-aligned coordinate system whose origin is moved to point A, from Position 1 in figure 27. The laser tracker is then either slightly tilted at the same position or moved to Position 2. A new gravity-aligned coordinate system is constructed with origin at point A, and the targets B and C are measured again. The Z coordinates of the targets should remain the same if there are no inclinometer errors. To determine the magnitude of inclinometer errors, the difference in Z coordinates before and after tilt are converted to units of angle and compared against manufacturer provided MPEs. The same procedure can conceivably be adopted for TLS systems.

Figure 27. Inclination sensor test per the draft ASME B89.4.19.
Download figure:
Standard image High-resolution imageWe briefly note here that some TLS systems also have a heading sensor. We do not discuss the performance evaluation of these sensors in this paper as we primarily focus on large-scale dimensional metrology applications where heading is not of much consequence.
8. Discussion
When laser trackers began to be more commonly used in the early 1990s, it was challenging to compare manufacturer specifications leading to idiosyncratic test procedures to assess performance. With the introduction of the ASME B89.4.19 [119], VDI/VDE 2617-10 and later ISO 10360-10, manufacturers began to specify accuracies against test procedures described in these standards allowing users to compare instruments and facilitate purchasing decisions. The TLS market today is like the state of the laser tracker market in the mid-1990s. Manufacturer specifications are challenging to compare, making it difficult for users to make informed purchasing decisions. This has resulted in numerous performance test procedures devised by users to evaluate the performance of TLS systems. In this paper, we have reviewed different error sources in TLS systems and performance test procedures reported in the literature to quantify the effect of those errors. We focused our discussions on instrument error sources as these are described extensively in the literature. Documentary standards to determine instrument error sources are relatively new; the ASTM E3125-17 has been available since the beginning of 2018 and we anticipate TLS manufacturers to specify against this standard in the coming years. Providing standardized specifications will be an enormous benefit to users. In section 8.1, we address how manufacturers or users can easily modify existing range and angle accuracy specifications to conform to ASTM E3125-17. In section 8.2, we discuss the current state of performance specifications, limitations of the existing documentary standards and the path forward.
8.1. Unifying TLS specifications
Several manufacturers currently provide information on range and angle accuracy for their TLSs. We show in this section how those accuracy statements can be used to estimate ASTM E3125-17 test specifications. Suppose a manufacturer's range and angular accuracy specifications are 0.2 mm and 50'' (242 µrad), respectively. The MPE for a two-face test can be estimated as twice the angular accuracy specification in units of range, thus

where R is the range to target in meters and Etwo–face,MPE is in units of micrometers. The ASTM E3125-17 requires that some two-face tests be performed at a distance R that is less than 10 m and some at a distance that is greater than 20 m. For the example specifications chosen here, the MPE for a target at a distance of 10 m is 4.84 mm while the MPE for a target at a distance of 20 m is 9.68 mm.
The calculation of the MPE for a point-to-point distance in the ASTM E3125-17 standard involves some trigonometry, see figure 28. Suppose the ends of the reference length are at distances r1 and r2 from the TLS, and the reference length subtends angles α1 and α2 as shown in figure 28. Then, the MPE for the length can be estimated by

Figure 28. Point-to-point distance MPE calculation [41]. Reprinted, with permission, from [41], copyright ASTM International, 100 Barr Harbor Drive, West Conshohocken, PA 19428. A copy of the complete standard may be obtained from ASTM International, www.astm.org.
Download figure:
Standard image High-resolution image
where er 1,MPE and er 2,MPE are the range accuracy specifications to the ends of the reference length, and et 1,MPE and et 2,MPE are the angular accuracy specifications (in units of length) to the ends of the reference length. Suppose we are interested in estimating the MPE specification for a horizontally oriented reference length (Test #PP1 in the ASTM E3125-17 standard), 2.3 m long. Per the standard, the angular sweep angles α1 and α2 must each be at least 40°. With these angles set at 40°, we determine the range to the ends of the length to be r1 = r2 = 1.79 m. The angular accuracy specification in units of length are et 1,MPE = et 2,MPE = 1.79 m × 242 µrad = 0.433 mm. The range accuracy specifications are er 1,MPE = er 2,MPE = 0.2 mm, as mentioned earlier. Then, the estimated MPE for the length is 0.504 mm. Such calculations can be performed for all the test positions described in ASTM E3125-17.
8.2. Current status and the path forward
Over the last 20 years, individual research groups have developed numerous test procedures to quantify the effect of different errors sources associated with TLS measurements. As mentioned in section 1.2, there are numerous error sources associated with TLS measurements—two significant sources of error are those related to instrument opto-mechanical misalignments and those related to surface characteristics such as colors, reflectivity, surface texture, angles of incidence, etc. In this review, we have focused primarily on instrument opto-mechanical misalignments and their effects on measured point coordinates.
In the previous section, we described how manufacturers might provide specifications conforming to ASTM E3125-17, which is the first comprehensive performance evaluation standard that addresses instrument opto-mechanical misalignments over the entire measurement volume. While specifications conforming to this standard are a significant step towards unifying specifications across manufacturers, there are some limitations. Specifications per ASTM E3125-17 are relevant to specific types of targets described in that standard—sphere targets for two-face and non-ranging direction length tests and plate target for ranging direction length tests. In a real measurement task, TLS systems measure surfaces of different colors, reflectivity, surface texture, angles of incidence, etc. There are currently no standardized tests to quantify the effect of errors due to these sources, leading to idiosyncratic tests as described in section 7. There is, therefore, a need to develop standardized performance tests that characterize the effect of laser-surface interactions. Such a standard, along with a standard method to determine TLS resolution (possibly for smallest feature discernable and for minimum discernible change in coordinate), in conjunction with the ASTM E3125-17, will provide users with comprehensive information on the performance of their system in realistic situations.
9. Conclusions
TLS systems were first commercially available in the late 1990s. In the past 20 years, their measurement capabilities have improved considerably to the point that they are increasingly competitive with laser trackers for high precision manufacturing and assembly operations. A significant impediment to their more general adoption in industry (especially in aerospace) is that metrological traceability has not yet been fully addressed. In this review, we discussed different error sources in TLS measurements with an emphasis on instrument opto-mechanical misalignments. We reviewed performance test procedures reported in the literature leading up to the development of performance evaluation standards such as ASTM E2938-15 and ASTM E3125-17, and the ISO 17123-9 field check standard. We discussed how these standards may help unify specifications thus allowing users to compare TLS systems. We also highlighted the limitations of these standards in that they do not yet test for several errors such as for example those arising from the interaction of the laser with the surface. Additional standardized test procedures are necessary to address these error sources before users can have confidence in the data and can claim metrological traceability of results.
Acknowledgments
The author thanks Geraldine Cheok, Massimiliano Ferrucci, Vincent Lee, Prem Rachakonda, Daniel Sawyer, Craig Shakarji, and Meghan Shilling at NIST for their careful review of this paper, Tomislav Medić at the University of Bonn for his assistance in obtaining several German publications, and Vincent Lee for reproducing figure 15.
Footnotes
- 1
Disclaimer: Commercial equipment and materials may be identified in order to adequately specify certain procedures. In no case does such identification imply recommendation or endorsement by the National Institute of Standards and Technology, nor does it imply that the materials or equipment identified are necessarily the best available for the purpose.