

Abstract
The coupled dark state magnetometer (CDSM) is an optically pumped scalar magnetometer, which is based on two-photon spectroscopy of free alkali atoms. This paper introduces the measurement principle, instrument design, required resources and key performance characteristics of the flight model for the China Seismo-Electromagnetic Satellite, which is the first demonstration of the CDSM measurement principle in space. The CDSM uses several coherent population trapping (CPT) resonances in parallel in order to reduce systematic errors, e.g. the sensor temperature dependence. Overall five control loops were identified to enable a reliable operation. As known so far CPT is the only effect in optical magnetometry which inherently enables omni-directional, dead-zone-free measurements. This leads to a simple all-optical sensor design without double cell units, excitation coils or electromechanical parts. The instrument is characterized by an accuracy of 0.19 nT (σ), a detection noise of 50 pTrms at 1 s integration time, a mass of 1672 g and an in-Earth orbit measured power consumption of 3394 mW.
Export citation and abstract BibTeX RIS

Original content from this work may be used under the terms of the Creative Commons Attribution 3.0 licence. Any further distribution of this work must maintain attribution to the author(s) and the title of the work, journal citation and DOI.
1. Introduction
The China Seismo-Electromagnetic Satellite (CSES), also known as Zhangheng-1, investigates natural electromagnetic phenomena and possible applications for earthquake monitoring from space in a polar, sun-synchronous, low Earth orbit [1]. CSES was successfully launched in February 2018 and has a nominal mission lifetime of 5 years. The high-precision magnetometer (HPM) instrument package consists of two fluxgate magnetometers in a gradiometer configuration and the coupled dark state magnetometer (CDSM) as reference [2].
Most magnetometers used for scientific space missions are based on the fluxgate principle [3–5]. The main reasons for this are heritage and reliability as well as low power and mass requirements. Fluxgate magnetometers produce a three-component vector output proportional to the magnitude and direction of the magnetic field with limited accuracy due to inherent uncertainties such as sensor gain, offset and orthogonality. For several scientific space missions, e.g. CSES with its high background field, full science return can only be achieved by an additional scalar magnetometer which measures the magnitude of the magnetic field with low absolute error (<1 nT) [3].
Scalar magnetometers recently used in scientific space applications [3–5] are either based on the Overhauser effect (e.g. onboard Ørsted [6] and CHAMP) or the optically pumped helium technique (e.g. onboard Cassini [7] and Swarm [8]).
Both types require a complex sensor design in order to guarantee isotropic, dead-zone-free measurements. This is achieved by, e.g. a double cell unit in which one cell compensates the dead zone of the other [3], or a piezo-electric motor to change the polarization direction of the excitation light field according to the magnetic field direction [8]. Moreover, artificial magnetic fields or radio frequencies are needed for the excitation of the medium used in the sensor cell [6–8].
The CDSM is an optically pumped scalar magnetometer, which is based on two-photon spectroscopy of free alkali atoms [9, 10]. Like for other types of optical magnetometers, the magnetic field measurement is based on the Zeeman effect. In the presence of an external magnetic field the degeneracy of hyperfine structure (HFS) energy levels is lifted and results in a splitting of the levels as a function of the magnetic field strength. Additionally, a quantum interference effect called coherent population trapping (CPT) [11–14] leads to narrow resonance features and thus enables a precise determination of the magnetic-field-dependent Zeeman energy level shifts [15–17].
As known so far, CPT is the only effect used in optical magnetometry which inherently enables omni-directional measurements [15, 18]. This leads to a simple all-optical sensor design without double cell units, excitation coils, mechanical or active electronics parts (see figure 1). Furthermore, the CDSM uses a combination of several CPT resonances, which ideally reduces the dependence on the sensor temperature to zero [9, 19].

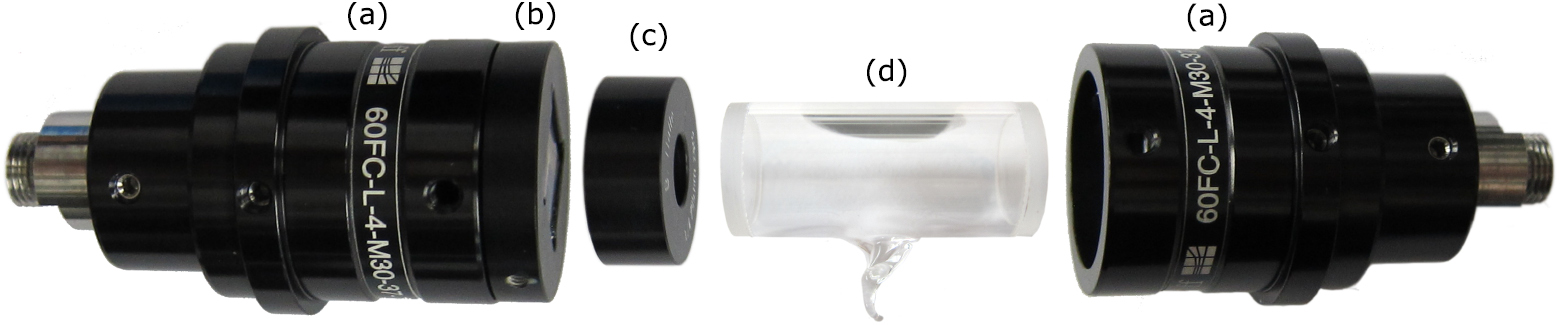
Figure 1. The CDSM sensor consists of two fibre couplers (a), a polarizer (b), a quarter-wave plate (c) and a rubidium-filled glass cell (d). For temperatures below 18 °C the cell is heated (not shown).
Download figure:
Standard image High-resolution imageThe CSES mission is the first demonstration of the CDSM measurement principle in space.
2. Measurement principle
In 1992, Scully and Fleischhauer showed theoretically that CPT resonances could be applied as a sensitive magnetometer device [20, 21]. The first experimental realization of a single CPT dark state magnetometer was reported in 1998 [15]. Even though a variety of potential applications on ground and in space are given for a magnetometer based on the CPT effect [22, 15, 14, 23–25], there are still non-trivial problems of systematic measurement errors which can significantly degrade the performance of a single dark state magnetometer (DSM).
In the presence of magnetic fields, several CPT resonances in the form of a spectrum arise. Ideally, the frequency difference of each component of this spectrum is determined by the Breit–Rabi formula [23, 26] here expressed as Taylor series expansion

where  refers to Bohr magneton, I to the nuclear spin, h to the Planck constant, n to the sum of the total magnetic quantum numbers
  and
and  , gJ and gI to the Landé g-factors,
  to the difference of
  and
and  and B to the magnitude of the magnetic flux density (see figure 2).

Figure 2. Laser excitation scheme within the D1-line hyperfine structure of 87Rb. The total angular momentum quantum numbers and the magnetic quantum numbers of the 52S1/2 ground state are denoted by F and, correspondingly, by mF while for the 52P1/2 excited states the labels are primed. The wavelength  corresponds to the fine structure transition 52S1/2
  P1/2. The hyperfine ground state splitting is denoted by
  . Each pair of arrows builds a Λ-system which causes a magnetic field-dependent CPT resonance. The energy shift introduced by the magnetic field is expressed by
  . According to the selection rules of two photon transitions [18], four CPT resonances with
  (dashed, blue Λ-systems, two of them are shown), two with
  (solid, red) and two with
  (dotted, green) are possible. The displayed Λ-systems are examples.
Download figure:
Standard image High-resolution imageHigh-sensitivity CPT magnetometry requires an additional buffer gas in the rubidium filled glass cell (see figure 1) which introduces temperature- and pressure-dependent frequency shifts [9, 19] of the hyperfine ground state splitting frequency  (see figure 2). In the case of single CPT resonance magnetometry this cannot be distinguished from magnetic field changes [9]. Therefore, the temperature of the sensor cell must be controlled precisely to enable useful absolute magnetic field measurements. For example, for caesium and 8 kPa of the buffer gas neon the temperature must be controlled with a stability of 10 mK in order to keep the long-term stability below the 10 pT range [23].
Additionally, the ac Stark effect causes shifts of the relative position of the HFS ground states F = 1 and F = 2 which are proportional to the applied light intensity and to the strength of the transitions [27]. Therefore, the total frequency of CPT resonance features in the presence of external magnetic fields is given by

where  depends on the magnetic field,
  on the buffer gas temperature,
  on the buffer gas pressure at a reference temperature of 293 K,
  on the light shift and
  is the frequency of the unperturbed electric dipole forbidden transition F = 1, mF = 0 and F = 2, mF = 0 [28, 29]. Systematic errors are also introduced by the limited frequency stability of the microwave oscillators which are used to generate the coherent frequency components of the laser excitation field.
The CDSM principle was discovered in 2007 [9]. It simultaneously probes two or more CPT resonances nearly symmetric with respect to the electric dipole forbidden transition F = 1,  , mF = 0 (see figure 2). The idea was to separate the microwave frequency
  used to bridge the ground state hyperfine splitting and the frequency
  (up to several MHz) needed to couple and detect the Zeeman-shifted CPT resonances. Consequently, the systematic frequency shift introduced by the microwave oscillator or the shifts due to buffer gas pressure and temperature have the same magnitude for detected single CPT spectral features with respect to the ground states F = 1, mF = 0 and F = 2, mF = 0 [9]. These systematic errors cancel due to the superposition of CPT resonances since in the CDSM approach only the frequency difference of the resonances is measured.
In this way, the measurement of the magnetic field is reduced to a frequency measurement which can be converted to the magnetic flux density B by applying the Breit–Rabi formula discussed in equation (1), where only fundamental natural constants are contained.
According to [18], derived under the assumption of negligible influence of optical pumping, the relative strength of the CPT resonances follows


where Srel is the relative strength of the CPT resonance, β is the angle between the propagation direction of the laser field and the magnetic field direction. Therefore, CPT resonances with even-numbered indices n reach their maxima at magnetic field directions longitudinal with respect to the light field propagation direction of the sensor and scale in their relative strength with cos , while resonances with odd-numbered indices have peaks at the transverse magnetic field direction and scale with sin
 . This was demonstrated for CPT resonance superpositions in [30] and is summarized in figure 3.

Figure 3. The Zeeman frequency sweeps extracted from [30] show the absorption (red, dashed) and dispersion (blue, solid) signals of three CPT resonance superpositions ( ,
,  ,
,  ) obtained by a frequency modulation spectroscopy method at two different angles of the magnetic field in relation to the light field propagation direction in the sensor. The applied field is 3954 nT while the Zeeman-shifting factors of the magnetic field-dependent resonances are approx. 7, 14 and 21 Hz nT−1, respectively. Optical pumping of the CPT resonances is not entirely negligible and causes a deviation from the predictions of the model developed in [18]. However, for every angle at least one of the three CPT resonance superpositions is detectable and, therefore, omni-directional magnetic field measurements are possible.
Download figure:
Standard image High-resolution imageBy a proper selection of the CPT resonance superpositions  ,
,  ,
,  (i.e. the CDSM resonances) within the spectrum, omni-directional measurements are possible without the need of a complex sensor design, e.g. additional moving parts or excitation coils at the sensor [30]. In practice, the resonance superposition
  is preferred over
  due to the higher and distinct Zeeman-shifting factor which leads to lower magnetic field strength detection noise and higher accuracy.
3. Instrument design
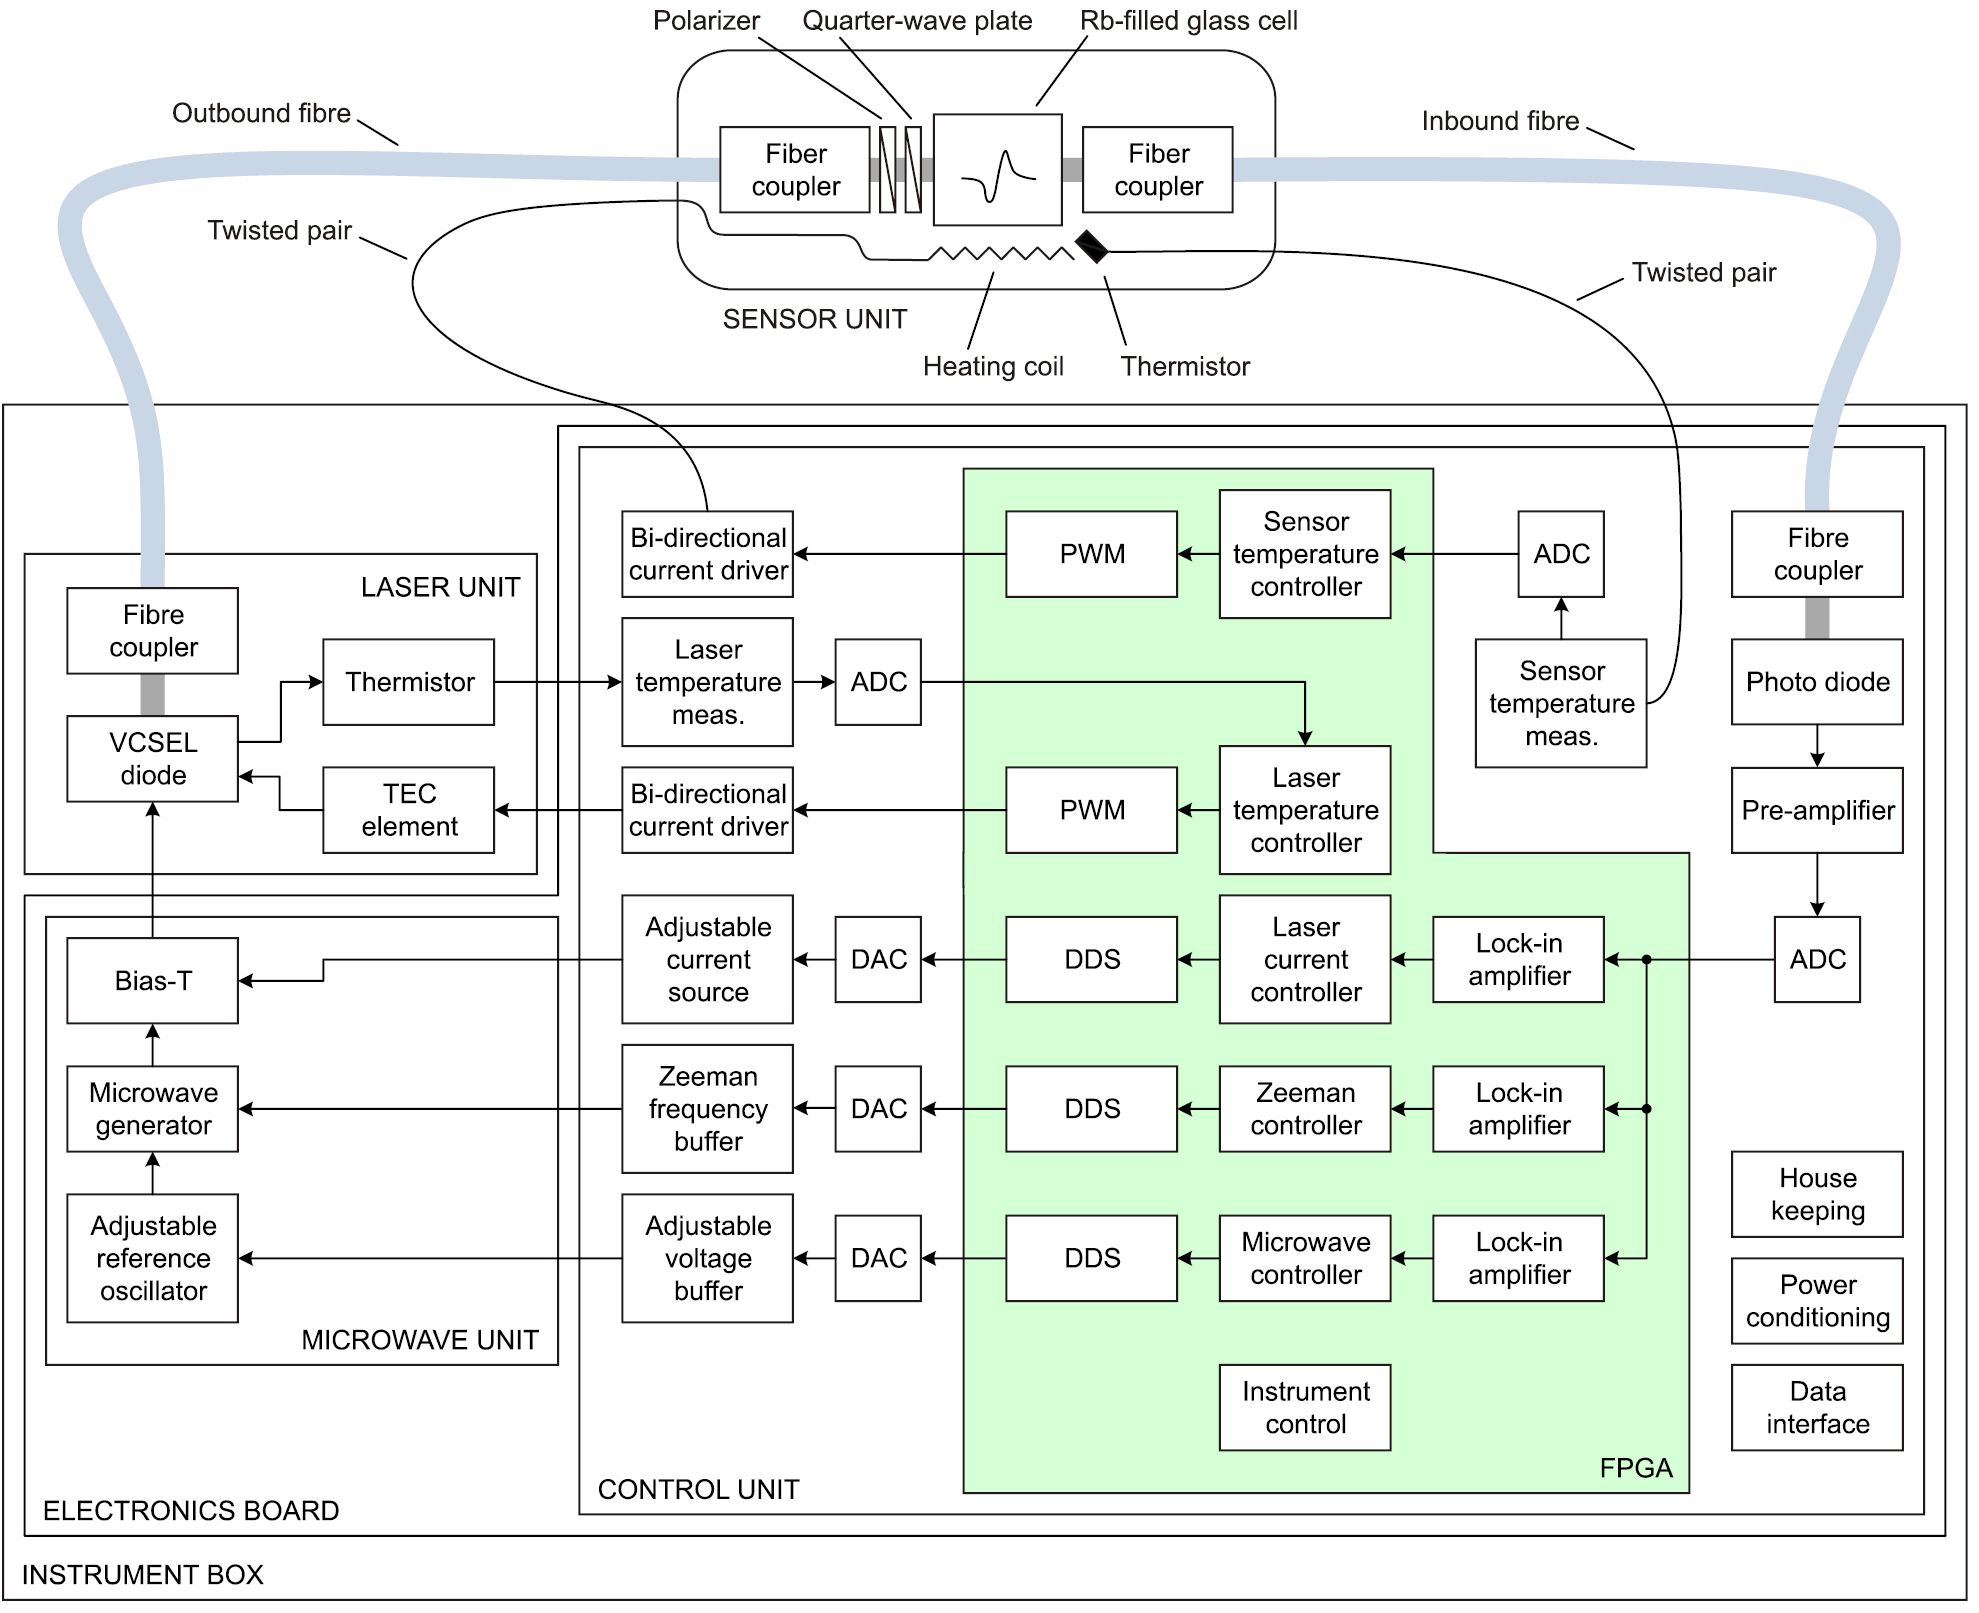
The CDSM flight model design in figures 4 and 5 consists of the mixed signal electronics board and the laser unit, both mounted in the instrument box and the sensor unit which is connected by two fibres and two twisted pair cables. The design includes several control loops which were developed [31] to track the magnetic field-dependent Zeeman resonances (section 3.1), to track the 87Rb fine structure transition 52S1/2  P1/2 with the current- and temperature-dependent laser carrier frequency (section 3.2), to track the HFS transition F = 1,
  , mF = 0 with the microwave generator (section 3.3) and to adjust the temperature of the rubidium vapor in the sensor cell for temperatures below 18 °C (section 3.4). Required resources for the flight model are outlined in section 3.5.

Figure 4. The CDSM consists of a mixed signal electronics board, a laser unit mounted on the side of an instrument box, a sensor unit, outbound and inbound fibres and two twisted pair cables for the sensor temperature measurement and an optional sensor heating in case of environmental temperatures below 18 °C.
Download figure:
Standard image High-resolution image
Figure 5. The CDSM flight model was developed for the low Earth orbit China Seismo-Electromagnetic Satellite (CSES) mission. The mixed signal electronics board and the laser unit are mounted in the instrument box (right). The sensor unit (left) is located at the tip of a boom outside of the satellite and is connected with two fibres (middle) and the thermal control cable.
Download figure:
Standard image High-resolution image3.1. Control loop for magnetic field detection
The coupled dark state magnetometer excites two magnetic field-dependent CPT resonances in parallel to determine the surrounding magnetic field. To fulfill the criteria of CPT resonance excitation [13] and for simplicity this is established by a double modulated light field [9, 17]. A third modulation is required to enable the detection with frequency modulation spectroscopy techniques [9, 17, 32].
The vertical-cavity surface-emitting laser (VCSEL) diode (vacuum wavelength  nm) is frequency modulated (FM) by a microwave signal (
 GHz). Both first-order sidebands of this FM spectrum fit the HFS energy levels F = 1, mF = 0 and F = 2, mF = 0 of the 52S1/2 ground state of the rubidium D1 line in figure 2. According to the Zeeman effect [33], the energy levels with the magnetic quantum numbers mF = −2, −1, 1, 2 are dependent on the magnetic field3. In figure 2 this is indicated by the shifted black lines while grey lines mean zero magnetic field. In order to establish permanent CPT resonances in presence of a magnetic field, the microwave frequency fMW is used as carrier for a phase modulation (PM) whose sidebands fit and excite the magnetic field-dependent energy levels.
The modulation frequency fB of this PM is limited to 2.1 MHz by the design which corresponds to a detectable magnetic field strength of approx. 150 μT for  and 100 μT for
  via the corresponding Zeeman-shifting factors of approx. 14 and 21 Hz nT−1. It is generated in the field programmable gate array (FPGA) using direct digital synthesis (DDS). In principle, a digital tuning word specifies the output frequency as a fraction of the clock frequency while the resolution is a function of the register width [34, 10]. The frequency component fB is carrier for an additional third modulation of the light field with the modulation frequency
  which enables FM spectroscopy and will be discussed below.
The digital FM sinusoidal output of the DDS is transformed to the analogue domain with a parallel digital-to-analogue converter (DAC) and fed as modulation signal to the microwave generator in order to establish the PM.
In the bias-T the modulated microwave signal is superposed with the signal of the current source which for now is assumed to be constant. The output is fed to the VCSEL diode as injection current in which the superposition is transformed to the first FM. The vertical cavity design of VCSELs has the characteristic of low parasitic capacity and therefore can be modulated by microwave signals with good efficiency [35]. Furthermore, certain VCSELs have inherent single mode capability [35] and durability [36].
The result is an overall triple-modulated light field spectrum whose spectral components fit to the appropriate transitions as indicated by either the red solid or green dotted arrows in figure 2. In this way a permanent excitation of one of the magnetic field-dependent CPT resonance superpositions  or
or  is achieved. The light is guided through a 50 μm graded index multimode fibre to the sensor unit where a polarizer and a quarter-wave plate establish a circular polarized excitation field.
In the rubidium-filled glass cell the CPT resonances are acting as frequency discriminator and convert the DDS generated FM ( ) of the multi-chromatic light field spectrum into an amplitude modulation of the transmitted laser intensity. Further discussion on the interaction process was carried out in [32, 10].
Afterwards, the transmitted light field is guided to the photodiode via a 400 μm step index multimode fibre. The photodiode converts the amplitude modulated intensity, which carries the rubidium-interfered information of the excited CPT resonances, to an equivalent photo current. A pre-amplifier converts the ac component of the current into a voltage signal, which is fed to the digital lock-in amplifier via an analogue-to-digital converter (ADC).
The third modulation in combination with the lock-in amplifier enables FM spectroscopy capable of sensitive and rapid measurement of the narrow and weak spectral features [32]. Since the modulation frequency  is large compared to the linewidth of CPT resonances (typically <2 kHz), the spectral feature is probed by a single sideband [32]. With a modulation index around one, the in-phase output of the lock-in amplier can be interpreted as absorption signal and the quadrature-phase output as dispersion signal of the CPT interaction with the rubidium atoms in the glass cell [32].
Due to the narrow spectral linewidth, which is a consequence of the strict constraints of the CPT mechanism, the slope at zero crossing of the quadrature-phase signal is steep (see figure 3). The point of zero crossing corresponds to the exact excitation of the magnetic field-dependent distinct hyperfine energy levels by the double modulated light field. The only variable parameter of the modulated light field is the frequency fB of the DDS signal while the laser carrier wavelength  and the microwave frequency fMW are for now assumed to be constant. The zero crossing in combination with the Zeeman controller in figure 4 is used to track changes of the magnetic field induced Zeeman energy levels by adapting the DDS frequency fB. The actuating variable of this controller corresponds to fB of the DDS signal and, therefore, it is a direct measurement for the magnetic field by applying an appropriate form of the Breit–Rabi formula (see equation (1)).
The controller operates permanently at frequency values which are related to the resonance superposition  via the Zeeman-shifting factor of approx. 14 Hz nT−1. In case of switching the magnetic field detection to the resonance superposition
  , the control loop does not need to be unlocked in order to find and follow the related zero crossing. The controller just scales the actuating variable fB by the factor 1.5 for
  which corresponds with sufficient accuracy to the Zeeman-shifting factor of approx. 21 Hz nT−1. A detailed discussion can be found in [30].
In scientific space missions a scalar reference magnetometer is always operated in combination with vector magnetometers. The measurements of the latter can be used for a rough calculation of the angle between the magnetic field and the optical axis of the sensor as well as the magnitude of the magnetic field by applying, e.g. coordinate rotation digital computer (CORDIC) algorithms [37]. The instrument controller can use this information to select the suitable resonance superposition  or
or  in order to ensure a CDSM operation in all directions of the sensor with respect to the magnetic field and to rapidly find the CPT resonances at start-up. In principle, both functions can also be achieved without an additional vector magnetometer but have not been implemented yet. The procedure for independent resonance switching is discussed in [30]. The resonances can be found in a scanning mode but this approach takes more time.
3.2. Control loops for fine structure transition tracking
Without control of the VCSEL temperature and current, the carrier frequency and, consequently, the entire triple-modulated light field spectrum would drift. This would cause a so-called two-photon detuning [38] of the CPT resonance excitation process and would lead to a malfunction of the magnetometer. For a reliable operation of the CDSM the carrier frequency must fit to the optical transition 52S1/2  P1/2 of the 87Rb D1 line (full width at half maximum (FWHM) typically 600 MHz) within a tolerance of <100 MHz. Therefore, additional control loops [10] are required to stabilize the VCSEL carrier frequency which is strongly related to the dc injection current and the laser diode temperature via the frequency shifting coefficients, e.g. −121 GHz mA−1 and −28 GHz K−1 (@
  nm), respectively.
The temperature of the VCSEL is set by a bi-directional pulse width modulated (PWM) current through a thermo-electric cooling (TEC) element and is monitored by a thermistor. The temperature signal is quantized by an ADC and fed to the laser temperature controller which calculates the duty cycle required to keep the actual temperature at the set temperature (see figure 4).
The laser current control loop sets the injection current of the VCSEL in order to fit the output frequency to the maximum of the spectral feature of the optical transition. The source supplies the VCSEL diode and, additionally, two adjustable voltage controlled current sinks in parallel. One of them sets the dc current through the laser diode. The control voltage of this sink corresponds to the actuating variable of the laser current controller in the FPGA. The other current sink is driven by a sinusoidal signal with the frequency  . It enables an FM spectroscopy technique which is used to stabilize the VCSEL carrier frequency onto the spectral feature. Consequently, the current at the output of the adjustable current source is a superposition of a dc and an ac component. The subsequent signal path is similar to that of the magnetic field control loop in section 3.1.
In contrast to the FM spectroscopy of the CPT resonances the modulation parameters (modulation index, frequency and phase) are chosen differently for the laser carrier frequency control loop. Here, the frequency  is lower than the linewidth of the spectral feature. In that case the in-phase signal is related to the first derivative of the absorption profile [39] and is preferably used as frequency discriminator in the control loop.
3.3. Control loop for hyperfine structure transition tracking
The HFS transition frequency  of the unperturbed 87Rb atom is influenced by the buffer gas pressure (2.94 Hz Pa−1 [28]), the buffer gas temperature (13 Hz K−1; see figure 8)4 and in second order perturbation by the magnetic field (57.515 kHz mT−2 [29]).
Under the assumption of negligible influence of the magnetic field, a mismatch  of the microwave generator induced sidebands and the HFS transition frequency causes a pair of CPT resonances (n = −2 and +2 or n = −3 and +3) which are split by the magnitude
  instead of being perfectly superimposed. In case of
  [9], where
  is the linewidth of the CPT resonance, this pair is not entirely resolved and thus observable as distorted, dispersive shaped signal. In case of equal CPT resonance line strengths (n = −2 and +2 or n = −3 and +3) the point of zero crossing is identical to the case
  . Therefore, a mismatch would not affect the magnetic field measurement of the CDSM [9]. In reality in most of the cases, the strengths of single positive and negative numbered CPT resonances are not symmetric. Hence, the systematic error induced by the mismatch is not entirely cancelled.
To avoid this error, the CPT resonance n = 0 related to the HFS splitting transition  can be used as reference to tune the microwave generator frequency in order to reach
  and thus achieve cancellation of the adverse systematic frequency shifts induced by the buffer gas. Additionally, the HFS transition control loop is capable of compensating drifts of the microwave generator.
The microwave generator is realized by a phase-locked loop which consists of a voltage-controlled microwave oscillator and a fractional n-counter frequency divider. The generator provides a constant radio frequency power level and a modulation bandwidth up to 1.5 MHz. The time base for the microwave generator is an adjustable reference oscillator which is tuned via a voltage input by the actuating variable of the microwave controller in figure 4. A sinusoidal signal with the frequency  is superposed to the actuating variable and enables an FM spectroscopy technique for stabilizing the microwave oscillator. The subsequent signal path and the interpretation of the demodulation outputs of the lock-in amplifier are similar to the magnetic field detection control loop. Consequently, the quadrature-phase of the
  signal component is fed to the control unit as feedback signal.
Ideally, the HFS transition is permanently tracked in order to compensate the adverse systematic shifts mentioned above. However, the transition corresponds to n = 0 in equation (3) and the amplitude of its spectral feature experiences the same dependence on the angle as the CPT resonances with  . As consequence, the control loop cannot work reliable at angles
  and
and  . For these alignment ranges, the controller state and the last actuating variable are preserved. Nevertheless, linear correction terms can be applied to adjust the reference oscillator as a function of sensor temperature and electronics board temperature.
As mentioned, the HFS splitting transition and, consequently, the related CPT resonance n = 0 depend on the magnetic field strength in second-order perturbation theory. In contrast, the lifted HFS sublevels involved in the CPT resonance superpositions  and
and  change with the magnetic field in first5 and second-order perturbation theory. All shifting coefficients are quantum number dependent and thus different for each CPT resonance component. The second-order frequency shifts of the CPT resonances are 57.515 kHz mT−2 for n = 0, 43.136 kHz mT−2 for
  and 21.568 kHz mT−2 for
  . If the microwave generator perfectly matches the HFS splitting transition, the microwave signal is not in the center of the single CPT resonances n = −2 and +2 or n = −3 and +3. Therefore, the second-order shift contribution of the CPT resonances causes a mismatch
  which has a similar impact as
  discussed above.
For an accurate magnetic field measurement the tracking of the HFS transition must be interrupted, the controller state preserved and the latest adjustment voltage corrected. With the correction the microwave signal is shifted into the center of the single CPT resonances n = −2 and +2 or n = −3 and +3 and the mismatch  . The correction term depends on the magnetic field strength and the selected CPT resonance superposition
  or
or  .
.
For sensor alignment ranges  and
and  the controller state and actuating variable are already preserved and the magnetic field-dependent correction term can be applied permanently. For angles outside these ranges, the controller operates in an alternating mode with an overall period of 1 s. First it tracks the HFS transition. Afterwards the state is preserved and the microwave signal is corrected for the rest of the second. This strategy allows one to cancel adverse systematic frequency shifts induced by the buffer gas or the ac Stark effect as well as drifts of the microwave generator and enables an accurate magnetic field measurement with an update rate of 1 Hz.
3.4. Control loop for optional sensor temperature stabilization
The strength of a CPT resonance depends, amongst other parameters, on the vapor pressure of the rubidium atoms in the glass cell and, consequently, on the temperature [29]. By increasing the temperature, more rubidium atoms are in the gaseous phase and available for interaction with the light field. The signal-to-noise ratio of a CPT resonance increases with the sensor temperature [17, 19, 23, 28] but starts to decrease again at a certain temperature when the optical thickness effect gets dominant.
With a neon vapor pressure of 5 kPa the sensor cell temperature must be between 18 °C and 55 °C for a reliable operation of the CDSM. Hence, no temperature control is required for the operation at room temperature (25 °C). For lower temperatures, which for instance occur during the CSES mission, a sensor temperature control loop is needed.
Similar to the laser temperature control loop, the temperature of the rubidium atoms is set by a bi-directional PWM ac current through a bifilar wound heating coil around the glass cell. The glass cell temperature is monitored by a non-magnetic thermistor (both not shown in figure 1). The thermistor signal is quantized by an ADC and fed to the controller which calculates the required PWM duty cycle.
3.5. Resource estimation
Table 1 shows the mass and power consumption required for the CDSM flight model. The magnetometer is part of the HPM instrument package and the design was driven by the available power interface of  V and 5V. The power consumption consists of a steady part of 2836 mW and a dynamic part, which depends on the laser and sensor units' thermal environment. The significant driver is the power required for laser heating or cooling with the power-to-temperature coefficients of 39.8 mW K−1 and 120.6 mW K−1, respectively. A careful selection of the laser diode regarding its operating temperature is crucial.
Table 1. Required resources of the CDSM flight model are measured and based on the interface defined for the CSES mission.
| Mass (g) | Steady power (mW) | Thermal coefficients | Power in orbit (mW) | ||
|---|---|---|---|---|---|
| Heating (mW K−1) | Cooling (mW K−1) | ||||
| Electronics box | 1033 | ||||
| Electronics board | 337 | 2836 | 2836 | ||
| Laser unit | 100 | 39.8 |
120.6 |
486 |
|
| Mounting frame | 596 | ||||
| Sensor unit | 340 | 5.7 |
72 |
||
| Harness |
299 | ||||
| Overall | 1672 | 3394 | |||
aPower-to-temperature coefficients derived from thermal-vacuum (TV) test with the CDSM electronics box referring to the TV chamber interface plate. bPower derived from in-orbit measurements. The laser diode is heated from a constant but not measurable interface temperature to 42.6 °C. cPower-to-temperature coefficient derived from in-orbit measurements. dPower derived from in-orbit measurements. The sensor cell is heated from nearly constant 12.4 °C to 25 °C. eThe sensor harness is in average 7 m and consists of the 50 μm outbound fibre (36 g), the 400 μm inbound fibre (76 g) and the thermal control cable (187 g).
For CSES in a temperature stable low Earth orbit, a nominal power consumption of 3394 mW was measured which includes 486 mW to set the laser temperature and 72 mW to heat the sensor unit to 25 °C.
Significant losses occur in the line regulators and operational amplifiers due to the limited available supply levels. For example, with a more efficient but still not optimal power interface of  V and 3.3 V, the steady power consumption would be reduced to 66%.
The instrument mass is 1672 g. This includes the mounting frame for the electronics with 596 g.
4. Results and discussion
Key parameters of the CDSM such as sensor-heading characteristic, accuracy, power spectral density of the detection noise and sensor temperature dependence are discussed below.
The sensor-heading characteristic of CDSM was experimentally determined at the Fragment Mountain Weak Magnetic Laboratory of the National Institute of Metrology in China when integrated in the HPM electronics box. The extended Helmholtz coil system can compensate Earth-field variations and set a constant artificial magnetic field with a control loop based on a Caesium magnetometer6. The homogeneity and accuracy were verified independently by two portable magnetometers based on the Overhauser effect7. The CDSM sensor was placed in the centre of the coil system and rotated in the artificial magnetic field.
In the upper plot of figure 6, the blue crosses show the difference between the CDSM and the Overhauser instruments' mean value for angles where the resonance superposition  was used while black circles show measurements with
  . At certain angles between the magnetic field and the optical axis of the sensor both resonance superpositions have been evaluated.

Figure 6. The sensor-heading characteristic of CDSM was experimentally determined at the Fragment Mountain Weak Magnetic Laboratory of the National Institute of Metrology in China. The CDSM was compared to two instruments based on the Overhauser effect for different angles between the magnetic field and the optical axis of the sensor (upper plot). A simple technical linear fitting approach leads to residuals with a standard deviation  (lower plot). This can be interpreted as accuracy of the CDSM.
Download figure:
Standard image High-resolution imageThe theoretical background of the heading characteristic of approx. −2 to 1 nT is topic for further investigation. For now, a simple technical linear fitting approach is used for the start of the commissioning phase. The lower plot in figure 6 shows the residual after the fit, which has a standard deviation σ of 0.19 nT. This can be interpreted as the accuracy of the CDSM.
The frequency characteristic of the detection noise and the sensor temperature dependence were investigated at the Conrad Observatory of the Central Institute for Meteorology and Geodynamics in Austria. The CDSM was compared to the closest sensor of a stationary potassium gradiometer8.
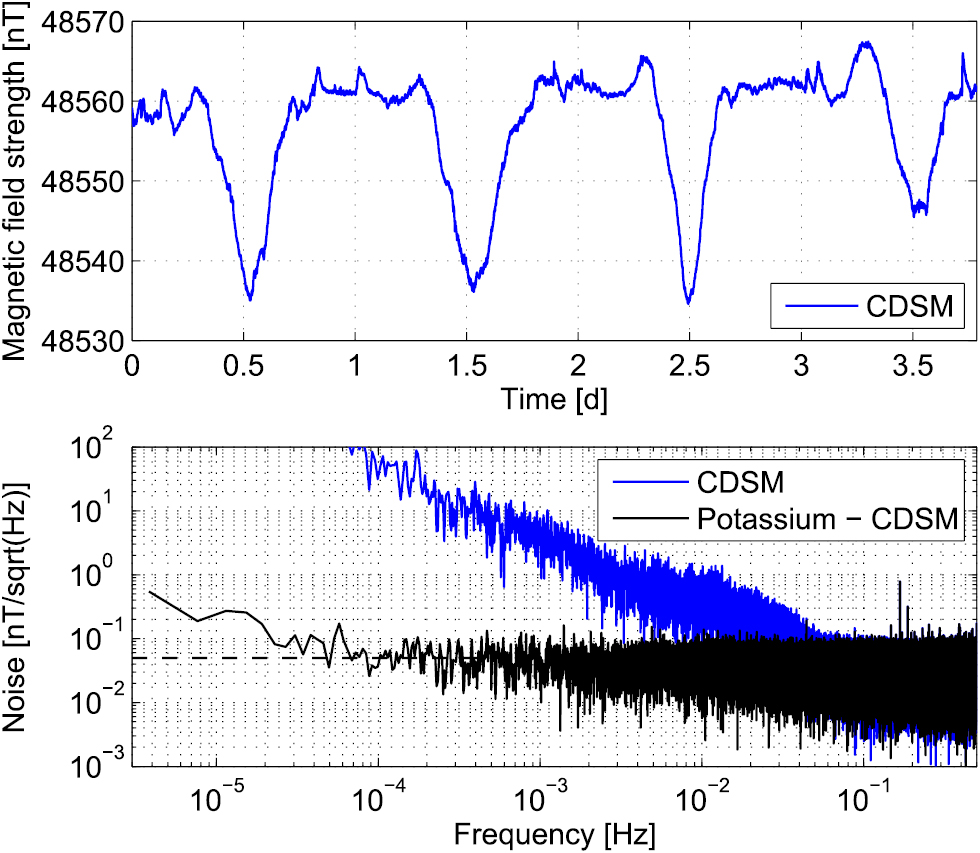
For the noise performance, both sensors measured Earth's field in parallel for more than 3.5 d. The time series of CDSM and the corresponding power spectral density (PSD) are shown as blue curves in figure 7. In order to derive the instrument's low-frequency performance the contribution of Earth's field variations has been eliminated by subtracting potassium magnetometer and CDSM data in the time domain. The PSD of the difference reflects the frequency characteristic of CDSM due to the superior detection noise of the potassium magnetometer. The detection noise of CDSM is below 50 pTrms  and no 1/f characteristic is observable down to at least 0.0001 Hz. The slight increase of noise at lower frequencies is likely caused by artefacts of the PSD calculation. For this measurement, the angle between the magnetic field direction and the optical axis of the sensor was 45°. The sensor cell temperature was set to 25 °C because most experience was gained at room temperature in the laboratories in Graz.

Figure 7. The frequency characteristic of the detection noise was investigated at the Conrad Observatory of the Central Institute for Meteorology and Geodynamics in Austria. CDSM and a potassium gradiometer observed Earth's field variations in parallel for more than 3.5 d. The blue curves show the time series of CDSM and the corresponding power spectral density (PSD). The black curve in the lower plot is the PSD of the difference of the two instruments which reflects the frequency characteristic of CDSM due to the superior detection noise of the potassium magnetometer. The detection noise of CDSM is below 50 pTrms  and no 1/f characteristic is observable down to at least 0.0001 Hz. The slight increase of noise at lower frequencies is likely caused by artefacts of the PSD calculation.
Download figure:
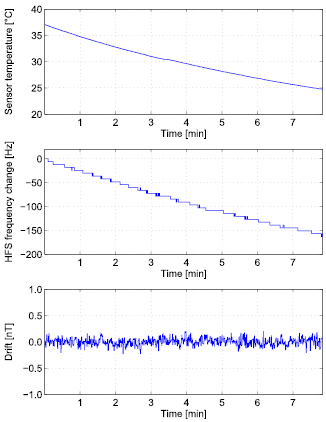
Standard image High-resolution imageA drift test was carried out in order to investigate the sensor temperature dependence within the operating temperature range of 18 °C and 55 °C (see section 3.4). The sensor temperature controller of the CDSM electronics board heated the sensor cell to approx. 38 °C and was then switched off (see upper plot in figure 8). The angle between the magnetic field direction and the optical axis of the sensor was 45°. The HFS control loop was active and adjusted the microwave generator output to the HFS transition frequency change, which was caused by the buffer gas temperature drift (see middle plot). In the lower plot no change in the magnetic field measurement was observed for a sensor cell temperature drift of approx. 13 °C. For sensor alignment ranges where the control loop cannot track the HFS transition frequency change, the instrument can use a linear correction term to tune the microwave generator as a function of the sensor temperature.
Figure 8. The sensor temperature dependence of the magnetic field measurement was investigated at the Conrad Observatory of the Central Institute for Meteorology and Geodynamics in Austria. The sensor temperature controller heated the sensor cell to approx. 38 °C and was then switched off (upper plot). The hyperfine structure (HFS) control loop tuned the microwave generator in order to track the HFS transition frequency change caused by the buffer gas temperature drift (middle plot). No change in the magnetic field measurement was observed for a sensor cell temperature drift of approx. 13 °C (lower plot).
Download figure:
Standard image High-resolution image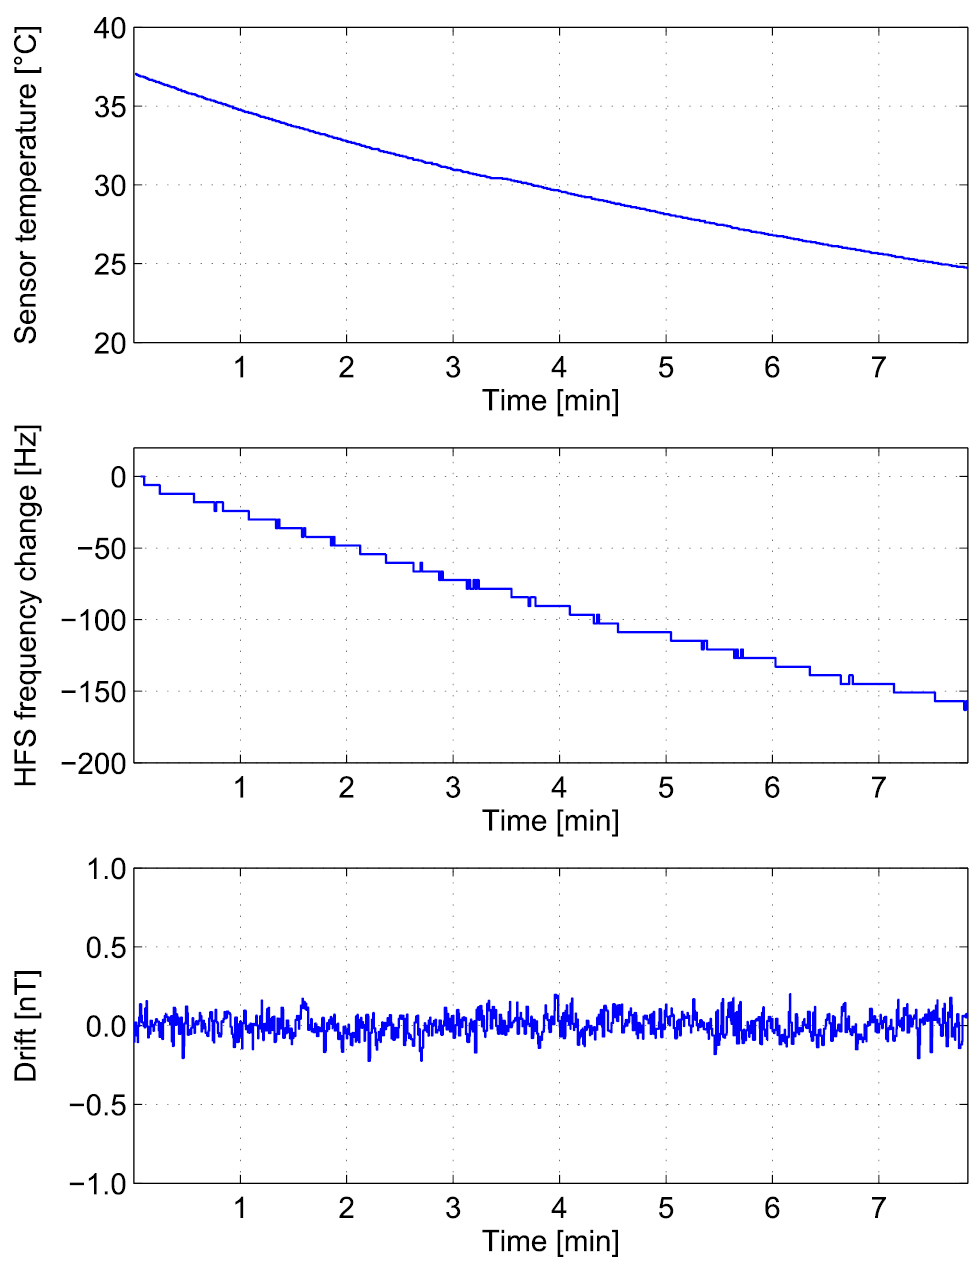
5. Conclusion
This paper discusses the measurement principle, the instrument design, required resources and key performance parameters of the CDSM flight model, which was developed for the low Earth orbit China Seismo-Electromagnetic Satellite (CSES) mission.
Several control loops have been implemented to enable a reliable operation. Systematic errors which usually degrade the accuracy of single CPT magnetometers are cancelled or at least minimized due to the use of several CPT resonances in parallel.
The sensor-heading characteristic of the CDSM was experimentally determined at the Fragment Mountain Weak Magnetic Laboratory of the National Institute of Metrology in China. The theoretical background of the heading characteristic of approx. −2 to 1 nT is topic for further investigation. For now, a simple technical linear fitting approach was used to correct the measurement. The residual has a standard deviation σ of 0.19 nT which can be interpreted as accuracy of the instrument.
The frequency characteristic of the detection noise was investigated at the Conrad Observatory of the Central Institute for Meteorology and Geodynamics in Austria. The detection noise is below 50 pTrms  . This is sufficient for CSES where the CDSM is the reference for the fluxgate magnetometers. A sensor cell temperature of 25 °C was selected for this measurement because most experience was gained at room temperature in the laboratories in Graz. There is no 1/f characteristic observable for low frequencies.
The operating temperature range for the CDSM sensor unit is between 18 °C and 55 °C. The sensor cell is heated for cell temperatures below 18 °C. A drift test carried out at the Conrad Observatory showed no influence on magnetic field measurement for a sensor cell temperature change of approx. 13 °C.
The instrument mass is 1672 g. This includes a mounting frame for the electronics with 596 g. The power consumption consists of a steady part of 2836 mW and a dynamic part, which depends on the laser and sensor units' thermal environment. In orbit, the measured power consumption is 3394 mW which includes 486 mW for the laser temperature control and 72 mW in order to heat the sensor unit to 25 °C.
CSES was successfully launched in February 2018 and is the first demonstration of the CDSM principle in space. The flight model design allows one to tune several parameters in orbit. The instrument will be fully characterized during the commissioning phase of the mission which is scheduled for the first six months after the launch.
Acknowledgments
The authors would like to thank Bingjun Cheng and Bin Zhou (National Space Science Center, Chinese Academy of Sciences), Roman Leonhardt (Conrad Observatory, Central Institute for Meteorology and Geodynamics) and Erich Leitgeb (Institute of Microwave and Photonic Engineering, Graz University of Technology) for their kind support. This work was partly financed by the Austrian Research Promotion Agency (project no. 819662, 828341, 859716) and a strategic initiative for Austria of the European Space Agency (contract no. 4000105726).
Footnotes
- 3
In first and second order perturbation theory. The energy levels with the magnetic quantum number mF = 0 have a second order dependence described in section 3.3.
- 4
For 5 kPa Neon. Derived from measurement shown in figure 8.
- 5
First-order coefficients also known as Zeeman shifting factors are linear and used for the actual magnetic field measurement described in section 3.1.
- 6
Geometrics G-822.
- 7
GEM Systems GSM-19.
- 8
GEM Systems GSMP-20.