


Abstract
Statistically significant increases in ischemic heart disease (IHD) mortality with cumulative occupational external radiation dose were observed in the National Registry for Radiation Workers (NRRW) cohort. There were 174 541 subjects in the NRRW cohort. The start of follow up was 1955, and the end of the follow-up for each worker was chosen as the earliest date of death or emigration, their 85th birthday or 31 December 2011. The dose-response relationship showed a downward curvature at a higher dose level >0.4 Sv with the overall shape of the dose-response relationship best described by a linear-quadratic model. The smaller risk at dose >0.4 Sv appears to be primarily associated with workers who started employment at a younger age (<30 years old) and those who were employed for more than 30 years. We modelled the dose response by age-at-first exposure. For the age-at-first exposure of 30+ years old, a linear dose-response was the best fit. For age-at-first exposure <30 years old, there was no evidence of excess risk of IHD mortality for radiation doses below 0.1 Sv or above 0.4 Sv, excess risk was only observed for doses between 0.1–0.4 Sv. For this age-at-first exposure group, it was also found that the doses they received when they were less than 35 years old or greater than 50 years old did not contribute to any increased IHD risk.
Export citation and abstract BibTeX RIS

Original content from this work may be used under the terms of the Creative Commons Attribution 4.0 license. Any further distribution of this work must maintain attribution to the author(s) and the title of the work, journal citation and DOI.
1. Introduction
Heart disease is a leading cause of mortality in humans. In recent years, radiation-induced heart disease mortality has become a topic of interest (AGIR 2010, Little 2016, Little et al 2010, 2012, 2023, Azizova et al 2018, Peters et al 2023). The Life Span Study of Japanese atomic bomb survivors has shown evidence of radiation associated excess risk of heart disease mortality (Shimizu et al 2010, 2016, Ozasa et al 2017, Takahashi et al 2017). A recent systematic review and meta-analysis has shown evidence that exposure to high doses of ionising radiation increases the risk of heart disease (Little et al 2023). At high doses it has been observed that the exposure can cause damage to the structures of the heart and to the coronary artery.
To assess the risk of heart disease associated with low-dose and low-dose rate radiation exposure, nuclear worker studies in different countries have been conducted (Azizova et al 2015, Gillies et al 2017, Zhang et al 2019). The International Nuclear Workers Study-INWORKS (Gillies et al 2017) provided a comprehensive assessment of mortality from circulatory diseases and other non-cancer outcomes among nuclear workers in France, the United Kingdom and the United States. A statistically significant association between radiation dose and circulatory diseases was observed in this study; within the sub-types of circulatory disease, the study found that increased ischemic heart disease (IHD) and stroke mortality were associated with external radiation exposure. In particular, the radiation dose-response relationship for cerebrovascular disease mortality can be described using a linear-quadratic model.
An updated analysis of heart disease mortality in the UK National Registry for Radiation Workers (NRRW) with an additional 10 years of follow-up was published (Zhang et al 2019). In the NRRW-3 cohort, a statistically significant increase in heart disease mortality was observed with cumulative external radiation dose. For ischaemic heart disease, which accounts for 89% of the heart disease mortality in the NRRW-3 cohort, the radiation dose-response relationship was best described by a linear-quadratic model.
Using the same dataset as that in Zhang et al (2019), our aim for this analysis was to provide an explanation for the downward curvature of the linear-quadratic dose response for ischaemic heart disease mortality at higher cumulative doses >0.4 Sv and to evaluate and consider the differences in the dose-response relationship with age-at-first exposure.
2. Methods
For the NRRW cohort dataset considered here, 174 541 radiation workers were individually monitored for exposure to external ionising radiation (Muirhead et al 2009a, 2009b). The study has individual-level information about sex, date of birth, date of first employment, attained age, employer/facility of employment, and industrial status (industrial or non-industrial; that is, weekly or monthly paid). There is also information about monitoring for internal exposure (radioactive materials were monitored for intake, primarily plutonium, uranium, and tritium, but not actual dose measurements). The calendar periods of employment and external radiation dose history were also recorded. Previous studies have reported the characteristics of the cohort members who contributed to the analysis (Muirhead et al 2009a, 2009b, Haylock et al 2018). Approximately 1% of the radiation workers have opted out of the NRRW cohort.
Personal dosimeters were used to measure the external radiation at the surface of the body for radiation workers (Muirhead et al 2009b). The external exposures were mainly from gamma rays and x-rays but with smaller contributions from neutrons and beta particles. The doses were adjusted for the threshold of detection of the dosimeters (Muirhead et al 1999), and dose corrections were applied to the historical doses of AWE, UKAEA, and BNFL Sellafield workers (Carpenter et al 1994). The mean ten-year lagged lifetime external dose was 23.2 mSv. The males had a higher mean lifetime external dose (25.2 mSv) than the females (5.1 mSv), which only accounted for 10% of the cohort.
Compared with the previous analysis of NRRW-3 (Muirhead et al 2009a, 2009b), ten more years of mortality follow-up until December 31, 2011, was added to the cohort. By this date, over 50% of the workers who started radiation work before 1960 had died.
The start of follow-up for each worker was taken to be ten years after the date of the first radiation work with a participating employer, or ten years after the date on which radiation monitoring data were available, or 1 January 1955, whichever was latest. A minimum latent period of 10 years was assumed for IHD. Follow-up prior to 1955 was excluded, because of a substantial deficit in deaths relative to national rates. The end of follow-up for each worker was chosen as the earliest date of death or emigration, their 85th birthday (as disease diagnosis at a very old age is less accurate), or 31 December 2011 (Haylock et al 2018). The basic characteristics of the NRRW-3 cohort are listed in table 1.
Table 1. Characteristics of the NRRW cohort.
| Total subjects | 174 541 |
| Alive | 133 952 |
| Dead | 34 974 |
| Emigrated | 4579 |
| Untraced | 1036 |
| Total person years in analysis | 3.688E6 |
| Calendar year of follow-up | 01/01/1955-01/01/2012 |
| Minimum dose (Sv) | 0 |
| Maximum dose (Sv) | 1.748 |
| Median dose (Sv) | 0.021 |
| Mean dose (Sv) | 0.023 |
Risk in relation to cumulative radiation dose was analysed using Poisson regression methods for grouped survival data (Breslow and Day 1987) with a stratified baseline hazard function. The risk of IHD from external radiation was estimated after incorporating non-radiative factors that modified the baseline risk. Person-years and deaths were stratified by non-radiation factors: sex, age (in five-year groups), calendar period (1955-,1960-,..., 2010–2011), industrial classification (industrial/non-industrial/unknown) and 15 first employer groups. The cumulative external doses were also classified into categories 0-, 10-, 20-,50-, 100-, 200-, and 400 + mSv (Muirhead et al 2009b). Ten years lagged dose was used to define the minimum latent period between exposure and the first possible detection of radiation-induced disease. We used the median dose in each dose category because the dose distribution was skewed towards lower doses. Risks were also calculated for different age and time-since-exposure (TSE) windows. All analyses were performed using EPICURE software AMFIT module (Preston et al 2015).
The underlying cause of death was coded using the 9th revision of the International Classification of Diseases (ICD9) (WHO 1977). The ICD10-based deaths (WHO 1990) were converted to ICD9 using equivalence mapping tables (CDC 2016). We analysed IHD mortality in a single group.
An excess relative risk (ERR) model was used in the analysis:

where λ is the background mortality rate in the absence of radiation. This depends on the attained age (a), calendar period of employment (c), sex (s), facility of first employment (f), and industrial category (i). The ERR depends on the dose-response ρ(d), and can vary with other parameters, such as age at first exposure (e), time since exposure (t), and sex (s). The dose-response was examined using a linear dose-response model  and a linear-quadratic model
  . In addition, point estimates of the ERR for the six dose groups (table 2) were estimated. The statistical significance of the risk estimates and 95% confidence intervals (CI) was derived using likelihood ratio statistics.
Table 2. Observed ERR/Sv for ischemic heart disease mortality for different age-at-first exposure groups, along with ERR by cumulative dose category (mSv), 10 years lag whole dose range.
| ERR (95%CI) for Ischaemic HD by dose category, 10 years lagged dose (mSv) | |||||||||
|---|---|---|---|---|---|---|---|---|---|
| Age-at-exposure | Total deaths | ERR/Sv(95%CI) for ischaemic HD | p-value | 10–20 | 20–50 | 50–100 | 100–200 | 200–400 | 400+ |
| All ages | 9814 | 0.32(0.04,0.61) | 0.02 | 0.03(−0.04, 0.10) | −0.04(−0.10, 0.02) | 0.04(−0.04, 0.12) | 0.09(−0.01, 0.19) | 0.18(0.06, 0.32) | 0.06(−0.09, 0.22) |
| <30 | 2399 | 0.11(−0.27, 0.54) | >0.5 | −0.015(−0.133, 0.115) | −0.120(−0.215, −0.016) | −0.043(−0.166, 0.092) | 0.121(−0.034, 0.293) | 0.128 (−0.069, 0.354) | −0.038(−0.251, 0.216) |
| 30+ | 7415 | 0.44(0.10, 0.81) | 0.01 | 0.045(−0.029, 0.124) | −0.008(−0.076, 0.063) | 0.074(−0.017, 0.171) | 0.074(−0.036, 0.195) | 0.208(0.060, 0.373) | 0.120(−0.072, 0.332) |
| Separation of 30+ group into: | |||||||||
| 30–45 | 4367 | 0.45 (0.09, 0.85) | 0.02 | 0.043(−0.049, 0.141) | −0.013(−0.092, 0.071) | 0.084(−0.021, 0.199) | 0.074(−0.051, 0.212) | 0.216(0.049, 0.404) | 0.129(−0.072, 0.363) |
| 45+ | 3048 | 0.40 (−0.27, 1.18) | 0.27 | 0.049(−0.063, 0.170) | 0.001 (−0.107, 0.119) | 0.050(−0.101, 0.219) | 0.075(−0.125, 0.307) | 0.183(−0.087, 0.507) | 0.032(−0.381, 0.608) |
3. Results
IHD deaths accounted for 89% of all the heart disease mortality in this cohort. Figure 1 shows the dose-response relationship for IHD along with the ERR for various dose-specific categories and their 95% confidence intervals. The dashed line represents the linear dose trend for the dose range up to 0.4 Sv (0.70, 95%CI: 0.27, 1.16). Over the entire dose range, a linear quadratic model with a downward curvature ( with β = 0.96, 95%CI:0.26, 1.70; γ = −1.52, 95%CI: −3.06, −0.01) showed a better fit than the linear model (0.32,95%CI: 0.04, 0.61). The difference between the two models was statistically significant (p-value = 0.048). It is apparent that the excess risk in the last dose category (>0.4 Sv) was responsible for the downward curvature of the dose response at higher dose levels. The estimates of ERR/Sv for IHD mortality are shown in table 2, along with the ERRs and their confidence intervals for various cumulative external dose categories. For age-at-first exposure <30 years old, the excess risk estimates were not statistically significantly raised in any of the dose categories, but the risk estimates in the dose categories 100–200 mSv and 200–400 mSv show an indication of a positive association between IHD and radiation dose. To increase the statistical power of the analysis, we have recalculated the excess risk estimate based on combining the data across the 100–400 mSv dose range. The combined risk of IHD was 0.123 (−0.007, 0.266) with a p-value of 0.07.
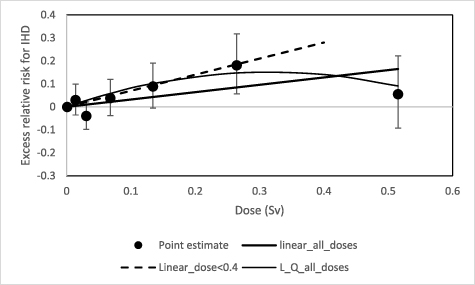
Figure 1. Dose response for ischemic heart disease mortality and cumulative external dose, with a dose lag of 10 years. The dashed line represents the dose response for the dose range up to 0.4 Sv (ERR/Sv = 0.70, 95%CI: 0.27, 1.16). The solid line represents the linear trend with ERR/Sv = 0.32 (95%CI: 0.04, 0.61) over the full dose range. For the linear-quadratic models, it can be described as  with β = 0.96(0.26, 1.70) and γ = −1.52 (−3.06, −0.01).
Download figure:
Standard image High-resolution imageTable 2 also shows the estimates of the linear trend and ERR/Sv for the dose categories obtained when the 30+ age-at-first exposure group was subdivided into two age groups 30–45 years and 45+ years. For the dose categories <0.4 Sv, the ERR estimates were similar for both age groups. Whereas, for the dose category >0.4 Sv, the ERR estimate for the 45+ age group was much lower (ERR/Sv = 0.03, 95%CI: −0.38, 0.61) than that for the 30–45 years group.; However, given the ERR estimate in the 45+ age group was based on only 18 deaths and 3.6% of the total person-years contribution in this dose category, this risk estimate might not be reliable due to insufficient data.
We investigated further about why the excess risk estimate in the highest dose category (>0.4 Sv) dropped significantly compared to the expected value derived from the linear dose-response trend.
Table 3 shows the number of deaths from IHD and the ERR/Sv for various potential risk modifying factors, such as age at first exposure, time since first exposure and employment length. For the age at first exposure groups <30, 30–45, and 45+ years, the ERR/Sv for the youngest group was only one quarter of the corresponding value of the older age groups, although the heterogeneity test showed that the difference between the risks for the different age-at-first exposure groups was not statistically significant.
Table 3. ERR/Sv from ischemic heart disease mortality, varies by different categorical variables as listed in the first column.
| Number of deaths for ischaemic HD | ERR/Sv (95%CI) for ischaemic HD | |
|---|---|---|
| Age-at-first exposure | ||
| <30 | 2399 | 0.11 (−0.27, 0.54) |
| 30–45 | 4367 | 0.45 (0.09, 0.85) |
| 45+ | 3048 | 0.40 (−0.27, 1.18) |
| p-value for heterogeneity test | 0.43 | |
| Time-since-first exposure | ||
| 10–20 | 2323 | 0.04 (−0.90, 1.20) |
| 20–30 | 3034 | 0.24 (−0.24, 0.78) |
| 30–40 | 2720 | 0.54 (0.11, 1.02) |
| 40-50 | 1406 | 0.33 (−0.13, 0.85) |
| 50+ | 331 | −0.17 (−0.78, 0.63) |
| p-value for heterogeneity test | >0.5 | |
| Employment length | ||
| <10 | 4844 | 0.73 (−0.28, 1.88) |
| 10–20 | 2540 | 0.70 (0.13, 1.35) |
| 20-30 | 1735 | 0.57 (0.16, 1.02) |
| >30 | 695 | −0.07 (−0.40, 0.32) |
| p-value for heterogeneity test | 0.04 |
For the time since first exposure factor, there was no increased risk during the first 20 years after the first radiation exposure; however, between 20–30 years following the first exposure, the ERR/Sv point estimate started to rise and peaked between 30–40 years after first exposure before decreasing again and it reached a minimum (−0.17, 95%CI: −0.78, 0.63) more than 50 years after the first exposure. We found that 92% of person-years and 85% of IHD deaths were contributed by the <30 years age-at-first exposure group in the 50+ year after the first exposure category (table S1 in the supplementary material).
Variations in the excess risk estimates by employment length are shown in table 3. The ERR/Sv estimates increased for employment of less than 10 years, 10–20 years and 20–30 years but the difference in risk between these three employment length categories was small. For categories 10–20, 20–30 years groups the risk estimates were statistically significantly raised. However, the ERR/Sv was greatly reduced to −0.07 (−0.40, 0.32) for employment length >30 years, and we observed that 88% of person-years and 73% of IHD deaths were contributed by the <30 years age-at-first exposure group in this category (table S2 in the supplementary material). A test of heterogeneity between all groups produced a p-value of 0.04, indicating that the variation in risk estimates across all employment length groups was statistically significant. However, when the >30 years employment length group was excluded, the heterogeneity test was not significant, indicating that the effect of employment length was not strong for workers employed for less than 30 years.
Thus far, the risk analysis has focused on the risk in relation to workers total cumulative radiation dose. The doses can be broken down into components corresponding to doses received in different age windows (<35, 35–50, >50 years), and the radiation risk can be derived for each of these age windows. Table 4 shows the ERR/Sv (95%CI) for ischaemic HD due to doses in three age-window categories, for the different age-at-first exposure groups. For subjects in the age-at-first exposure group <30 years, the ERR/Sv was only positive for doses received in the 35–50 years age-window [0.69 (0.01, 1.45)], whereas the risks were negative for doses in both <35 and >50 years age-windows. For the older age-at-first exposure groups, the ERRs/Sv were positive in the relevant age windows. When all ages at first exposure were grouped together, the ERR/Sv was also negative for the age-window of <35 years, as it was dominated by the risk in the age-at-first exposure <30 years group.
Table 4. ERR/Sv (95%CI) for ischaemic HD due to doses in the three age-windows category (age-at-exposure), corresponding to different age-at-first exposure groups. P = 0.36 for heterogeneity test of all ages group.
| ERR/Sv (95%CI) for Ischaemic HD due to doses in the following age-windows category (age-at-exposure in years) | |||
|---|---|---|---|
| Age-at-first exposure (years) | <35 | 35–50 | 50+ |
| <30 | −1.70 (−3.86, 0.78) | 0.69 (0.01, 1.45) | −0.48 (−1.18, 0.34) |
| 30–45 | NA | 0.24 (−0.78, 1.38) | 0.35 (−0.05, 0.80) |
| 45+ | NA | NA | 0.37 (−0.24, 1.10) |
| All ages | −1.5 (−3.65, 0.96) | 0.34 (−0.18, 0.93) | 0.23 (−0.09, 0.58) |
The doses can also be broken down into components corresponding to doses received in different TSE windows (doses received 10–25, 25–40 and 40+ years ago), and the radiation risk was derived for each TSE window. Table 5 shows the ERR/Sv (95%CI) for IHD due to doses in the three TSE-window categories, for the different age-at-first exposure groups. For subjects in all age-at-first exposure group, the ERRs/Sv were positive for doses received in the TSE-window of 10–25 and 25–40 years, but the risk became negative in the TSE-window 40+ years. A similar risk pattern was observed for the age-at-first exposure group 30–45 years old. For the age-at-first exposure group <30 years old, the risk was positive for TSE-window of 10–25 years, whereas the risks were negative for the 25–40 years and 40+ years TSE-windows. For the oldest age-at-first exposure group >45+ years, the risk was positive for the 25–40 years TSE-window, but negative for the other TSE-windows.
Table 5. ERR/Sv (95%CI) for Ischaemic HD due to doses in the three time-since exposure-windows category (years), corresponding to different age-at-first exposure groups. P = 0.038 for heterogeneity test of all ages group.
| ERR/Sv (95%CI) for Ischaemic HD due to doses in the following time-since-exposure window categories (years) | |||
|---|---|---|---|
| Age-at-first exposure (years) | 10–25 | 25–40 | 40+ |
| <30 | 0.22 (0.17, 0.33) | −0.08 (−0.46, 0.11) | −0.15 (−0.21, −0.08) |
| 30–45 | 0.04 (0.00, 0.08) | 0.40 (0.35, 0.46) | −1.09 (−1.10, NC) |
| 45+ | −0.09 (−0.29, 0.57) | 0.89 (0.73, 1.04) | −12.11 (−15.53, −8.79) |
| All ages | 0.19 (−0.25, 0.68) | 0.53 (0.00, 1.12) | −0.76 (−1.18, −0.03) |
Table 6 shows the distribution of person-years and IHD deaths across both the cumulative dose (Sv) and age at first exposure categories. For the highest dose category (>0.4 Sv),where the ERR/Sv estimate was lower than predicted by the linear model, 61% of the person-years and 34% of the IHD deaths were in the <30 years age-at-first exposure group, while 35% of the person-years and 57% of the IHD deaths were contributed by the 30–45 age-at-first exposure group. The person-years and IHD deaths in the 45+ age-at-first-exposure group were both very small, accounting for only 3.6% and 8.5% of the total, respectively; therefore, their contribution to the ERR in the highest dose category would be negligible.
Table 6. Cross tabulation of age-at-first exposure and external dose category for person-year and number of deaths. It is noticeable that large contribution of person-year and number of deaths for the dose category >0.4 Sv are from the age-at-first exposure group <30 years old.
| Age-at-first exposure | ||||||||
|---|---|---|---|---|---|---|---|---|
| <30 | 30–45 | 45+ | All ages | <30 | 30–45 | 45+ | All ages | |
| Person—year | Number of deaths | |||||||
| Dose categories (Sv) | ||||||||
| <0.01 | 1670 000(66.9%) | 637 820(25.6%) | 188 534(7.6%) | 2496 354(100%) | 1114(22.3%) | 1988(39.8%) | 1889(37.8%) | 4991(100%) |
| 0.01–0.02 | 241 762(64.5%) | 105 690(28.2%) | 27 214(7.3%) | 374 666(100%) | 277(22.8%) | 555(45.7%) | 382(31.5%) | 1214(100%) |
| 0.02–0.05 | 262 353(64.0%) | 121 781(29.7%) | 25 917(6.3%) | 410 051(100%) | 361(24.6%) | 719(49%) | 385(26.3%) | 1465(100%) |
| 0.05–0.1 | 131 173(64.3%) | 61 175(30.0%) | 11 627(5.7%) | 203 975(100%) | 244(27.4%) | 454(50.9%) | 194(21.7%) | 892(100%) |
| 0.1–0.2 | 77 381 (63.7%) | 37 780(31.1%) | 6300 (5.2%) | 121 461(100%) | 208(33.1%) | 310(49.4%) | 110(17.5%) | 628(100%) |
| 0.2–0.4 | 36 465 (60.8%) | 20 289(33.8%) | 3257 (5.4%) | 60 011 (100%) | 123(29.8%) | 220(53.3%) | 70 (16.9%) | 413(100%) |
| >0.4 | 15 143 (60.9%) | 8820 (35.5%) | 896 (3.6%) | 24 859 (100%) | 72 (34.1%) | 121(57.3%) | 18 (8.5%) | 211(100%) |
Considering the difference in ERR for IHD between different age-at-first exposure groups, particularly the small risk associated with the young age at first exposure group as described in the previous paragraphs, the dose-response relationships were analysed for the greater than 30 years age-at-first exposure group and the less than and equal to 30 years old group separately. Figure 2 shows the dose response for the 30+ years of age at first exposure group. The dose response can best be described using a linear trend, a linear-quadratic model was not a statistically significantly better fit. The overall ERR/Sv is 0.44 (95%CI: 0.09, 0.81) for the linear trend. The ERR estimates and their confidence intervals for the various cumulative external dose categories are presented in table 2.

Figure 2. Dose-response of ischemic heart disease mortality and cumulative external dose for age-at-first exposure >30 years old, with a dose lag of 10 years. The linear dose response can be expressed as ERR/Sv = 0.44 (95%CI: 0.10, 0.81)d. The linear-quadratic model can be represented as ERR/Sv = 1.12(95%CI:0.29, 2.00)d-1.63(95%CI:-3.52, 0.21)d2. The difference between the two models was not statistically significant.
Download figure:
Standard image High-resolution imageFigure 3 shows the ERR/Sv for IHD derived using the full dose range and the dose range excluding person-year experience greater than 0.4, 0.2, 0.1 and 0.05 Sv respectively, for the age at first exposure >30 years group. The ERR/Sv point estimate remained approximately the same when the dose range was restricted to doses less than 0.1 Sv. When the dose range was restricted to below 0.05 Sv, the ERR/Sv dropped below zero but it was not statistically significantly different from zero.
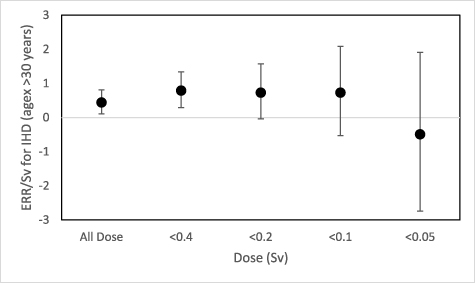
Figure 3. ERR/Sv of different dose range for ischemic heart disease mortality and a ten year dose lag for age-at-first exposure >30 years old.
Download figure:
Standard image High-resolution imageFigure 4 shows the ERR across the cumulative dose categories for the <30 years age-at-first exposure group. For the dose groups below 0.1 Sv, the ERR estimates were all negative, indicating that there was no evidence of radiation-associated excess IHD risk. The ERR increased above zero between the cumulative doses of 0.1 Sv and 0.4 Sv, but this increase was not statistically significant. Above 0.4 Sv, the ERR dropped below zero again. The overall ERR/Sv was only 0.11 (95%CI: −0.27, 0.54) which was one third of the ERR/Sv when all the age-at-first exposure groups were combined.

Figure 4. Dose-response of ischemic heart disease mortality and cumulative external dose for age-at-first exposure <30 years old, with a dose lag of 10 years. The linear dose response can be expressed as ERR/Sv = 0.11 (95%CI: −0.27, 0.54)d. The linear-quadratic model can be represented as ERR/Sv = 0.63(95%CI:-0.42, 1.77)d-1.18(95%CI:-3.63, 1.20)d2. The difference between the two models was not statistically significant.
Download figure:
Standard image High-resolution imageFigure 5 shows the ERR/Sv for IHD derived using the full dose range and the dose range excluding person-year experience exceeding 0.4, 0.2, 0.1 and 0.05 Sv respectively, for the <30 years age-at-first exposure group. The ERR/Sv point estimates were small and not statistically significantly different from zero when the dose range was restricted to <0.2 Sv. The ERR/Sv dropped below zero when dose range was restricted below 0.1 Sv. When the dose range was restricted below 0.05 Sv, the ERR/Sv became statistically significantly negative.

Figure 5. ERR/Sv of different dose range for ischemic heart disease mortality and a ten year dose lag for age-at-first exposure <30 years old.
Download figure:
Standard image High-resolution image
The main analysis of IHD risk was based on 10 years lagged doses. The results of other alternative lagging strategies for lagging periods of 0, 5, 15, and 20 years were also tested. The results are presented in table 7. The radiation risk peaked when using a 15–20 years lagging period and were slightly lower when using shorter lag periods. The observed ERR/Sv for IHD mortality for different age-at-first exposure groups, along with ERR by cumulative dose category (mSv), for both 5 years lag and 15 years lag are also presented in tables S3 and S4 in the supplementary material. The pattern of variation in risk was similar to that based on 10 years lagged doses.
Table 7. Alternative dose lagging strategies for the analysis of IHD risk.
| Dose lag time (years) | Means dose (mSv) | ERR/Sv (95%CI)for Ischemic HD |
|---|---|---|
| 0 | 29.7 | 0.23 (−0.01, 0.49) |
| 5 | 27.3 | 0.28 (0.03, 0.56) |
| 10 | 23.2 | 0.32 (0.04, 0.61) |
| 15 | 18.5 | 0.40 (0.10, 0.74) |
| 20 | 14.0 | 0.38 (0.04, 0.75) |
4. Discussion
The best-fitting dose-response relationship for IHD over the whole dose range is a linear quadratic model that fits significantly better than a linear model, as shown in figure 1. This result was caused by the reduction in risk at cumulative doses of over 0.4 Sv. The point estimate of risk for the category >0.4 Sv was much lower than expected based on the linear dose response trend derived using all data. A linear dose response model fitted well if deaths and person-years at doses over 0.4 Sv were excluded. Analysis was performed to try to understand why there was a significant drop in excess risk at the highest cumulative doses.
Radiation workers in this cohort generally received only a small dose of external radiation every year, therefore, it could take many years to accumulate dose to a level above 0.4 Sv. Therefore, workers with a cumulative dose of this magnitude are most likely to be employed at a young age (<30 years) and worked for several decades in the industry. Table 3 shows a smaller ERR/Sv (0.11, 95%CI: −0.27, 0.54) for workers whose age at first exposure was less than30 years in comparison with the other age-at-first exposure groups. Furthermore, the analysis of risk by time since first exposure showed no evidence of excess risk after 50 + years (−0.17, 95%CI: −0.78, 0.63), and the analysis of employment length also showed no evidence of excess risk after 30+ years (−0.07, 95%CI: −0.40, 0.32). These results support the observed lower risk among workers first employed <30 years of age as workers who survived for 50+ years since the first exposure, or worked in the nuclear industry for longer than 30 years must have joined the radiation workforce at younger ages. This is further supported by the fact that 92% of person-years and 85% of IHD deaths in the time since the first exposure group >50 years, and 88% of person-years and 73% of IHD deaths in the employment length >30 years were provided by the <30 years age-at-first exposure group (tables S1 and S2 in the supplementary material). Workers in older age at first exposure groups would be less likely to have an employment length of >30 years or survive for 50 years since the first exposure. Our analysis showed that the effects of age at first exposure, time since first exposure and employment length on IHD mortality all indicate a lower excess risk for workers who joined the radiation workforce at younger ages in comparison to the excess risk of older age-at-first groups.
A test of heterogeneity between the estimates of the linear trend across employment length groups was significant (p = 0.04), however, this could be influenced by the very small estimate of risk for employment length >30. When this group was excluded, the heterogeneity test was not significant, which indicates that there is no major effect of employment length for workers employed for less than 30 years.
Based on the analysis of risk against the doses in different age at exposure windows (table 4), there was no evidence of excess risk for doses received at ages <35 years. For workers who joined the radiation workforce at young age (age-at-first exposure <30 years), the doses they received when they were less than 35 years old or >50 years old did not contribute to any increased IHD risk. For this age group, the ERR/Sv was significantly positive only for doses received in the 35–50 years age-window [0.69 (0.01, 1.45)]. This result provided further evidence that the averaged risk based on cumulative dose was small for workers who joined the workforce at a young age, as part of the cumulative dose did not contribute to the IHD risk.
Based on the analysis of risk over the doses in different TSE-windows (table 5), there was no evidence of an excess risk for doses received in the TSE-window >40 years for all the age-at-first exposure groups. This implies that the doses received by workers 40+ years ago (when they were young) did not contribute to the increased radiation risk of IHD. For the age-at-first exposure <30 years old, no excess risk was observed even in the TSE window of 25–40 years. The raised risk was observed due to doses received more recently, such as 10–25 years ago. This was consistent with what we observed in the age-window analysis, which indicated that the risk was negligible for doses received at age-at exposure <35 years (table 4).
For workers who joined the radiation workforce at 45+ years, there was no evidence of excess risk for the TSE-window of 10–25 years ago, indicating that latency period of IHD risk could be more than 20 years for this age-at-first exposure group.
As young workers have the potential to work for many years and accumulate the dose to a relatively higher level, it is not surprising that a large proportion of workers in the highest dose category are those who started radiation work at a younger age and have stayed in the workforce for several decades. Our analysis further clarified that the person-year contribution in the dose category greater than 0.4 Sv was largely due to workers who joined the workforce at younger ages <30 years old (table 6). As the ERR was small for this group of workers, it is inevitable that overall ERR based on the total cumulative dose in the dose category >0.4 Sv was smaller than expected from the linear extrapolation using all data combined. It is evident that the downward curvature of the dose-response relationship observed in this cohort for IHD mortality was not caused by the high radiation dose; instead, it was due to the uneven distribution of the age-at-first exposure groups in the corresponding dose categories.
To correct for the effect caused by age at first exposure, we remodelled the dose-response relationship by age at first exposure. The data were divided into two groups: workers first exposed <30 years of age and those first exposed at older ages. Although a test for heterogeneity of the ERR/Sv between these groups did not reveal evidence of a difference (table 3), the dose-response relationships looked different for these two age groups. There was no clear evidence of a dose-response relationship for workers who were first exposed at <30 years (figure 4) characterised by the negative risk estimates at doses <0.1 Sv and >0.4 Sv. Only the two risk estimates in the dose categories 0.1–0.2 Sv and 0.2–0.4 Sv suggested a positive association of IHD with radiation doses, but the results were not statistically significant. In order to increase the power of the analysis, we recalculated a single risk estimate of 0.123 (−0.007,0.266) with p-value of 0.07, over the dose range of 0.1–0.4 Sv, which was still relatively small but close to borderline significance. Considering that it would take workers many years for their cumulative dose to reach 0.2–0.4 Sv, most workers at these dose levels probably have reached middle age or even older. It would not be surprising that the excess risk for this level of cumulative dose would be small because no risk was observed from part of the cumulative dose received before age-at-exposure <35 years, as we have observed in table 4. In the dose response for age-at-first exposure <30 years old, we also noted that the negative risk estimate at dose level <0.1 Sv reflected the fact that the low level of doses received in the young ages did not have much impact on IHD, and this is consistent with the observation in table 4 which showed the doses received before 35 years had no impact on the risk of IHD.
When the dose range used to generate the dose-response relationship was reduced (figure 5) to below 0.4 Sv, the excess risk estimate increased slightly but did not become significant. Below a maximum dose of 0.1 Sv the risk estimate was negative and it became statistically significantly so below a dose of 0.05 Sv.
For those first exposed to radiation at >30 years of age, there was good evidence of a linear trend (P = 0.01) over the entire dose range (figure 2). As the age-at-first exposure range was still quite broad for the age-at-exposure 30+ years old, the workers with age-at-first exposure just above 30 years old who have a smaller risk might have a better chance to reach dose level >0.4 Sv than their old colleagues. This could be the cause of the reduced risk at doses >0.4 Sv observed in figure 2. However, the difference between the linear model and linear-quadratic model was not statistically significant. When the ERR/Sv was calculated to a progressively reduced dose range (figure 3) there was no remarkable change in risk estimates as the upper dose limit was reduced until the limit was <0.05 Sv at which point the estimate was negative but the confidence interval on the risk estimate was very large.
The age-at-first exposure >30 years age group was further subdivided into 30–45 years and 45+ years (table 2). For the 30–45 years age group, the slope was statistically significantly raised (p = 0.02). For the 45+ group, although the linear slope estimate was similar in comparison with the 30–45 years group up to 0.4 Sv, the overall risk estimate was not statistically significant (p = 0.27), most likely due to the low ERR at high doses >0.4 Sv (0.032, 95%CI: −0.38, 0.61). The contribution of both person-year and number of IHD death from the age-at-first exposure group 45+ at dose level > 0.4 Sv was very small. This is likely because these workers had relatively short employment durations and could not accumulate sufficient doses. The small risk derived at the high dose level for workers aged 45+ years might be due to insufficient data for the analysis, and it might not be reliable.
The overall linear-quadratic dose response relationship should be interpreted with caution. We have observed a linear dose response relationship for those workers first exposed at ages >30 years, but the dose response relationship for age-at-first exposure <30 years old was less clear, marked with negative risk estimates at both cumulative doses <0.1 Sv and >0.4 Sv.
There have been other studies concerning circulatory disease risk following occupational low-dose and low-dose-rate radiation exposures; for example, an association between circulatory disease mortality and dose was found in the INWORKS study (Gillies et al 2017), and a linear quadratic dose response was observed for cerebrovascular disease-related mortality. Similarly, increased risk estimates were also found among Russian Federation Mayak nuclear workers (Azizova et al 2015). A significant increasing trend in circulatory disease mortality with increasing external dose (ERR/Gy = 0.10, 95%CI: 0.02, 0.21) was found after adjusting for non-radiation factors and internal dose. Although the dose response was described by a linear model, the risk estimate at dose levels greater than 4 Gy appeared to be smaller than expected based on the linear trend. These observations suggest that reduced risk at high dose levels could be a common phenomenon among radiation worker studies. Our analysis may provide insights into this phenomenon.
Cardiovascular diseases can arise within 5 years of radiotherapy treatment, as the radiation doses received by patients could be quite high during each course of the treatment (Gyenes et al 1998, Darby et al 2005, Henson et al 2020). In the NRRW study, we found that the increase in cardiovascular mortality associated with radiation exposure started approximately 15–20 years after the first exposure. This was probably because the radiation dose received each year by the workers was rather small, and the cumulative effect on the cardiovascular system might take much longer to reveal. We performed a sensitivity analysis using lags of 0, 5, 10, 15, and 20 years for ischaemic HD as presented in table 7. The risk reached its peak for a lag period of 15–20 years, and the risk decreased as the lag period decreased because of the increased dose for the shorter lag period. We present the observed ERR/Sv for IHD mortality for different age-at-first exposure groups, along with ERR by cumulative dose category (mSv) for both lag-period of 5 and 15 years in the supplementary materials so that readers can compare the risks derived using different lag period (tables S3 and S4 in supplementary material). The pattern of variation in risk was similar to that based on 10 years lagged doses. Therefore 10 years lag was appropriate for IHD analysis in NRRW study.
5. Effects from other parameters
Cigarette smoking is a major risk factor for many non-cancer diseases, especially heart disease. In the NRRW study, the possibility of confounding effects from smoking could not be directly investigated because no smoking data were available for workers. However, we found no increased risk of chronic obstructive pulmonary disease (COPD) (a disease strongly associated with smoking) in this cohort, which suggests the absence of strong smoking effects for overall risk estimates (Zhang et al 2023). This indirect evidence suggests that cigarette smoking is unlikely to be a major positive confounding factor in the analysis of the IHD risk.
6. Possible biological mechanism for IHD
IHD is an age-related disease, with a mortality rate that is much higher in older patients. A recent review (Tapio et al 2021) concluded that low-dose radiation exposure could result in a proatherogenic outcome in the form of increased adhesiveness, inflammation, and premature senescence, whereas low-dose radiation exposure might act in an anti-inflammatory manner if the cells or vasculature are in an inflammatory state. Many biological studies suggest that the underlying mechanism of atherosclerosis is associated with senescence of endothelial cells in the arteries of the heart (Minamino et al 2002, Brandes et al 2005, Erusalimsky and Kurz 2005, Erusalimsky 2009, Lowe and Raj 2014).
According to a biological study (Lowe and Raj 2014), ionising radiation can induce cellular aging through a mutation-independent mechanism. Radiation induces premature senescence in endothelial cells. In senescent endothelial cells, the promoter regions of CD44 become demethylated, and the resulting proteins are highly expressed on the cell surface, making them highly adhesive to monocytes. Furthermore, the junctions between endothelial cells can be significantly weakened by irradiation (Kabacik and Raj 2017). Monocytes and low-density lipoprotein (LDL) can infiltrate vessel walls and cause atherosclerosis.
The cellular response to radiation could also depend on the age of the person when the exposure occurs, which is supported by observations from an epidemiological study (Zhang et al 2005). According to biological observations (Repin et al 1984, Tokunaga et al 1989), endothelial cells from young or healthy coronary arteries are small and resemble cobble stones in appearance, but those from old or atherosclerotic arteries are several times larger in size, with 'fried egg' morphology. In older subjects, a high percentage of endothelial cells that coat their arteries are already giant senescent cells (Repin et al 1984, Tokunaga et al 1989) and irradiation may be unlikely to contribute significantly to increasing the risk of IHD. Radiation might have the greatest stimulatory effect on the development of IHD in middle-aged subjects whose telomeres are short but with arteries that are not yet predominantly populated by giant senescent cells (Repin et al 1984, Tokunaga et al 1989), whereas those exposed at younger ages might be less sensitive to radiation as far as IHD is concerned because of their greater ability to repair radiation damage at the chromosomal level. These biological studies support what we observed in this study, where doses received while young did not contribute to the increased risk, whereas those received in middle age did.
In our analysis of the NRRW cohort, the age at first exposure was 18–65 years old. Although the differences in risk among the age at first exposure groups were not statistically significant (table 3), the dose responses for different age-at-first exposures looked different.
The risk estimate at a dose greater than 0.4 Sv appeared to be smaller than expected. The high percentage of person-year contribution to this dose category came from workers younger than 30 years of age at first exposure, and those who worked over 30 years in the radiation industry. Since younger workers have lower radiation risk than older workers, the overall risk estimate for the dose category >0.4 Sv has therefore been driven down to a lower value as we observed which led to a downward curvature of the dose response for IHD mortality.
To date, evidence of the effect of radiation exposure on IHD at low doses has been supportive, however, the heterogeneity observed in the risk between different studies warrants further investigation. Continued follow-up and analysis of large cohorts are essential to provide more robust evidence of radiation risks at low doses.
7. Limitation and strength of this study
The largest source of uncertainty is from the dosimetry. Early dosimeters had high threshold detection limits, and the assessment of neutron exposure in the first 20–30 years of follow-up was poor, although overall, neutron exposure is thought to make up only a small component of the total external exposure. Another drawback is the lack of quantitative estimates of the internal dose. There was also no information regarding confounding lifestyle factors such as smoking, medical history of diabetes, obesity, hypertension, high levels of blood LDL, and body mass index. Nevertheless, many studies adjusted for lifestyle factors have showed little effect, as noted in the recent review (Little et al 2023). This analysis was based only on information on mortality, which could be less informative than studies based on incidence data. Despite these limitations, NRRW has its own strengths. It is based on prospectively collected national mortality data and a unified set of dose estimates collected independently, and therefore, is blind to health status. The low opt-out ratio of the subjects is another significant strength of this cohort study.
8. Conclusions
The overall dose-response relationship for IHD in the NRRW cohort showed a downward curvature in the excess risk at higher dose levels >0.4 Sv, and the overall shape of the dose-response relationship could be described by a linear-quadratic model. We associate this with the fact that a large proportion of person-year contribution in the dose category >0.4 Sv come from workers first exposed <30 years and the ERR of IHD for this group was smaller than other groups. We have modelled the dose response by the age-at-exposure groups and saw that the dose response relationship was best described by a linear trend for age-at-exposure >30 years old. However, for those first exposed <30 years old, there was no clear evidence of excess risk of IHD mortality for radiation doses below 0.1 Sv and beyond 0.4 Sv, the increased risk was only in the dose range between 0.1 Sv and 0.4 Sv. Among workers first exposed <30 years, it was also found that the doses received when workers were less than 35 years old or >50 years old did not contribute to their increased IHD risk, and the increased risk was observed only in relation to doses received between 35 and 50 years of age. This led to a smaller IHD risk when the IHD risk for total cumulative dose was estimated among workers first exposed <30 years old.
Data availability statement
The data cannot be made publicly available upon publication because they are owned by a third party and the terms of use prevent public distribution.
Conflict of interest
The authors declare that they have no affiliations with or involvement in any organization or entity with any financial interest in the subject matter or materials discussed in this manuscript.
Supplementary data (0.1 MB PDF)