


Abstract
Cancer incidence risks, lifetime effects and radiation detriments are determined for the whole population and various subpopulations as a result of acute and chronic exposure to low-LET radiation, taking into account the risk models, procedures and representative populations provided by ICRP. The results are given for solid cancers in different organs, as well as for soft tissue cancer in bone marrow. For most cancer sites a good agreement is obtained between the results of this study and the values published by the ICRP. The agreement with ICRP values is better for the whole population than for the working age population, where the results are systematically elevated. For chronic exposure, the years of life lost per radiation-induced cancer incidence are generally higher. In particular, this results in a radiation detriment for the whole population that is 30% higher than for acute exposure. The study reveals that risk quantities show a pronounced age dependence. The highest radiation risks are attributed to young persons; the lowest to persons in advanced ages. The total detriment imposed on people in different ages varies by a factor of about 30. The average values provided by the ICRP mask these variations and considerably underestimate radiation risks in childhood and adolescence. This also concerns the determination of the effective dose for persons in these age groups. Unlike the ICRP, which provides different nominal detriments for the whole population and the working age population, the results of this study do not support the use of different detriments for these populations.
Export citation and abstract BibTeX RIS

Original content from this work may be used under the terms of the Creative Commons Attribution 4.0 license. Any further distribution of this work must maintain attribution to the author(s) and the title of the work, journal citation and DOI.
1. Introduction
The radiation detriment expresses the total harm to health experienced by an exposed group and its descendants as a result of the group's exposure to a radiation source [1]. The International Commission on Radiological Protection (ICRP) uses the detriment (a) to estimate the consequences of continued or cumulative exposures and to recommend dose limits, (b) to compare the consequences of different distributions of equivalent dose in the body and thus to select a set of tissue weighting factors, and (c) as a basis for establishing the effective dose as the fundamental protection quantity [2, 3]. The concept implies the assumption of a linear non-threshold (LNT) dose-response relationship for stochastic effects [1, 3]. Values for nominal radiation detriment are determined from individual detriments to organs or tissues resulting from whole-body exposure to radiation with low linear energy transfer (low-LET radiation) and are reported for the whole population and for the working age population. The individual detriments result from a weighting procedure in which specific cancer risks are adjusted by parameters reflecting lethality, the impact on quality of life and years of life lost.
In the present study, radiation risks and risk-related variables are calculated for solid cancers in various organs and for soft tissue cancers in bone marrow. The methodology follows mainly the procedures for the determination of detriments attributable to ionizing radiation as set out by ICRP 103, which are partly supplemented by procedures from other relevant publications. Radiation risks to skin, bones and gonads (hereditary effects) are not considered in this study as ICRP uses nominal risk estimates for these sites [1]. The study includes the organs that are also discussed in recent publications [4, 5], which allows an additional comparison of the methodology used and the results obtained.
The approach to risk calculation used in this study differs from the recently published one [4, 6] by the application of a different survival function and the interpolation of risks within age groups. In addition, the present study extends recently published findings by providing results for years of life lost per radiation-induced cancer incidence (YLLRIC). Beside the cancer risks for the population, YLLRIC is the second relevant parameter derived from the survival data that determines the radiation detriment.
While radiation detriment was previously only calculated for acute radiation exposure, in this study the methodology is also extended to include chronic exposure. It thus follows the intention of ICRP to use the radiation detriment to assess the consequences of continued or cumulative exposure. Contrary to acute exposure that mainly occurs due to accidents or other exceptional events, chronic radiation exposure is the most common exposure scenario. It arises from exposure to artificial radiation sources during normal operation at the workplace, from long-term consequences of nuclear accidents and from permanent natural radiation. Typical dose rates are in the range of a few millisieverts per year.
Chronic exposure is simulated by accumulation of risk contributions that arise at the considered age as a result of past exposures. This approach follows from the assumption of an LNT dose-response relationship for stochastic effects. The mathematical evidence, including the necessary requirements for the uniform treatment of acute and chronic exposures, was developed in a previous publication [7].
The methodology used in this study allows the recalculation of risks and detriments for the whole population and the working age population, as well as verification of data published by the ICRP. It also allows the calculation of risks and detriments for other subgroups of the population. Within this study, additional results are provided for the population under 18 years of age (children and adolescents) and for the population aged 65 years and older. This makes it possible to discuss the consequences with regard to the age-dependency of radiation detriment. It is hoped that some of the issues addressed may also be considered for the review of the detriment calculation methodology currently being conducted by ICRP.
In the following, the results of the calculations are presented and discussed. The methodology used for the risk calculation is only outlined; formulas are omitted as far as possible. For a detailed presentation of the methodology and the calculation procedures, it is referred to the supplementary material for this article available online.
2. Data and methods
2.1. Data and risk models
The cancer-specific mortality and incidence data of the Asian and Euro-American representative populations according to ICRP 103, tables A.4.10–A.4.17 [1] are used. The data are provided for all causes, all cancer and all solid cancer as well as for the solid cancer in the specific organs oesophagus, stomach, colon, liver, lung, female breast, ovary, bladder and thyroid. In addition, data are available for soft tissue cancer affecting the bone marrow (leukaemia).
According to the procedure of ICRP, the radiation-associated risks are calculated for incidence data using both the excess relative risk model and the excess absolute risk model (EAR). For solid cancers, the models involve a linear dose response allowing for modifying effects of sex, exposure age and attained age [1].
The bone marrow category includes leukaemia, excluding chronic lymphocytic leukaemia, and multiple myeloma [1]. In contrast to solid cancer, a linear-quadratic dose response is proposed for modelling the risks for bone marrow cancer [1, 8]. For this purpose, ICRP uses only the EAR model with effect modification by sex, age of exposure, and attained age [8].
2.2. Risks quantities
Various risk quantities are proposed for estimating population risk:
- (a)The excess lifetime risk (ELR) is the increase in the lifetime risk of developing the cancer of interest that an individual experiences as a result of exposure compared to the risk without exposure.
- (b)The risk of exposure-induced cancer incidence (REIC) is the lifetime risk that a person will develop a cancer that has been caused by the exposure in question.
- (c)The lifetime attributable risk (LAR) was proposed as approximation of REIC [9]. Unlike the REIC, the survival function included in the LAR does not account for radiation-induced effects.
In accordance with ICRP, the LAR is used in this study to estimate risks from radiation exposure. The REIC and ELR are also considered, but of these, only the REIC is further needed to determine the years of cancer-free life lost per radiation-induced cancer.
YLLRIC reflects the impact on the lives of affected individuals and expresses the average loss of cancer-free lifetime that a person suffers if cancer develops as a result of exposure during his or her lifetime. It is calculated as the ratio between the average loss of cancer-free lifetime for the population under consideration and the REIC.
According to ICRP, lifetimes and radiation risks are provided as averages across populations, sexes and ages. For this purpose, the representative populations specified by the ICRP are taken as hypothetical stationary populations.
2.3. Exposure scenario and simulation of acute and chronic exposures
In this study, the scenarios of acute and chronic exposure to low-LET radiation with a dose of 0.1 Gy and a constant dose rate of 0.1 Gy yr−1, respectively, are considered. The dose value is consistent with the value used in another publication [4]. In ICRP 103, the dose value for which the calculations were undertaken is not reported.
In an acute exposure scenario, it is assumed that the organ or tissue under consideration is separately and instantaneously exposed to a dose from low-LET radiation (gamma radiation). The other organs or tissues are considered as not exposed. The same radiation dose is imposed on persons of all ages of the population under consideration. The radiation risks developed in the people are observed from the age of exposure up to the age of above 90 years.
The scenario assumed for chronic exposure is characterized by a constant dose rate imposed on each person starting at the age at which the person entries the population under consideration. The dose rate is maintained as long the person belongs to the population. For example, in a whole population, each person is exposed throughout life; in a working age population, the exposure occurs between the age 18 and 64 years. Likewise, in the case of chronic exposure, each organ or tissue considered is exposed individually, and the resulting radiation risks are observed even with premature cessation of exposure beyond the age of 90.
Figure 1 shows the scheme for the propagation of risks after acute exposure and for chronic exposure. For acute exposure, additional risks for cancer development occur in the years following the exposure. For chronic exposures, the risk at the attained age is the accumulation of each individual risk contribution caused by exposures in the past. The constant dose rate is simulated as successive acute single doses administered at intervals of equal duration of one year.
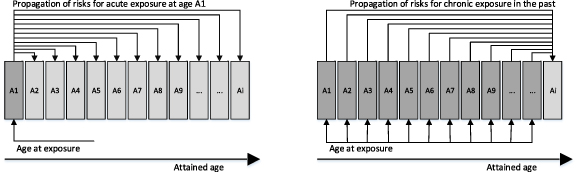
Figure 1. Propagation of risks for acute and chronic exposure.
Download figure:
Standard image High-resolution imageIt should be noted that the dose can be either the absorbed dose given in the unit Gy (Gray) or the dose equivalent given in the unit Sv (Sievert) for the radiation under consideration. The transformation between the two quantities is performed by the radiation weighting factor. For photons and other low-LET radiation, a radiation weighting factor of 1 Sv Gy−1 has been established, making the absorbed dose value identical to the dose equivalent value in the organ under consideration. According to ICRP, in this study the risk quantities are related to the equivalent dose; the exposures are expressed as absorbed doses.
2.4. Population weighting of risk estimates
Population weighting of risks takes into account the age distribution of individuals in the population by weighting age-related risks according to the number of individuals in the corresponding age. This results in a risk measure that is used to quantify the health effects of radiation in the population under consideration.
The age distributions of persons in a non-exposed stationary population are calculated from equation (20) given in the supplementary material for this article. Figure 2 represents the normalized distributions of the different populations considered in this study.
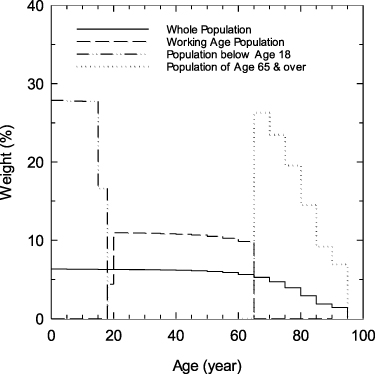
Figure 2. Age distributions of the different populations, given as averages across the representative populations; the distributions indicate the weights attributed to the different ages, which are used for the population averaging of risks; the area under the respective distribution is normalized to the value one.
Download figure:
Standard image High-resolution imageThe distributions show that the risks due to exposures of persons aged under 65 contribute almost equally weighted. This applies to the whole population, to the working age population and even more so to the subpopulation under 18. Due to the increased mortality rate with increasing age, the age distribution shows a considerable decrease for ages of 65 and over.
In this study, the different populations are considered as self-contained groups composed of people in the specified age ranges. Table 1 shows the characteristic parameters of these populations. The average lifetime is the average time an individual belongs to this population when he/she reaches the entry age for this population. For the whole population, the average lifetime is the lifetime expected for the individual at birth.
Table 1. Characteristic parameters of the different populations considered in this study; values given as averages across the representative populations and both sexes.
| Population | Percentage of the whole population % | Average lifetime |
|---|---|---|
| Below age 18 | 22.7 | 17.9 |
| Working age population | 57.2 | 45.6 |
| Age 65 & over | 20.1 | 18.2 |
| Whole population | 100 | 78.9 |
a The average lifetime for the subpopulations is the average lifetime of an individual as a member of that subpopulation.
2.5. Determination of the radiation detriment
The determination of the radiation detriment,  , for cancer c follows the approach of ICRP, as being

For a given cancer c,  represents the fatal cancer risk,
  is the non-fatal cancer risk,
  is a non-fatal weight reflecting the reduced quality of life associated with living with the cancer, and
  is the sex-specific relative life lost due to the cancer. When calculated with incidence data, the resulting risk includes the fatal and the non-fatal risk components,
  , with
  and
and  . The coefficient
  is the lethality fraction of cancer c.
Since the population-averaged LAR,  , is used as relevant risk quantity to compute the radiation detriment for sex s and cancer c, it replaces
  and the radiation detriment is finally determined from

A detailed justification for the coefficients  and
and  is given by ICRP 103 [1]. It should be noted here that the coefficients depend only from the type of cancer c, but not on sex or dose. The values for the coefficients
  and
and  are given in in table A.4.5 of ICRP 103 [1] and used without any modification.
The relative life lost is the ratio of the average years of cancer free life lost per radiation-induced cancer c,  , to the average years of life lost for all cancers,

In agreement with ICRP, the value of 15 years is used as the average years of life lost for all cancers. The value was derived from mortality data [10] and already used in ICRP 60 [2].
In the case of chronic exposures, the corresponding risks are given as risk per time interval and thus also detriment is given per time interval (usually per year),

The relative life lost,  used in equation (4) is the ratio of the value of the average years of cancer free life lost per radiation-induced cancer,
  , given in equation (33) of the supplementary material for this article to the value of 15 years as the average years of life lost for all cancers according to ICRP.
3. Results
3.1. Risk estimates
The estimates of LAR and YLLRIC for organs and tissues calculated for acute exposure of the whole population and the working age population are presented in tables 2 or 3, respectively. For comparison purposes, the corresponding data from ICRP 103 [1] and those published in [5] are given. The ICRP data for the average years of life lost are calculated by multiplying the relative life lost of ICRP with the average of 15 years for the life lost of all cancers. Since the risk calculations for breast and ovaries can only be performed for females, averaging over the sexes sets the risks for men to zero. The corresponding values for YLLRIC are those calculated for females.
Table 2. Lifetime attributable risks (LAR) and average years of life lost per radiation induced cancer incidence (YLLRIC) for organs and tissues calculated for an acute exposure of the whole population with a dose to organ of 0.1 Gy; the corresponding data published in ICRP 103 and in [5] are given for comparison; the ICRP values for the average years of life lost for the given cancer are calculated by multiplying the relative years of life lost of ICRP 103 by the average years of life lost for all cancers of 15 years [2].
| This study: acute exposure with the single dose | ICRP 103 [1] | Pub. in [5] | |||
|---|---|---|---|---|---|
| Organ or tissue |

| Nominal risk coefficient | Average years of life lost years | Lifetime risk of cancer incid. | |
| cases per 10 000 persons per Sv |
 years years | cases per 10 000 persons per Sv | cases per 10 000 persons per Sv | ||
| Oesophagus | 16.2 | 12.6 | 15.1 | 13.0 | 16 |
| Stomach | 81.2 | 13.3 | 79.1 | 13.2 | 79 |
| Colon | 69.2 | 13.1 | 65.4 | 14.5 | 66 |
| Liver | 31.3 | 13.5 | 30.3 | 13.2 | 31 |
| Lung | 124.5 | 11.8 | 114.2 | 12.0 | 108 |
| Breast | 95.4 | 14.3 | 112.1 | 19.4 | 97 |
| Ovary | 10.9 | 16.4 | 10.6 | 16.8 | 11 |
| Bladder | 47.5 | 10.8 | 43.4 | 10.6 | 41 |
| Thyroid | 29.1 | 16.5 | 32.5 | 19.4 | 19 |
| Other solid | 142.4 | 13.7 | 143.8 | 15.4 | 134 |
| Bone marrow | 66.5 | 26.5 | 41.9 | 24.4 | 63 |
| Total | 714.1 | 14.8 | 688.4 | 15.6 | 665 |
Table 3. Lifetime attributable risks (LAR) and average years of life lost per radiation induced cancer incidence (YLLRIC) for organs and tissues calculated for an acute exposure of the working age population with a dose to organ of 0.1 Gy; the corresponding data published in ICRP 103 are given for comparison; the ICRP values for the average years of life lost for the given cancer are calculated by multiplying the relative years of life lost of ICRP 103 by the average years of life lost for all cancers of 15 years [2].
| This study: acute exposure with the single dose | ICRP 103 [1] | |||
|---|---|---|---|---|
| Organ or tissue |

|
 years years | Nominal risk coefficient | Average years of life lost years |
| cases per 10 000 persons per Sv | cases per 10 000 persons per Sv | |||
| Oesophagus | 16.3 | 14.6 | 16 | 13.6 |
| Stomach | 71.2 | 15.1 | 60 | 13.4 |
| Colon | 62.3 | 14.8 | 50 | 17.0 |
| Liver | 27.6 | 15.4 | 21 | 14.0 |
| Lung | 143.6 | 13.5 | 127 | 14.4 |
| Breast | 62.1 | 16.5 | 49 | 18.0 |
| Ovary | 9.5 | 18.3 | 7 | 17.4 |
| Bladder | 46.5 | 12.2 | 42 | 12.8 |
| Thyroid | 10.2 | 18.5 | 9 | 17.8 |
| Other solid | 105.5 | 15.2 | 88 | 14.6 |
| Bone marrow | 73.2 | 27.8 | 23 | 17.6 |
| Total | 628.0 | 16.5 | 492 | 15.5 |
The calculated risks in the whole population for solid cancers other than lung and breast cancer show a slight increase of 4% on average compared to the ICRP values. The values published in [5] show a similar pattern, but with higher deviations for thyroid and the other solid cancer category. This study and the values published in [5] have in common that the highest deviations from the ICRP values are for lung, breast, and bone marrow. The values calculated for breast are lower in both studies, while the values for bone marrow are higher than the corresponding values of ICRP.
The LAR values for solid cancer in the working age population are invariably higher than those of the ICRP. Again, of note is the substantial discrepancy in the bone marrow values between this study and the ICRP.
The values for YLLRIC of the whole population are, on average, lower than those of the ICRP. In contrast, YLLRIC values for the working age population are higher. The highest YLLRIC is observed for bone marrow in both populations.
The reasons why the results of this study differ from the results published by the ICRP can be attributed to various causes:
- (a)The development of risks is calculated in this study up to the age of above 90 years, while the ICRP states that calculations are only made up to an age of 85 years.
- (b)The details of the calculation steps are not fully documented by ICRP and will differ in various studies, in particular
- the way in which incidence data are included,
- dealing with and averaging over age groups,
- the way in which the population averaging for risks and life lost quantities is performed,
- the different approaches used for the probability of surviving (see also [3, 6]),
- the dose to organ, for which the calculations are carried out (in particular for bone marrow cancer).
3.2. Linearity of risk quantities with dose
Table 4 shows the risks quantities (ELR, REIC, LAR) and YLLRIC for bone marrow cancer depending on radiation doses and dose rates, and table 5 summarizes these quantities for solid cancers. Linearity of risk measures related to the dose at acute exposure is given when the dose-related risk values are constant for different doses. Accordingly, the same applies to chronic exposure.
Table 4. Values of ELR, REIC, LAR and YLLRIC for bone marrow calculated for different acute doses and chronic dose rates.
| Whole population | Working age population | ||||||||
|---|---|---|---|---|---|---|---|---|---|
| Acute exposure | Dose Gy |

|

|

|

|

|

|

|

|
| cases per 10 000 persons per Sv | years | cases per 10 000 persons per Sv | years | ||||||
| 0.01 | 61.8 | 62.1 | 62.1 | 26.5 | 68.1 | 68.4 | 68.4 | 27.8 | |
| 0.10 | 66.1 | 66.4 | 66.4 | 26.5 | 72.8 | 73.2 | 73.2 | 27.8 | |
| 1.00 | 108.9 | 109.5 | 110.2 | 26.5 | 120.1 | 120.6 | 121.5 | 27.8 | |
| Chronic exposure | Dose Rate Gy yr−1 |

|

|

|

|

|

|

|

|
| cases per 10 000 persons per year per Sv yr−1 | years | cases per 10 000 persons per year per Sv yr−1 | years | ||||||
| 0.01 | 62.5 | 62.8 | 62.8 | 33.7 | 68.5 | 68.8 | 68.8 | 26.5 | |
| 0.10 | 66.6 | 67.0 | 67.3 | 34.0 | 72.7 | 73.1 | 73.7 | 26.6 | |
| 1.00 | 103.7 | 104.2 | 111.6 | 39.4 | 106.4 | 106.9 | 122.3 | 29.0 | |
Table 5. Total values of ELR, REIC, LAR and averaged values of YLLRIC for solid cancers calculated for different acute doses and chronic dose rates.
| Whole population | Working age population | ||||||||
|---|---|---|---|---|---|---|---|---|---|
| Acute exposure | Dose Gy |

|

|

|

|

|

|

|

|
| cases per 10 000 persons per Sv | years | cases per 10 000 persons per Sv | years | ||||||
| 0.01 | 617.9 | 647.6 | 647.7 | 13.6 | 531.2 | 554.9 | 554.9 | 15.4 | |
| 0.10 | 617.2 | 646.9 | 647.7 | 13.6 | 530.8 | 554.5 | 554.9 | 15.4 | |
| 1.00 | 610.6 | 640.0 | 647.7 | 13.6 | 527.2 | 550.7 | 554.9 | 15.4 | |
| Chronic exposure | Dose Rate Gy yr−1 |

|

|

|

|

|

|

|

|
| cases per 10 000 persons per y per Sv yr−1 | years | cases per 10 000 persons per y per Sv yr−1 | years | ||||||
| 0.01 | 619.6 | 649.4 | 652.0 | 17.6 | 532.3 | 556.1 | 557.6 | 16.5 | |
| 0.10 | 597.9 | 626.9 | 652.0 | 17.8 | 519.4 | 542.7 | 557.6 | 16.6 | |
| 1.00 | 444.1 | 466.6 | 652.0 | 19.9 | 419.2 | 438.7 | 557.6 | 17.5 | |
Values for ELR, REIC and LAR are the sums for oesophagus, stomach, colon, liver, lung, breast, ovary, bladder, thyroid and the other solid category.Values for YLLRIC are the averages for oesophagus, stomach, colon, liver, lung, breast, ovary, bladder, thyroid and the other solid category.
Based on the linear-quadratic risk model, the dose-related risks for bone marrow cancer show a pronounced dose dependence that increases with dose. At the same dose, the values for the risks ELR, REIC and LAR do not differ significantly from each other. No significant variations are observed for the YLLRIC. In the case of chronic exposure, the differences between the various risk quantities are greater. The YLLRIC value increases with increasing dose rate, but this is only relevant for doses above 0.1 Gy yr−1.
For solid cancers, the independence of LAR from dose is confirmed. ELR and REIC show little dependence on dose, which is due to the survival function that incorporates radiation-induced effects. These effects are negligible in the low dose range below 0.1 Gy, where ELR and REIC can also be considered as dose-linear quantities. At high doses, the number of people affected by radiation increases, but the probability of survival decreases more rapidly, resulting in a decrease in ELR and REIC per dose. No significant changes with dose are also observed for YLLRIC in solid cancers. For chronic exposure, the differences between the various risk measures are substantial. YLLRIC likewise increases with increasing dose rate.
3.3. Radiation detriment
From the LAR and the YLLRIC values in tables 2 and 3, respectively, the organ-specific radiation detriments are calculated for acute exposure of the whole population and the working age population according to equation (2). The detriments are presented in table 6.
Table 6. Radiation detriments for organs and tissues calculated in this study compared to the corresponding detriments published in ICRP 103 and in [4]; data given for the whole and the working age population; for working age population only data from ICRP 103 are available for comparison.
| Detriment relating to the organ or tissue | |||||
|---|---|---|---|---|---|
| Whole population | Working age population | ||||
| This study | ICRP 103 | Pub. in [4] | This study | ICRP103 | |
| Organ or tissue | 10−4 per Sv | ||||
| Oesophagus | 13.5 | 13.1 | 12.1 | 15.7 | 14.2 |
| Stomach | 70.4 | 67.7 | 67.7 | 70.0 | 51.8 |
| Colon | 45.6 | 47.9 | 48.4 | 46.7 | 43.0 |
| Liver | 28.1 | 26.6 | 27.2 | 28.4 | 19.7 |
| Lung | 97.3 | 90.3 | 83.9 | 127.8 | 120.7 |
| Breast | 49.5 | 79.8 | 78.9 | 37.3 | 32.6 |
| Ovary | 9.9 | 9.9 | 10.3 | 9.7 | 6.6 |
| Bladder | 18.7 | 16.7 | 15.5 | 20.6 | 19.3 |
| Thyroid | 9.9 | 12.7 | 12.3 | 3.9 | 3.4 |
| Other solid | 99.2 | 113.5 | 112.0 | 81.6 | 65.4 |
| Bone marrow | 106.0 | 61.5 | — | 122.1 | 23.9 |
| Total | 548.1 | 539.7 | 468.3 | 563.8 | 400.6 |
Deviations may occur due to rounding. a No data for bone marrow published. b Excluding bone marrow.
If the values for breast and bone marrow are disregarded, the total radiation detriment as the sum of the organ-specific detriments for the whole population shows a good agreement with the corresponding values of ICRP and the values published in [4]. A somewhat different picture emerges for the working age population. Here, the calculated values for radiation detriment are systematically higher than those of ICRP, which is the only basis for comparison in this case. The largest difference occurs for bone marrow cancer, while the values for breast cancer show good agreement.
4. Discussion
4.1. Decision for the lifetime attributable risk (LAR) as the relevant risk quantity
Whole-body exposure affects all organs and tissues and increases the likelihood of developing cancer in different parts of the body at the same time. This leads to a considerable shortening of life due not only to the cancer under consideration, but also to the radiation-related effects on other organs or tissues of the body. Because of this cross-interference with other sites, the whole-body exposure approach underestimates the lifetime risk of developing cancer in a particular organ or tissue.
The calculations in this study are performed assuming that each organ or tissue is exposed separately. The survival function used for ELR, REIC, and loss of life only accounts for the radiation effects on the rates for the cancer under consideration. However, the risk quantities are dose-dependent: as the radiation dose increases, the lifetime risk of solid cancers increases less (table 5). The application of LAR finally overcomes this effect as well and further simplifies the calculation. Using the survival function without accounting for radiation effects implies that at higher doses where there is substantial life shortening, LAR is somewhat larger than the actual number of attributable cancer incidence [9]. This results in a slight difference between LAR and REIC, but this is of little or no practical concern. In linear dose response models, as is the case for all solid cancers, LAR increases linearly with dose.
In order to compensate for the differences in the various risk quantities and also to minimize dose and dose rate effects associated with bone marrow, it is suggested that the concept of radiation detriment be applied only in the range of low doses below 0.1 Gy or dose rates below 0.1 Gy yr−1. Within the low dose range most exposure situations occur and stochastic radiation effects are predominant.
The decision to use LAR as the relevant risk quantity allows the total radiation detriment to be represented as a linear combination of detriments to individual organs and tissues, which is also consistent with the concept of effective dose.
4.2. Detriment for the whole and the working age population
Table 6 provides a total detriment of approx. 5.5 × 10⁻² Sv−1 for the whole population, and about 5.6 × 10⁻² Sv−1 for the working age population, respectively, determined from the calculations of individual radiation detriment for ten organs and the bone marrow tissue. It should be taken into consideration that these values do not include the contributions of skin, bone, gonads (heritable), which ICRP additionally reports as 0.34 × 10⁻² Sv−1 for the whole population, and 0.21 × 10⁻² Sv−1 for the working age population [1]. The total radiation detriment over organs and tissues in this study is consistent with the nominal detriment (detrimental adjusted nominal risk coefficient) of 5.7 × 10⁻² Sv−1 for the whole population from ICRP 103. However, the total radiation detriment for the working age population is about the same as for the whole population, and thus significantly higher than the corresponding nominal detriment of 4.2 × 10⁻² Sv−1 from ICRP 103.
Both the working age population and the other subpopulations used in this study are considered self-contained. The working age population includes only people between the ages of 18 and 64 who are collectively exposed to acute radiation dose. The emerging risks are observed up to an age of more than 90 years. Comparable detriments for the whole population and the working age population result from the age dependence of the risks: The higher risks due to exposure of younger persons in the whole population are compensated by the lower risks of older persons.
It should be noted that there are also alternative scenarios possible:
- (a)A whole population is exposed between 18 and 64 years of age, while exposures in other ages do not occur. In this case, the risks calculated in this study for the working age population should be projected to the whole population. The risks would be reduced to about 58%, which is the ratio of the lifetime of working age individuals to that of the whole population as shown in table 1.
- (b)An adult population consisting of persons of the whole population who have attained the age of 18 years is exposed between age 18 and 64. The risks for this scenario are obtained from the risks calculated in this study for the working age population, reduced to about 74%. The reduction results from the ratio of the lifetime of working age individuals according to table 1 to that of the adult population, which consists of persons aged 18 and over (average lifetime 61.6 years).
In the alternative scenarios, the respective total radiation detriment is also reduced accordingly, which could explain the lower detriment of ICRP for the working age population. From the point of view of this study, the alternatives discussed above underestimate the risks and thus the radiation exposure for occupationally exposed persons. This underestimation results from averaging over parts of the population not affected by radiation exposures. In contrast, the approach used in this study for the working age population and the other subpopulations considers only those exposed to radiation.
4.3. Risks and detriments from acute exposure vs. chronic exposure
Average risks and detriments for acute and chronic exposure are given in tables 7 or 8, respectively, for the whole population and for different subpopulations: People in childhood and adolescence (under 18 years of age), the working age population (18–64 years of age), and people of advanced age 65 and over. The respective age distributions from figure 2 were used for the population averaging.
Table 7. Average LAR, YLLRIC and detriments for organs and tissues calculated for acute exposure of different parts of the population with a dose of 0.1 Gy.
| Whole population, dose 0.1 Gy | ||||||||||||
|---|---|---|---|---|---|---|---|---|---|---|---|---|
| Age at exposure | Under 18 years | From 18 to 64 years (working age population) | From 65 years | Whole population | ||||||||
| Organs and tissues |

|

|

|

| ||||||||
| cases per 10 000 persons per Sv |
 years years |
 10−4 per Sv 10−4 per Sv | cases per 10 000 persons per Sv |
 years years |
 10−4 per Sv 10−4 per Sv | cases per 10 000 persons per Sv |
 years years |
 10−4 per Sv 10−4 per Sv | cases per 10 000 persons per Sv |
 years years |
 10−4 per Sv 10−4 per Sv | |
| Oesophagus | 17.5 | 16.4 | 19.0 | 16.3 | 14.6 | 15.7 | 14.0 | 6.5 | 6.0 | 16.2 | 12.6 | 13.5 |
| Stomach | 169.2 | 18.9 | 207.6 | 71.2 | 15.1 | 70.0 | 10.8 | 6.4 | 4.5 | 81.2 | 13.3 | 70.4 |
| Colon | 135.1 | 18.1 | 123.7 | 62.3 | 14.8 | 46.7 | 10.2 | 6.5 | 3.3 | 69.2 | 13.1 | 45.6 |
| Liver | 63.9 | 19.0 | 81.0 | 27.6 | 15.4 | 28.4 | 3.7 | 6.5 | 1.6 | 31.3 | 13.5 | 28.1 |
| Lung | 126.5 | 15.0 | 125.1 | 143.6 | 13.5 | 127.8 | 69.8 | 6.5 | 29.7 | 124.5 | 11.8 | 97.3 |
| Breast | 267.6 | 19.1 | 185.7 | 62.1 | 16.5 | 37.3 | 3.2 | 7.1 | 0.8 | 95.4 | 14.3 | 49.5 |
| Ovary | 24.3 | 25.0 | 33.8 | 9.5 | 18.3 | 9.7 | 1.1 | 7.2 | 0.4 | 10.9 | 16.4 | 9.9 |
| Bladder | 79.0 | 13.8 | 39.7 | 46.5 | 12.2 | 20.6 | 13.7 | 6.3 | 3.1 | 47.5 | 10.8 | 18.7 |
| Thyroid | 105.0 | 25.8 | 55.6 | 10.2 | 18.5 | 3.9 | 0.1 | 6.7 | 0.0 | 29.1 | 16.5 | 9.9 |
| Other solid | 340.3 | 20.6 | 357.1 | 105.5 | 15.2 | 81.6 | 11.2 | 6.4 | 3.7 | 142.4 | 13.7 | 99.2 |
| Bone marrow | 82.4 | 58.7 | 290.6 | 73.2 | 27.8 | 122.1 | 28.2 | 7.0 | 12.0 | 66.4 | 26.5 | 106.0 |
| Total | 1410.8 | 22.8 | 1518.9 | 628.0 | 16.5 | 563.8 | 166.0 | 6.6 | 65.1 | 714.1 | 14.8 | 548.1 |
Table 8. Average LAR, YLLRIC and detriments for organs and tissues calculated for chronic exposure over different ages with a constant dose rate of 0.1 Gy yr−1.
| Whole population, dose rate 0.1 Gy yr−1 | ||||||||||||
|---|---|---|---|---|---|---|---|---|---|---|---|---|
| Age at exposure | Under 18 years | From 18 to 64 years (working ages) | From 65 years | Throughout life | ||||||||
| Organs and tissues |

|
 years years |
 10−4 per year per Sv yr−1 10−4 per year per Sv yr−1
|

|
 years years |
 10−4 per year per Sv yr−1 10−4 per year per Sv yr−1
|

|
 years years |
 10−4 per year per Sv yr−1 10−4 per year per Sv yr−1
|

|
 years years |
 10−4 per year per Sv yr−1 10−4 per year per Sv yr−1
|
| cases per 10 000 persons per year per Sv yr−1 | cases per 10 000 persons per year per Sv yr−1 | cases per 10 000 persons per year per Sv yr−1 | cases per 10 000 persons per year per Sv yr−1 | |||||||||
| Oesophagus | 17.5 | 16.4 | 19.0 | 16.4 | 14.4 | 15.7 | 15.3 | 7.1 | 7.2 | 16.5 | 13.6 | 14.9 |
| Stomach | 169.4 | 19.1 | 209.5 | 71.8 | 16.3 | 76.2 | 11.6 | 7.5 | 5.6 | 81.6 | 17.5 | 93.0 |
| Colon | 135.3 | 18.2 | 123.9 | 62.7 | 15.7 | 49.8 | 11.1 | 7.6 | 4.3 | 69.6 | 16.7 | 58.5 |
| Liver | 64.0 | 19.1 | 81.1 | 27.7 | 16.4 | 30.1 | 4.0 | 7.7 | 2.0 | 31.5 | 17.5 | 36.8 |
| Lung | 126.6 | 15.0 | 125.2 | 144.6 | 13.6 | 130.2 | 75.6 | 7.4 | 36.6 | 126.3 | 13.4 | 111.2 |
| Breast | 267.9 | 19.5 | 190.3 | 62.8 | 18.1 | 41.5 | 3.4 | 8.5 | 1.1 | 95.6 | 19.2 | 66.9 |
| Ovary | 24.3 | 25.3 | 34.2 | 9.6 | 20.0 | 10.6 | 1.1 | 8.4 | 0.5 | 11.0 | 22.4 | 13.7 |
| Bladder | 79.1 | 13.9 | 40.2 | 46.8 | 12.5 | 21.2 | 14.9 | 7.1 | 3.8 | 47.9 | 12.8 | 22.2 |
| Thyroid | 105.2 | 26.1 | 56.4 | 10.2 | 22.5 | 4.7 | 0.1 | 8.3 | 0.0 | 29.1 | 25.4 | 15.2 |
| Other solid | 340.8 | 21.2 | 368.0 | 106.6 | 16.7 | 90.6 | 12.1 | 7.5 | 4.6 | 143.0 | 19.3 | 141.3 |
| Bone marrow | 82.5 | 59.5 | 295.4 | 73.7 | 26.6 | 117.7 | 31.0 | 8.5 | 15.9 | 67.3 | 34.0 | 137.8 |
| Total | 1412.6 | 23.0 | 1543.2 | 632.9 | 17.5 | 588.3 | 180.2 | 7.8 | 81.6 | 719.4 | 19.3 | 711.5 |
From the first view, good agreement of the exposure-related risk quantities is obtained for acute and chronic exposure. However, the interpretation of the results is different:
- (a)In an acute exposure situation, the population is instantaneously exposed to radiation dose. The risks are observed for the remaining lifetime of the people belonging to this population and are a measure of the adverse effects that will develop in the future. The risks are given in the unit per dose.
- (b)In the case of chronic exposure, the population has been continuously exposed to a dose rate in the past. The risks measure the adverse effects to which the individuals are subjected at the time of observation. The risks are given in the unit per year per dose rate. The unit indicates the cases that occur in an observation period of one year.
The good agreement of the values obtained for acute and chronic exposure confirm the theoretical considerations [7] and support the confidence in the methodology developed in this study for the determination of radiation risks.
A closer look at the results shows that YLLRIC is generally higher for chronic exposure than for acute exposure. While the increase for the subpopulations is small or moderate, the YLLRIC for the whole population is on average about 30% higher.
The difference in YLLRIC for acute and chronic exposure can be attributed to the different exposure scenarios. When an acute exposure occurs, the person has no risks from previous exposures. For chronic exposures, the risk at the attained age is the accumulation over those caused by previous exposures. Risk burden from previous exposures, already present at this age, may lead to earlier cancer development with chronic exposure. The longer the population is exposed to radiation, the stronger the effect. For a whole population, where individuals are exposed to radiation throughout their lives, cancer could occur earlier in life, leading to an increase in YLLRIC.
Looking at individual cancers sites, the oesophagus, lung, and bladder show the smallest differences in YLLRIC between acute and chronic exposure of the whole population. Cancer develops at these sites at advanced ages. Exposures at young ages do not strongly affect the YLLRIC value.
The increased YLLRIC for chronic exposures is transferred to the radiation detriments and results in an approx. 30% higher value for the whole population on average and a slight increase for the subpopulations.
4.4. Age dependence of risks and detriments
Tables 7 and 8 reveal the age dependence of risks and detriments. As expected, the highest detriments are associated with exposures during childhood and adolescence. Since these values are population-averaged, children under 5 years of age are attributed even higher detriment than those reported in the tables. A total detriment of about 0.19 per Sv is calculated for children under 5 years of age. The lowest risks and detriments are attributed to people in age 65 and over. Within the whole population, the total detriment imposed on people varies by a factor of about 30. The average values provided by ICRP for the whole population mask these variations and underestimate radiation risks in childhood and adolescence by a factor of more than three. Since the detriments are the basis for establishing the effective dose, this leads to a similar underestimation of the effective dose for people in these age groups.
It should be noted that unlike other cancer sites, the lung is an exception: The risks are not significantly increased for exposures in childhood and adolescence compared to the whole population. In contrast to other cancers, the risk of lung cancer is even higher for exposures in the working age population than for exposures at younger ages.
Figures 3 and 4 shows the LAR and the YLLRIC for acute exposure of the whole population and the working age population depending on age of exposure. The figures contain information for the selected organs: bladder, thyroid, lung and bone marrow. The LAR is given unweighted and weighted using the weights presented in figure 1. The sum of the weighted LAR across the ages at exposure gives the population-averaged LAR. The resulting YLLRIC is the unweighted average across the ages at exposure.
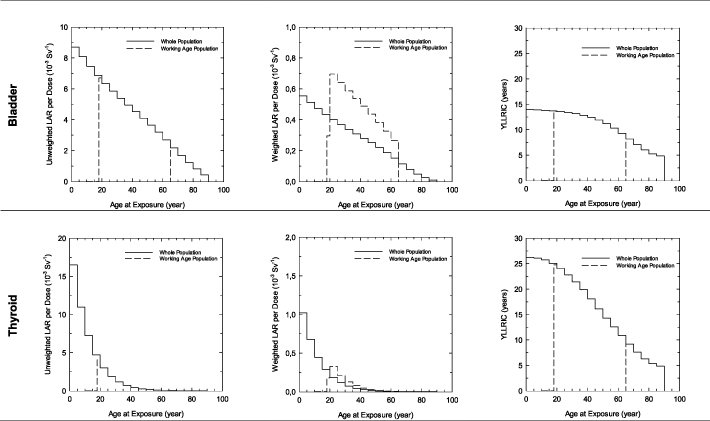
Figure 3. Lifetime attributable risk (LAR) for the whole population and the working age population and years of life lost per radiation-induced cancer (YLLRIC) depending on age of exposure for bladder and thyroid; data calculated for an acute exposure of a dose of 0.1 Gy; LAR is given unweighted and weighted with weights according to figure 2.
Download figure:
Standard image High-resolution image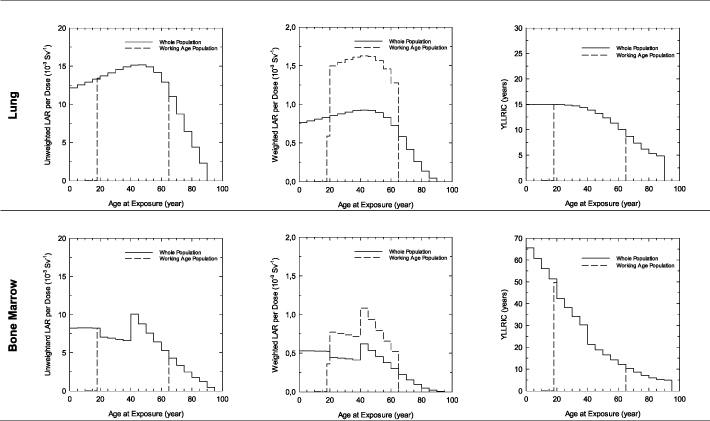
Figure 4. Lifetime attributable risk (LAR) for the whole population and the working age population and years of life lost per radiation-induced cancer (YLLRIC) depending on age of exposure for lung and bone marrow; data calculated for an acute exposure of a dose of 0.1 Gy; LAR is given unweighted and weighted with weights according to figure 2.
Download figure:
Standard image High-resolution image
4.4.1. Bladder
The figures for the bladder are typical for many cancer sites. The risks are high when the exposure occurs during young ages; the risks decrease with age at exposure. Due to the higher weighting factors, the weighted LAR for the working age population is elevated compared to the whole population for the given age at exposure. The data in table 7 show that the population-averaged LAR for bladder cancer does not differ significantly between the two populations, suggesting that summation across all ages of exposure results in similar values. Even if exposure occurs during young ages, bladder cancer only develops with age. The values for YLLRIC vary only slightly up to the age of 40 years, after which the values of YLLRIC decrease due to the decreasing remaining life span.
4.4.2. Thyroid
For thyroid cancer, the risks are very high for exposure in young ages, but low for exposure in old ages. Because there is a time lag in the onset of exposure for the working age population, the population-averaged LAR is higher for the whole population. Exposures at young ages also favour cancer development earlier in life, leading to high YLLRIC at young ages. YLLRIC decrease with increasing age of exposure.
4.4.3. Lung
The LAR for lung cancer has a particular progression: it increases with age at exposure, reaching a maximum in the age between 40 and 50 years and drops off for ages over 50. This progression results from the combination of two effects: lung cancer develops at an advanced age (usually at the end of life) and the increase in risk expected at the attained age is lower if the exposure occurred longer ago. Therefore, individuals exposed at a young age have a lower risk of developing lung cancer at an advanced age than those with exposures around 40–50 years of age. YLLRIC changes little until the age of 40.
4.4.4. Bone marrow
The cancer risks for bone marrow show a step function up to the age of 40 years, which is a consequence of the risk model. The risks remain high up to the age of 40 years and decrease for exposures at ages above. The outstanding feature of bone marrow cancer is its development at a young age, which leads to the highest YLLRIC of all cancers sites considered, and which consequently determines the high radiation detriment attributed to this site.
5. Conclusion
The risk and lifetime quantities were calculated for the whole and the working age population as a result of acute and chronic exposure to low-LET radiation (gamma radiation). The calculations were carried out using the risk models, procedures and representative populations provided by ICRP 103 [1]. Results were given for the solid organs oesophagus, stomach, colon, liver, lung, female breast, ovary, bladder, thyroid and other solid cancers, and the soft tissue bone marrow.
This study includes the development of the methodology for deriving risk quantities and the years of life lost per radiation-induced cancer. The methodology is presented in a supplement.
Although for most cancer sites a fairly good agreement was obtained between the results of this study and the values published by the ICRP and in [4], significant differences were observed for breast and bone marrow. For all other cancer sites, the agreement with ICRP values was better for the whole population than for the working age population, where the results were systematically elevated.
The LAR for solid cancer increases linearly with increasing dose or dose rate. The risk for bone marrow cancer exhibits a pronounced dose dependence due to the linear-quadratic dose-response relationship. The number of years of life lost per radiation-induced cancer shows no significant dose dependence for any cancer type in acute exposure. For chronic exposure, the number of years of life lost increases significantly at dose rates above 0.1 Gy yr−1. In combination with the number of years of life lost, the risk to the bone marrow accounts for a significant proportion of the total radiation detriment and dominates the detriment at high doses.
For chronic exposure, the risks are not different from acute exposure, but YLLRIC is generally higher, suggesting earlier onset of cancer with prolonged exposure. This has important implications for the radiation detriment of the whole population, which is on average about 30% higher for chronic exposure throughout life than for an acute exposure.
The study reveals that risk quantities show a pronounced age dependence. The highest radiation risks are attributed to young persons; the lowest to persons in advanced ages. The total detriment imposed on people in different ages varies by a factor of about 30. The average values provided by the ICRP mask these variations and considerably underestimate radiation risks in childhood and adolescence. This also concerns the determination of the effective dose for persons in these age groups.
Unlike the ICRP, which provides different nominal detriments for the whole population and the working age population, the results of this study do not support the use of different detriments. The radiation detriment calculated for the working age population is not significantly different from that for the whole population.
The calculations in this study were performed with Microsoft Excel using VBA code. However, further work is needed on the software to improve its usability for the public. The author would welcome and be pleased to contribute to the development of a flexible, easy-to-use, publicly available (preferably open source) tool for lifetime risk and detriment computations.
Acknowledgment
I thank Dr F Heinzl from the Epidemiology Unit of the Federal Office for Radiation Protection (BfS) for his support and comments, which contributed significantly to the improvement of the manuscript.
Supplementary data (0.4 MB PDF)