

Abstract
The Japanese Epidemiological Study on Low-Dose Radiation Effects (J-EPISODE) has been conducted since 1990 by the Radiation Effects Association to analyse health effects for nuclear workers. It uses the recorded doses, i.e. dosimeter readings, evaluated in Hp(10) for estimation of radiation risk; however, the International Commission on Radiological Protection does not recommend the use of effective doses for epidemiological evaluation and instead recommends the use of organ-absorbed doses for assessing cancer risk. Recently, the J-EPISODE has developed a conversion factor that can convert dosimeter readings to organ-absorbed doses following, in principle, the approach adopted by the International Agency for Research on Cancer 15-Country Collaborative Study. The approach was modified based on recent dosimeter usage practices and the Japanese physique. The aim of this study was to reanalyse the excess relative risk (ERR) of cancer mortality for the J-EPISODE using the previous analysis method but substituting the organ-absorbed dose for the recorded dose to confirm the adaptability and relevance of organ-absorbed doses for the J-EPISODE. The organ-absorbed doses from 1957 to 2010 were reconstructed for the whole cohort. The cancer mortality risk was reanalysed with Poisson regression methods, first by comparing the ERR/Gy for all cancers excluding leukaemia with the risk after excluding lung cancer for the whole cohort of 204 103 participants. In the whole cohort, all cancers excluding leukaemia, lung cancer and non-Hodgkin's lymphoma had statistically significant positive ERR/Gy estimates; leukaemia excluding chronic lymphocytic leukaemia had negative but not statistically significant estimates. Gallbladder cancer and pancreatic cancer showed statistically significant negative. Then, a subcohort of 71 733 respondents was selected based on lifestyle surveys with data on qualitative smoking status as well as quantitative smoking information on pack-years. Pack-years for current smokers and former smokers and years since the cessation of smoking for former smokers were used for the smoking-adjusted model. The most important feature of the J-EPISODE revealed to date was a decreasing tendency of the ERR/Sv by the smoking adjustment. For almost all causes of death such as lung cancer and stomach cancer, the estimated ERR/Gy decreased by the smoking adjustment, although those for the colon, prostate and kidney and other urinary organs were almost the same after the adjustment. This tendency remained unchanged even when using the organ-absorbed dose, indicating the appropriateness of using organ-absorbed doses for further risk analysis. At the same time, it indicated that confounding by smoking seriously biased the radiation risk estimates in the J-EPISODE and thus should be accounted even if organ dose is used.
Export citation and abstract BibTeX RIS

Original content from this work may be used under the terms of the Creative Commons Attribution 4.0 license. Any further distribution of this work must maintain attribution to the author(s) and the title of the work, journal citation and DOI.
1. Introduction
1.1. Construction of conversion factors from dosimeter readings to organ-absorbed doses
Since 1990, the Institute of Radiation Epidemiology of the Radiation Effects Association (REA) has been conducting a nuclear worker cohort study, the Japanese Epidemiological Study on Low-Dose Radiation Effects (J-EPISODE), to analyse the health effects. The J-EPISODE has estimated the radiation risk associated with photon exposure assessed in the personal dose equivalent, Hp(10), which is a good estimator of the effective dose. The Japanese nuclear industry started in the late 1950s, and the annual recorded doses, i.e. dosimeter readings, from 1957 to 2010 evaluated in Hp(10) were provided by the Radiation Dose Registration Center (RADREC), REA (Asano and Ito 2019). The endpoints were cancer deaths until the present. Cancer incidence data have also been available since 2016 from the National Cancer Registry (Matsuda and Sobue 2015).
The J-EPISODE has recently constructed organ-absorbed dose conversion coefficients from dosimeter readings recorded in RADREC, as described in the sister papers (Furuta et al 2020a, 2020b, 2021). Although the concept of effective dose and its operational definition of personal dose equivalent are widely used for radiological protection purpose, the International Commission on Radiological Protection (ICRP) does not recommend the use of effective doses for epidemiological evaluation (ICRP 2007); rather, it recommends using organ-absorbed doses for cancer risk evaluations in epidemiological cohort studies. The method adopted by the J-EPISODE was based on established organ dose reconstruction methods and followed, in principle, the methodology of the International Agency for Research on Cancer (IARC) 15-Country Collaborative Study (hereinafter called the 15-Country Study) (Thierry-Chef et al 2007). The framework for the conversion from a dosimeter reading to an organ-absorbed dose was summarised as follows:
- (a)The 15-Country Study examined the dosimeter response to photon exposure for the dosimeter types of old film badges (FBs), multi-element FBs and thermoluminescence dosimeters (TLDs). Data for the dosimeter types recently in use were supplemented with data obtained by the J-EPISODE from experiments on the dosimeter response—dosimeter reading per air kerma—for radio-photoluminescent glass dosimeters (glass badges [GBs]), active personal dosimeters (hereinafter called electronic personal dosimeters [EPDs]) and optically stimulated luminescence dosimeters (Luminess badges [LBs]). The supplementary data were obtained using a device that irradiated an anthropomorphic phantom in the Japan Atomic Energy Agency (JAEA) calibration laboratories.
- (b)The reconstruction of an organ-absorbed dose required information on the photon energy and geometry distribution of the exposed population. The J-EPISODE employed the 15-Country Study assumption; on average, in nuclear power plants (NPPs), 10% of the dose received by nuclear workers was due to photon energies ranging from 100 to 300 keV and 90% from photon energies ranging from 300 to 3000 keV. In mixed activities (MA) facilities, such as research and development organisations and fuel processing factories, 20% of the dose came from photon energies ranging from 100 to 300 keV and 80% from photon energies ranging from 300 to 3000 keV, with the average geometry being 50% in the anteroposterior geometry and 50% in the isotropic geometry for NPPs and MA facilities. A literature survey also disclosed survey reports jointly conducted by Japanese electric power companies in the 1980s. The analysis of the working environments of Japanese workers in NPPs demonstrated the appropriateness of applying the 15-Country Study assumption for nuclear workers in Japan.
- (c)The J-EPISODE subjects differ physically from the references defined by the ICRP. The 15-Country Study used a conversion coefficient computed from ICRP Publication 74, which was a simulation result using the reference computational phantom for an adult male based on the standard Caucasian physique (ICRP 1996). By contrast, the J-EPISODE estimated a conversion coefficient from air kerma to an organ-absorbed dose based on JM-103—an adult male voxel phantom with an average Japanese size (Sato and Takahashi 2012). Eventually, the differences in conversion coefficients were small. The conversion coefficient was estimated for the following 14 tissues/organs: the colon, red bone marrow (RBM), oesophagus, stomach, liver, gallbladder, spleen, lungs, pancreas, prostate, bladder, kidneys, brain and heart.
- (d)Bias regarding any differences in dosimeter calibration was taken into account, because until 1988, the physical quantity of exposure—expressed in terms of roentgen (R) units—was measured by personal dosimeters calibrated in free air. By contrast, personal dosimeters since 1989 have been designed to measure phantom-related operational quantities. Therefore, the bias factor for the recorded doses in Sv until 1988 was defined as the ratio between the recorded dose Hp(10) raised by backscatter radiation from the body and the delivered dose in Hp(10).
- (e)Integration of the above-mentioned factors using a mathematical model of a lognormal distribution resulted in the conversion factors from the dosimeter reading to the organ-absorbed dose by dosimeter type (FB, TLD, GB, EPD and LB), nuclear facility type (NPP or MA facility) and period (until 1988 or since 1989). Figure 1 shows the conversion factor, the organ-absorbed dose per dosimeter reading (Gy/Sv), according to tissue/organ for selected combinations of dosimeter types, nuclear facility type and period. The conversion factor was approximately 0.7–0.9 Gy Sv−1 (Furuta et al 2021). The values were higher in the lungs, stomach and gallbladder but lower in the kidneys, prostate and spleen. According to dosimeter type, the dosimeter responses for FB and LB contributed less than those for EPD, GB and TLD. The contribution of the dosimeters from MA facilities was approximately 2% less than that of dosimeters from NPP facilities. In the period until 1988, the roentgen era, the contribution was approximately 4% lower than that in the period since 1989 (Furuta et al 2021).

Figure 1. Conversion factor from the dosimeter reading to the organ-absorbed dose (Gy/Sv) by tissue/organ for specific combinations of dosimeter type, nuclear facility type and period; Film badge (FB) used in NPPs until 1988, TLD used in the mixed activities (MA) facilities until 1988, EPD used in NPPs since 1989 and Glass badge (GB) used in NPPs since 1989.
Download figure:
Standard image High-resolution imageFor more details about the methods used to estimate organ-absorbed doses, please refer to the sister papers (Furuta et al 2020a, 2020b, 2021).
1.2. Smoking as a possible confounding factor
One advantage of the J-EPISODE was that it has information on smoking and the earlier analyses suggested that smoking might be a strong confounder in the association between radiation and cancer mortality. The REA (2015) compared the estimated excess relative risks (ERRs)/Sv for all cancers excluding leukaemia for all 204 103 participants, and for all cancers excluding lung cancer and excluding leukaemia. The REA (2015) also compared the 75 442 respondents to lifestyle surveys who reported smoking information, for their estimated ERRs/Sv for all cancers excluding leukaemia, with and without the smoking adjustment, using qualitative information on smoking status. Of the 75 442 participants, 71 733 had quantitative information on pack-years. These data were analysed and the estimated ERRs/Sv for all cancers excluding leukaemia with and without the smoking adjustment were compared. Details were described in Kudo et al (2018).
1.3. Previous nuclear worker cohort studies on cancer risk: pros and cons
The Life Span Study (LSS) of Atomic bomb survivors is regarded as the gold standard for radiation protection from high-dose and high-dose-rate radiation exposures (Ozasa et al 2012, Grant et al 2017). Many cohort studies have been conducted on nuclear workers to investigate the effects of low-dose and low-dose-rate radiation exposures, but the results remain controversial. The goal of many occupational cohort studies on nuclear workers was to obtain risk estimates, compatible with that of the LSS, for low-dose/low-dose-rate radiation effects directly from the cohort instead of extrapolating from the results of the LSS for high-dose/high-dose-rate exposures. Therefore, accumulation of a large number of person-years of follow-up and observed deaths is crucial to obtain precise risk estimates for prolonged low-dose and low-dose-rate exposures. Of these studies, historical cohort studies, such as the 15-Country Study (Cardis et al 2007, Vrijheid et al 2007) and the International Nuclear Workers Study (INWORKS) (Richardson et al 2015, Hamra et al 2016), which set their retrospective observations from the 1940s or 1950s, already fulfilled this requirement. The long follow-up duration was a strength and contributed to the improved accuracy of the risk estimates. One of the features of occupational exposure cohorts is that each worker carries a personal dosimeter; thus dose information on external exposure, which is the dominant dose, can be obtained relatively accurately. However, the uncertainty regarding dosimetry in the early years and especially the possible exposure to neutrons in relation to nuclear weapons production are also weaknesses of the cohorts (Fix et al 1997, Wakeford 2021). The study of dose errors remarkably progressed during the 15-Country Study and organ doses were reconstructed. Another weakness was the lack of control of potential confounders.
In contrast to the historical cohort studies, the J-EPISODE mostly consisted of NPP workers and started its follow-up in the 1990s using the doses recorded since 1957. It has to accumulate person-years to obtain reliable results. The J-EPISODE did not experience such serious problems with dosimetry as those in the historical cohort studies because the nuclear industry started later in Japan than in the United States and Western Europe, and the J-EPISODE did not include nuclear weapons industries. The J-EPISODE finally performed an organ dose reconstruction and is now in the same position as the historical cohort studies with regard to dosimetry. Its weakness was its short follow-up period, which resulted in unstable risk estimates with wide confidence intervals (CIs). However, the limited uncertainty regarding dosimetry and the possible control of confounders were its advantages.
1.4. Aim
The primary aim of this study was to reanalyse the ERR of cancer mortality for the J-EPISODE using the same method used in previous analyses, except the reconstructed organ-absorbed dose was used instead of the recorded dose. The second aim was to confirm the adaptability of organ-absorbed dose and relevancy of the estimated radiation risk obtained by using organ-absorbed dose for the J-EPISODE.
2. Methods
The manuscript focused on determining whether the main features of the results remained unchanged regardless of whether the doses applied for the analysis were the recorded doses or the reconstructed organ-absorbed doses. The analysis methods for risk estimation for the J-EPISODE have been described elsewhere (REA 2015, Kudo et al 2018). Here, we briefly describe the method in terms of the comparability between the present study and the previous studies.
2.1. Cohort definition
Two cohorts were included in the analysis: the whole cohort and the subcohort. The whole cohort consisted of 204 103 Japanese male workers who were registered with the RADREC as of the end of March 1999. The whole cohort was followed up from 1991 to 2010. The subcohort consisted of 71 733 participants from the whole cohort who responded to the lifestyle surveys described below and who included smoking information on pack-years (hereinafter referred as the subcohort). The subcohort was followed up from 1999 to 2010 (table 1).
Table 1. Profile of the J-EPISODE.
| Item | The whole cohort | The subcohort with smoking information on pack-years | ICD-10 codes |
|---|---|---|---|
| Cohort size for analysis | 204 103 males | 71 733 males | |
| Follow-up period | 1991–2010 | 1999–2010 | |
| Total person-years | 2889 000 | 591 000 | |
| Mean years of follow-up | 14.2 | 8.2 | |
| Number of deaths | |||
| All cancers (ca) excluding leukaemia | 7929 | 1326 | C00–C97 except C91–C95 |
| Ca of oral cavity and pharynx | 201 | 37 | C00–C14 |
| Oesophageal ca | 441 | 87 | C15 |
| Stomach ca | 1407 | 218 | C16 |
| Colon ca | 535 | 100 | C18 |
| Rectum ca | 398 | 68 | C19–C21 |
| Liver ca | 1219 | 138 | C22 |
| Gallbladder ca | 261 | 38 | C23–C24 |
| Pancreatic ca | 531 | 109 | C25 |
| Lung ca | 1756 | 319 | C33–C34 |
| Prostate ca | 192 | 39 | C61 |
| Bladder ca | 103 | 14 | C67 |
| Ca of kidney and other urinary organs | 145 | 20 | C64–C66, C68 |
| Non-Hodgkin's Lymphoma | 176 | 34 | C82–C85, C96 |
| Multiple myeloma | 60 | 14 | C88, C90 |
| Leukaemia excluding chronic lymphocytic leukaemia | 207 | 44 | C91–C95 except C91.1 |
| Mean cumulative colon absorbed dose since 1957 at the end of follow-up (mGy) | 11.0 | 20.1 | |
| Mean age (years) | 55.6 at the end of follow-up | 45.1 at the date of survey response |
2.2. Dosimetry
The Japanese nuclear industry started in the late 1950s. Doses received by each worker in the controlled areas were monitored with a personal dosimeter. The doses were evaluated in mSv of Hp(10) and conceptually consisted of external and internal exposure doses. However, the doses received were assumed to be derived predominantly from the photon in the energy from 100 keV to 3 MeV. Each nuclear facility periodically submits its records of individual annual doses to the RADREC. These records include doses received by the own employees and contractors' workers. The J-EPISODE was provided by the RADREC with the annual recorded doses from 1957 to 2010 for each worker and each facility.
2.2.1. Organ dose reconstruction
A specific organ-absorbed dose was reconstructed based on each worker's annual recorded dose from each nuclear facility in each year categorised into an NPP or MA facility and a specific dosimeter type assigned as the primary personal dosimeter in the facility. The specific organ-absorbed dose for each worker in each year was obtained by multiplying the categorised individual annual recorded dose in Sv by the corresponding conversion factor (Gy Sv) and then summing them for each worker and year (Furuta et al 2021).
2.3. Follow-up of vital status and underlying causes of death
The endpoint of the J-EPISODE was cancer death to date. The vital status of each participant was verified by applying to the municipality for the issuance of his Resident Registration Card (RRC). If the participant was still alive, a copy of his RRC was issued; if he was deceased or had moved, a record deleting his RRC was issued. A new application for issuance was made at the new addresses of participants who had moved. The maximum retention period for the deleted records at the municipality was five years until 2020, but it has since been extended to 150 years. Therefore, RRC inquiries to municipalities were conducted at intervals of less than five years.
For participants whose deaths were ascertained through RRCs, the underlying causes of death were obtained by record linkages with the death records of the Vital Statistics approved for use and provided by the Ministry of Health, Labour and Welfare. Underlying causes of death in the death certificates were coded according to the International Classification of Diseases (ICD) tenth revision (Iwasaki et al 2000).
2.4. Lifestyle surveys
The J-EPISODE conducted lifestyle surveys in 1997 and 2003 among different samples of the whole cohort to obtain the potential confounding factors. The number of respondents was 46 141 for the first survey and 41 742 for the second survey. Some participants responded to both surveys, but only the first survey responses were analysed in the present study. The first survey examined the participants' characteristics, such as occupational history and lifestyle, which included questions on smoking status (current, former and never), age at starting to smoke, number of cigarettes smoked per day and age of the cessation of smoking for former smokers. In addition to these questions, the second survey questionnaire included information on educational history and jobs at nuclear facilities (Murata et al 2002).
Here, figure 2 illustrates the variables z1 and z2 for the pack-years, which were calculated as the number of smoking years multiplied by the number of cigarettes per day and divided by 20 (cigarettes per pack). For current smokers, z1 was the number of smoking years since the age at starting to smoke through the age at the survey date. For former smokers, z2 used the number of smoking years since the age at starting to smoke until the age of the cessation of smoking, and the variable z3 was calculated as the non-smoking years since the cessation of smoking until the age at the survey date. For participants who had never smoked, z1 –z3 were zero.

Figure 2. Illustration of pack-years for current and former smokers.
Download figure:
Standard image High-resolution image2.5. Risk estimation models
The ERR for mortality from all cancers excluding leukaemia among the male Japanese nuclear workers was estimated using a linear model and a Poisson regression method, which was applied for cross-classified data of the number of deaths and person-years. Dose accumulation lagged by two years for leukaemia excluding chronic lymphocytic leukaemia (CLL) and 10 years for other cancers. For each cancer from a tissue/organ, the corresponding organ-absorbed dose was primarily applied for the analysis. Where this was not applicable, the colon absorbed dose was applied not only for rectum cancer but also for all cancers excluding leukaemia. The RBM absorbed dose was applied for non-Hodgkin's lymphoma, multiple myeloma and leukaemia excluding CLL. The oesophagus absorbed dose was applied for cancers of the oral cavity and pharynx, and the stomach absorbed dose was applied for pancreatic cancer.
2.5.1. Model for the whole cohort
For the whole cohort of 204 103 male participants, the following model was applied:

where λ was the mortality rate at the cumulative organ-absorbed dose d (Gy), λ0 was the background mortality rate stratified by a, c and r; a was the attained age (20–, 25–, ..., 95– and 100+), c was the calendar year (1991–1994, 1995–1999, 2000–2004 and 2005–2010) and r was the residence area (Hokkaido + Tohoku, Kanto, Hokuriku, Chubu, Kinki, Chugoku, Shikoku and Kyushu + Okinawa); β was the parameter of the ERR/Gy; d was categorised into six groups by mGy levels of <5, 5–, 10–, 20–, 50– and 100+. This model was identical to that used in the previous analysis by the REA (2015), except for the use of the organ-absorbed dose instead of the recorded dose. Comparisons were first made between the ERRs/Gy from the present study and the ERRs/Sv from the previous study. Comparisons were then made between the ERR/Gy for all cancers excluding leukaemia and the ERR/Gy for all cancers excluding lung cancer and excluding leukaemia.
2.5.2. Model for the subcohort
For the subcohort of 71 733 participants who had smoking information on pack-years, the following model was applied for the smoking adjustment:

where λ was the mortality rate at the cumulative organ-absorbed dose d (Gy), λ0 was the background mortality rate stratified by a (attained age; the same category as (1)), c (calendar year; <2000, 2000–2004 and 2005–2010), y (birth year; <1920, 1920–, 1925–, ..., and 1970+), r (residence area; the same as (1)) and s (survey indicator; the first or the second). β was the parameter of the ERR/Gy. d was categorised into 14 groups by mGy levels: 0, >0, 1–, 2–, 3–, 5–, 7.5–, 10–, 15–, 20–, 25–, 50–, 100– and 200+. In the exponential term, the variables z1–z3 defined in section 2.4 were employed and α1–α3 represented the respective coefficients of z1–z3. Pack-years of z1 and z2 were categorised into eight groups: 0, >0, 10–, 15–, 20–, 25–, 30– and 50+. The non-smoking years of z3 since the cessation of smoking were categorised into three groups; <5, 5– and 10+. This model was identical to the previous analysis by Kudo et al (2018) except for the use of the organ-absorbed dose instead of the recorded dose.
The ERR/Gy, except for the smoking confounder, was directly and quantitatively estimated by the smoking-adjusted model (2) with the exponential terms of pack-years variables. Therefore, the effect of smoking as a confounder was determined by comparing the ERRs/Gy between the smoking-adjusted model (2) and the non-adjusted model without the exponential term:  .
.
The relative risk (RR) of pack-years of smoking by pack-year category was estimated by modifying model (2). The numerical variables z1 and z2 in model (2) were categorised; a pack-year categorical variable z4 including current smoker, former smoker as well as non-smoker was generated; then  in model (2) were replaced with
  The RR was obtained as the exponential of the estimated γ1.
3. Results
3.1. Reconstructed organ-absorbed dose for the J-EPISODE from 1957 to 2010
Table 2 shows the comparison of the cumulative dose between the recorded dose in Hp(10) and a specific organ-absorbed dose reconstructed in the present study. The mean cumulative dose in Hp(10) was 13.9 mSv in 2010, and the mean cumulative organ-absorbed dose was 11.0 mGy for the colon, 11.5 mGy for the lungs and 10.1 mGy for RBM. Neglecting dose unit differences, the organ dose values were approximately 0.8 times the recorded doses. This indicated that the recorded doses were overestimated in terms of the organ-absorbed dose.
Table 2. Cumulative dose of Hp(10) and a specific organ-absorbed dose during 1957–2010 for the whole cohort of 204 103 participants in the J-EPISODE.
| Organ-absorbed dose (mGy) | ||||
|---|---|---|---|---|
| Recorded dose Hp(10) (mSv) | Colon | Lungs | Red bone marrow | |
| Mean cumulative dose since 1957 at the end of follow-up | 13.9 | 11.0 | 11.5 | 10.1 |
3.2. Reanalysis results for the whole cohort
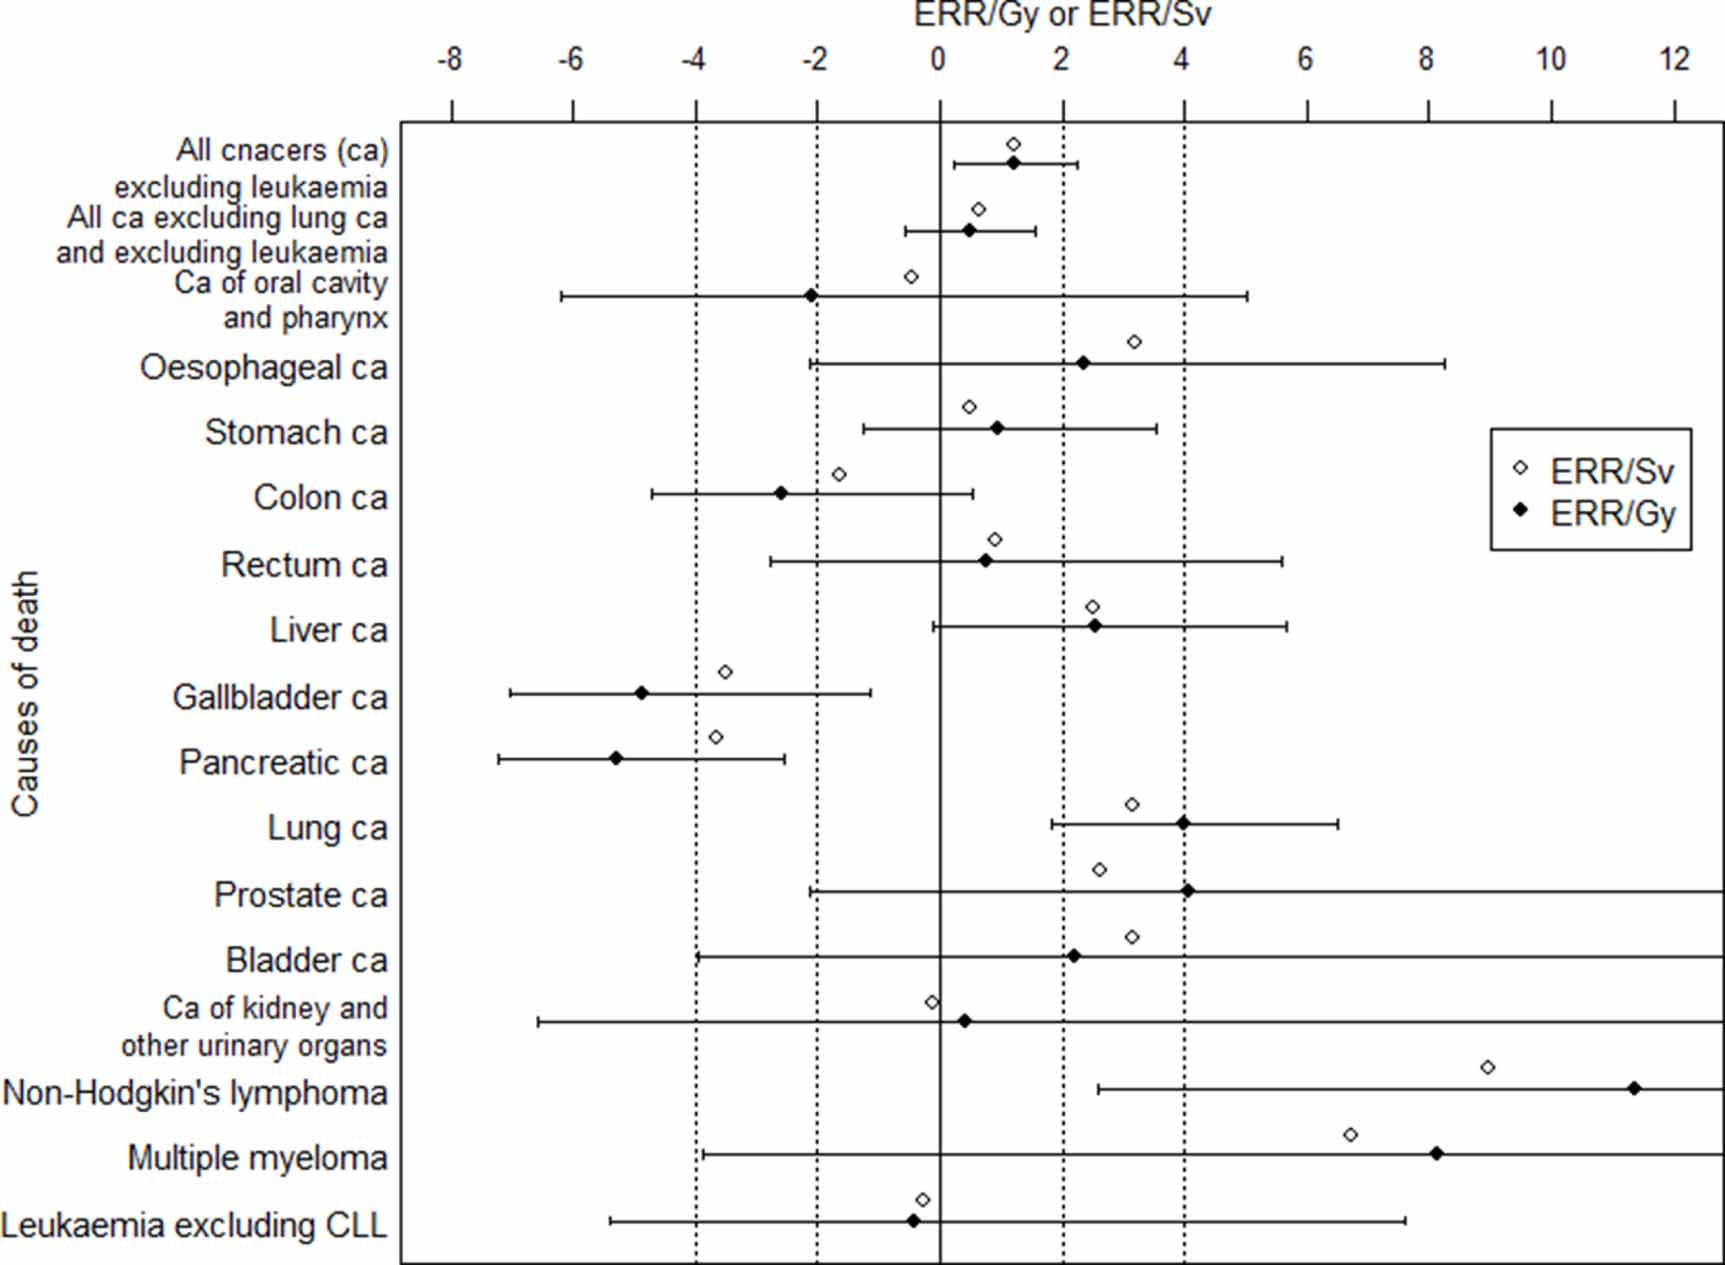
The whole cohort consisting of 204 103 participants with follow-up from 1991 to 2010 had a total person-years number of 2.9 million, a number of observed deaths from all cancers excluding leukaemia of n = 7929 and a mean age at the end of follow-up of 55.6 (table 1). As for the number of deaths by cancer site, lung cancer (n = 1756), stomach cancer (n = 1407) and liver cancer (n = 1219) contributed 55%. Figure 3 and table 3 shows the ERRs/Gy by causes of death using the organ-absorbed dose for 204 103 participants with follow-up in 1991–2010 in comparison with the ERRs/Sv using the recorded dose in Hp(10). For all cancers excluding leukaemia, the estimated ERR/Gy and 90% CI was 1.22 (0.24, 2.26), which were statistically significant positive but possibly confounded by smoking, because it decreased to 0.50 (−0.56, 1.56) when excluding lung cancer. The CIs for site-specific cancers were wider due to the small number of observed deaths (figure 3). Statistically significant positive estimates of ERR/Gy were only observed for the lung (4.00 [1.81, 6.49]), with n = 1756 and for non-Hodgkin's lymphoma (11.35 [2.58, 23.70]), with n = 176, in addition to all cancers excluding leukaemia. Positive but not statistically significant estimates were seen for the eight site-specific cancers. Statistically significant negative estimates were observed for the gallbladder (−4.87 [−7.05, −1.15]), with n = 261, and for the pancreas (−5.29 [−7.21, −2.54]), with n = 531. In addition to the estimates for leukaemia excluding CLL (−0.42 [−5.38, 7.59]) with n = 207, other two cancers were observed negative but not statistically significant.

Figure 3. ERR/Gy and 90% CI by causes of death using the organ-absorbed dose for the whole cohort of 204 103 participants in the J-EPISODE with follow-up in 1991–2010 in comparison with ERR/Sv using Hp(10).
Download figure:
Standard image High-resolution imageTable 3. Reanalysis results of the cancer mortality risk using organ-absorbed dose for the J-EPISODE, in comparison with the previous study using recorded dose.
| Present study using organ-absorbed dose | Previous study using recorded dose in Hp(10) | ||||
|---|---|---|---|---|---|
| Cause of death | Organ dose | ERR/Gy | 90% CI | ERR/Sv | 90% CI |
| The Whole cohort of all 204 103 participants with the follow-up 1991–2010 | |||||
| All cancers (ca) excluding leukaemia | Colon | 1.22 | (0.24, 2.26) | 1.20 | (0.43, 1.96) |
| All ca excluding lung ca and excluding leukaemia | Colon | 0.50 | (−0.56, 1.56) | 0.66 | (−0.18, 1.50) |
| Ca of oral cavity and pharynx | Oesophagus | −2.08 | (−6.20 a , 5.03) | −0.44 | (−4.68, 3.79) |
| Oesophageal ca | Oesophagus | 2.37 | (−2.12, 8.25) | 3.20 | (−0.37, 6.78) |
| Stomach ca | Stomach | 0.96 | (−1.24, 3.52) | 0.50 | (−1.23, 2.23) |
| Colon ca | Colon | −2.58 | (−4.73, 0.52) | −1.64 | (−4.02, 0.73) |
| Rectum ca | Colon | 0.75 | (−2.79, 5.57) | 0.90 | (−2.50, 4.29) |
| Liver ca | Liver | 2.54 | (−0.12, 5.67) | 2.52 | (0.33, 4.72) |
| Gallbladder ca | Gallbladder | −4.87 | (−7.05 a , −1.15) | −3.51 | (−6.06, −0.96) |
| Pancreatic ca | Pancreas | −5.29 | (−7.21 a , −2.54) | −3.64 | (−5.35, −1.92) |
| Lung ca | Lung | 4.00 | (1.81, 6.49) | 3.15 | (1.34, 4.96) |
| Prostate ca | Prostate | 4.07 | (−2.14, 13.31) | 2.62 | (−2.81, 8.04) |
| Bladder ca | Bladder | 2.19 | (−3.95, 13.02) | 3.14 | (−4.23, 10.51) |
| Ca of kidney and other urinary organs | Kidney | 0.41 | (−6.56 a , 12.98) | −0.13 | (−5.25, 5.00) |
| Non-Hodgkin's lymphoma | Red bone marrow | 11.35 | (2.58, 23.70) | 8.96 | (1.30, 16.62) |
| Multiple myeloma | Red bone marrow | 8.13 | (−3.88, 30.68) | 6.93 | (−5.30, 19.15) |
| Leukaemia excluding CLL | Red bone marrow | −0.42 | (−5.38, 7.59) | −0.27 | (−4.07, 3.52) |
| The subcohort of 71 733 respondents to lifestyle surveys with follow-up 1999–2010 | |||||
| All ca excluding leukaemia | |||||
| Without smoking adjustment | Colon | 1.00 | (−0.55, 2.82) | 0.80 | (−0.39, 2.19) |
| With smoking adjustment | Colon | 0.25 | (−1.16, 1.92) | 0.29 | (−0.81, 1.57) |
(1) Dose data lagged by two years for leukaemia excluding chronic lymphocytic leukaemia (CLL) and by 10 years for other cancers. They were categorised into six groups in the analysis for the whole cohort and 14 groups for the subcohort.(2) The CIs were based on the Wald method for the whole cohort and the likelihood method for the subcohort. a Last estimate is denoted because the ERRs did not converge.
3.3. Reanalysis results for the subcohort
The subcohort consisting of 71 733 participants with follow-up in 1999–2010 had a number of total person-years of 0.6 million, a number of observed deaths from all cancers excluding leukaemia of n = 1326 and a mean age at the date of survey response of 45.1 (table 1). Figure 4 and table 4 shows the ERRs/Gy and 90% CIs by causes of death with the smoking adjustment using pack-years for the subcohort and a comparison with the ERRs/Gy without the smoking adjustment. The estimated ERR/Gy for all cancers excluding leukaemia decreased from a ERR/Gy of 1.00 (−0.55, 2.82) without the smoking adjustment to 0.25 (−1.16, 1.92) with the smoking adjustment. For leukaemia excluding CLL—this is also an important tissue for radiation protection—the estimate of the ERR/Gy did not converged due to a small number of deaths (n = 44). By cancer site, the ERR/Gy decreased from 3.09 (−0.11, 7.34) to 1.56 (−1.15, 5.25) for lung cancer with observed deaths n = 319; from 0.15 (−3.35, 5.20) to a negative ERR/Gy of −0.70 (−3.74, 3.87) for stomach cancer (n = 218) (table 4). The plots of the ERRs/Gy for almost all causes of death were closer to the vertical line of the origin with the smoking adjustment than without the smoking adjustment (figure 4). However, cancers with wide CIs showed inconsistent and unstable movements. The estimates for the colon (n = 100), prostate (n = 39) and kidney and other urinary organs (n = 20) were almost the same without or with the smoking adjustment. The estimates for the oesophagus (n = 87) and non-Hodgkin's lymphoma (n = 34) were not closer to zero with the smoking adjustment than without the smoking adjustment.

Figure 4. Comparison of ERR/Gy and 90% CI by causes of death for the subcohort of the J-EPISODE with follow-up in 1999–2010 with/without the smoking adjustment.
Download figure:
Standard image High-resolution imageTable 4. ERR/Gy and 90% CI by cause of death using organ-absorbed dose for the subcohort of the J-EPISODE with follow-up in 1999–2010.
| Without smoking adjustment | With smoking adjustment | ||||
|---|---|---|---|---|---|
| Causes of death | Organ dose | ERR/Gy | 90% CI | ERR/Gy | 90% CI |
| All cancers (ca) excluding leukaemia | Colon | 1.00 | (−0.55, 2.82) | 0.25 | (−1.16, 1.92) |
| Ca of oral cavity and pharynx | Oesophagus | 6.66 | (−7.45 b , 30.94) | 4.94 | (−7.86 b , 27.25) |
| Oesophageal ca | Oesophagus | −1.08 | (−6.37, 4.21) a | −1.79 | (−6.53, 2.96) a |
| Stomach ca | Stomach | 0.15 | (−3.35 b , 5.20) | −0.70 | (−3.74 b , 3.87) |
| Colon ca | Colon | −3.17 | (−4.14, −2.19) a | −3.16 | (−5.19, −1.14) a |
| Rectum ca | Colon | 3.25 | (−2.61, 14.07) | 2.55 | (−3.38 b , 12.76) |
| Liver ca | Liver | 5.44 | (−0.66, 14.48) | 4.05 | (−1.50, 12.39) |
| Gallbladder ca | Gallbladder | −0.15 | (−8.34, 8.05) a | −0.46 | (−8.21, 7.30) a |
| Lung ca | Lung | 3.09 | (−0.11, 7.34) | 1.56 | (−1.15, 5.25) |
| Prostate ca | Prostate | −0.89 | (−10.64, 8.87) a | −0.76 | (−10.72, 9.21) a |
| Bladder ca | Bladder | 9.26 | (−17.29, 35.80) a | 7.56 | (−16.80, 31.91) a |
| Ca of kidney and other urinary organs | Kidney | 24.11 | (−2.45, 95.94) | 24.01 | (−2.55, 96.54) |
| Non-Hodgkin's lymphoma | Red bone marrow | 16.32 | (1.89, 45.30) | 17.07 | (2.18, 47.07) |
| All ca excluding lung ca and excluding leukaemia | Colon | 0.51 | (−1.20, 2.56) | −0.04 | (−1.63, 1.88) |
(1) The ERR/Gy values for pancreatic cancer, multiple myeloma and leukaemia excluding chronic lymphocytic leukaemia (CLL) were not converged.(2) The CIs were based on the likelihood method.(3) Dose data lagged by two years for leukaemia excluding CLL and by 10 years for other cancers. a Wald-based CI. b Last estimate is denoted because the ERRs did not converge.
3.4. Smoking as a possible confounder between radiation and mortality
The United Nations Scientific Committee on the Effects of Atomic Radiation (UNSCEAR) 2019 Report stated that alcohol consumption and smoking were suspected as important confounding factors that may have influenced the effects reported by the J-EPISODE (UNSCEAR 2019), citing Kudo et al (2018). In his editorial in the Journal of Radiological Protection, Akiba (2018) determined that the J-EPISODE confirmed a well-established principle of epidemiology, namely that smoking confounds the relationship between radiation and smoking-related disease risks when radiation is related to smoking.
Table 3 demonstrates the comparison of the estimated cancer mortality risk between the present and the previous study. For the 204 103 participants, the ERR/Gy for all cancers excluding leukaemia decreased when lung cancer was also excluded, as described in section 3.2. This decreasing tendency did not differ from the previous study using Hp(10) (REA 2015).
When conducting a direct adjustment of smoking using pack-years for the subcohort, the ERR/Gy without the smoking adjustment decreased, as described in section 3.3. The most important feature of the J-EPISODE was the decreasing tendency of the ERR/Sv following adjustment for smoking (Kudo et al 2018). These decreasing trends remained unchanged even when the organ-absorbed dose was used, indicating the appropriateness of using organ-absorbed doses for further risk analysis.
3.5. ERR and 90% CI by dose category for the subcohort
Figure 5 shows the ERR and 90% CI by dose category for the subcohort, i.e. the results from the direct adjustment using pack-years. The slope of the straight lines through the origin represents the ERR/Sv or ERR/Gy. The slope of the dotted line was ERR/Sv of 0.80 (90% CI: −0.39, 2.19) without the smoking adjustment using the recorded dose in Hp(10) in the previous study (Kudo et al 2018). By contrast, in the present study, the dashed line demonstrated a ERR/Gy of 1.00 (−0.55, 2.82) without the smoking adjustment using the colon absorbed dose and this decreased to the solid line of ERR/Gy 0.25 (−1.16, 1.92) with the smoking adjustment.

Figure 5. ERR and 90% CI for all cancers excluding leukaemia by dose category for the subcohort of the J-EPISODE with follow-up in 1999–2010 with the smoking adjustment using pack-years applied.
Download figure:
Standard image High-resolution image
3.5.1. Comparison of the CI results between using recorded dose (mSv) and organ dose (mGy)
In figure 5, the dot A shows a value of ERR 0.41 (−0.11, 0.93) at 261.9 mSv for the highest dose group of 200+ mSv in Hp(10) on the dotted line (Kudo et al 2018). It shifted left to the dot B on the dashed line, the value of which is 0.44 (−0.29, 1.59) at 234.0 mGy in the colon absorbed dose group of 200+ mGy (table 5), and the CI is wider, because the magnitudes of the colon absorbed dose were approximately 0.8 times the recorded dose and the number of observed deaths also decreased from n = 26 in the 200+ mSv group to n = 7 in the 200+ mGy group. Conversely, the dot C (ERR −0.17 [−0.37, 0.03] at 136.9 mSv) in the group of 100–200 mSv on the dotted line moved up to the dot D (ERR −0.10 [−0.34, 0.21] at 133.1 mGy) in the group of 100–200 mGy on the dashed line but the CIs of both the dot C and D were almost the same width (table 5). This tendency of no differences in the CIs was also found in the lower dose groups less than 100 mSv or mGy. Accordingly, the slope of the dashed straight line was steeper than the dotted straight line, i.e. the ERR/Gy of 1.00 without the smoking adjustment was larger than the ERR/Sv of 0.80 without the smoking adjustment.
Table 5. ERR and 90% CI for all cancers excluding leukaemia by dose category for the subcohort of J-EPISODE with follow-up in 1999–2010 with/without the smoking adjustment using colon absorbed dose.
| Dose category | Mean dose | Observed death | ERR and 90% CI without smoking adjustment | ERR and 90%CI with smoking adjustment |
|---|---|---|---|---|
| 0 mGy | 0.0 mGy | 313 | 0.00 | 0.00 |
| >0 | 0.4 | 188 | −0.02 (−0.16, 0.14) | −0.03 (−0.17, 0.13) |
| 1– | 1.5 | 55 | −0.08 (−0.28, 0.16) | −0.09 (−0.29, 0.16) |
| 2– | 2.5 | 41 | 0.02 (−0.23, 0.34) | 0.02 (−0.24, 0.33) |
| 3– | 3.9 | 71 | 0.19 (−0.05, 0.48) | 0.18 (−0.05, 0.46) |
| 5– | 6.2 | 60 | 0.11 (−0.12, 0.40) | 0.07 (−0.16, 0.34) |
| 7.5– | 8.7 | 71 | 0.07 (−0.15, 0.32) | 0.02 (−0.18, 0.26) |
| 10– | 12.3 | 106 | 0.08 (−0.11, 0.30) | 0.05 (−0.13, 0.27) |
| 15– | 17.4 | 78 | 0.26 (0.02, 0.55) | 0.20 (−0.03, 0.48) |
| 20– | 22.4 | 54 | 0.20 (−0.07, 0.52) | 0.17 (−0.09, 0.48) |
| 25– | 35.4 | 145 | 0.20 (0.02, 0.42) | 0.17 (−0.01, 0.38) |
| 50– | 69.4 | 103 | 0.23 (0.01, 0.48) | 0.17 (−0.04, 0.41) |
| 100– | 133.1 | 34 | −0.10 (−0.34, 0.21) | −0.17 (−0.39, 0.11) |
| 200+ | 234.0 | 7 | 0.44 (−0.29, 1.59) | 0.26 (−0.38, 1.26) |
| Previous analysis using recorded dose | ||||
| 100– mSv | 136.9 mSv | 61 | −0.17 (−0.37, 0.03) | −0.22 (−0.41, 0.03) |
| 200+ | 261.9 | 26 | 0.41 (−0.11, 0.93) | 0.27 (−0.20, 0.74) |
The CIs were based on the likelihood method.
3.5.2. ERR by dose category using organ dose with/without the smoking adjustment
Table 5 demonstrates that, for all dose groups, the ERRs without the smoking adjustment decreased to the values with the smoking adjustment. Accordingly, the slope of the solid straight line was less steep than that of the dashed straight line (figure 5), indicating the decreasing trend in the ERR/Gy with the smoking adjustment.
3.5.3. Sensitivity analysis using different organ dose category
Taking into consideration that estimates of ERR/Gy are susceptible to dose category, 14 dose groups (0, >0, 0.8–, 1.6–, 2.4–, 4–, 6–, 8–, 12–, 16–, 20–, 40–, 80– and 160+ mGy)—hereinafter called adjusted dose category—which had cut-off points 0.8 times the size of those of the dose category described in section 2.5.2, were temporarily applied in model (2). The estimated ERR/Gy of 1.09 (−0.47, 2.89) without the smoking adjustment decreased to 0.41 (−1.02, 2.09) with the smoking adjustment, but still demonstrated a decreasing tendency (table 6). The width of the CI of the ERR without the smoking adjustment in the highest dose group did not differ greatly, whether the dose unit was mSv or mGy. The ERR was 0.41 (−0.11, 0.93) at 261.9 mSv for the highest dose group of 200+ mSv in the previous study and 0.47 (−0.04, 1.16) at 197.3 mGy for the 160+ mGy group using the adjusted dose category, because the distribution of the observed deaths by the adjusted dose category in mGy was almost the same as in mSv. Regardless of the dose category, the decreasing trend in the ERR/Gy with the smoking adjustment remained.
Table 6. ERR/Gy and ERR by dose category for all cancers excluding leukaemia for the subcohort of the J-EPISODE with follow-up in 1999–2010 with/without the smoking adjustment using colon absorbed dose when adjusted dose category was applied.
| Observed death | Without smoking adjustment | With smoking adjustment | ||
|---|---|---|---|---|
| All cancers excluding leukaemia | 1,326 | ERR/Gy and 90% CI 1.09 (−0.47, 2.89) | ERR/Gy and 90% CI 0.41 (−1.02, 2.09) | |
| Adjusted Dose category | Mean dose | Observed death | ERR and 90% CI | ERR and 90% CI |
| 0 mGy | 0.0 mGy | 313 | 0.00 | 0.00 |
| >0 | 0.3 | 175 | −0.00 (−0.15, 0.17) | −0.01 (−0.15, 0.16) |
| 0.8– | 1.2 | 49 | −0.15 (−0.35, 0.08) | −0.16 (−0.36, 0.07) |
| 1.6– | 2.0 | 34 | −0.07 (−0.32, 0.24) | −0.06 (−0.31, 0.25) |
| 2.4– | 3.1 | 63 | 0.12 (−0.11, 0.40) | 0.11 (−0.12, 0.39) |
| 4– | 5.0 | 66 | 0.34 (0.06, 0.67) | 0.31 (0.04, 0.63) |
| 6– | 7.0 | 42 | −0.07 (−0.30, 0.21) | −0.09 (−0.32, 0.18) |
| 8– | 9.9 | 104 | 0.09 (−0.10, 0.31) | 0.04 (−0.14, 0.26) |
| 12– | 13.9 | 80 | 0.17 (−0.06, 0.43) | 0.14 (−0.07, 0.40) |
| 16– | 17.9 | 57 | 0.18 (−0.08, 0.49) | 0.13 (−0.12, 0.42) |
| 20– | 28.4 | 153 | 0.17 (−0.01, 0.38) | 0.15 (−0.03, 0.35) |
| 40– | 56.3 | 129 | 0.32 (0.11, 0.57) | 0.27 (0.06, 0.51) |
| 80– | 108.8 | 43 | −0.16 (−0.37, 0.09) | −0.22 (−0.41, 0.01) |
| 160+ | 197.3 | 18 | 0.47 (−0.04, 1.16) | 0.34 (−0.13, 0.96) |
(1) The cut-off points of the adjusted dose category were set as 0.8 times the size of those of the dose category in table 5.(2) The CIs were based on the likelihood method.
3.6. Heterogeneity among the dose groups
The dose group of 15–20 mGy showed a relatively higher ERR, but the group greater than 100 mGy showed a lower ERR, even after the smoking adjustment (table 5). This trend was observed in both the whole cohort and the subcohort, as well as in many causes of deaths (not shown), suggesting that there unresolved heterogeneity might still exist among the dose groups in the J-EPISODE.
3.7. Association of smoking with cancer mortality
An association between smoking and lung cancer is one of the conditions of a confounder. By modifying model (2), we estimated the RRs and 90% CIs of the pack-years of smoking for lung cancer and all cancers excluding leukaemia by pack-years category (table 7). The RRs of lung cancer for smokers increased sharply over 30 pack-years. The lung cancer risk of current smokers with 30–50 pack-years, the proportion of which was the largest, was 5.4 times higher than that of non-smokers, whereas that of former smokers was 3.7 times higher. This result confirmed one of the requirements of confounding.
Table 7. RR and 90% CI of pack-years of smoking by pack-year category as the reference being non-smoker for all cancers excluding leukaemia and lung cancer for the subcohort of the J-EPISODE with follow-up in 1999–2010 using organ-absorbed dose.
| All cancers excluding leukaemia | Lung cancer | |||||
|---|---|---|---|---|---|---|
| Pack-year category | Mean pack-years | Number of partcipants | Observed death | RR and 90% CI | Observed death | RR and 90% CI |
| Non-smoker | 0 | 15 290 | 155 | 1 | 19 | 1 |
| Current smoker | ||||||
| >0 | 5.4 | 7494 | 21 | 2.21 (1.44, 3.40) | 3 | 3.89 (1.37, 11.00) |
| 10– | 12.1 | 4059 | 9 | 0.87 (0.49, 1.54) | 0 | — |
| 15– | 17.1 | 4403 | 43 | 2.40 (1.79, 3.22) | 7 | 2.92 (1.37, 6.22) |
| 20– | 22.1 | 4386 | 60 | 2.28 (1.76, 2.94) | 9 | 2.68 (1.36, 5.29) |
| 25– | 27.0 | 4129 | 68 | 1.99 (1.56, 2.54) | 11 | 2.57 (1.37, 4.84) |
| 30– | 37.7 | 12 063 | 340 | 2.27 (1.93, 2.67) | 99 | 5.38 (3.54, 8.16) |
| 50+ | 63.9 | 4963 | 258 | 3.01 (2.54, 3.57) | 82 | 7.61 (4.98, 11.62) |
| Former smoker | ||||||
| >0 | 5.2 | 3228 | 29 | 1.29 (0.84, 1.97) | 4 | 1.38 (0.47, 4.04) |
| 10– | 11.9 | 1922 | 26 | 1.38 (0.91, 2.09) | 4 | 1.67 (0.60, 4.66) |
| 15– | 17.1 | 1736 | 28 | 1.37 (0.93, 2.03) | 5 | 2.00 (0.80, 5.00) |
| 20– | 22.1 | 1590 | 42 | 1.87 (1.34, 2.61) | 5 | 1.73 (0.70, 4.27) |
| 25– | 26.9 | 1166 | 25 | 1.33 (0.91, 1.94) | 4 | 1.66 (0.64, 4.30) |
| 30– | 37.9 | 3382 | 125 | 1.89 (1.51, 2.36) | 32 | 3.74 (2.20, 6.37) |
| 50+ | 70.4 | 1924 | 97 | 2.09 (1.66, 2.63) | 35 | 5.76 (3.47, 9.54) |
The CIs were based on the Wald method.
4. Discussion
4.1. Improved accuracy of dosimetry
Akiba (2018) indicated that the strengths of the J-EPISODE were its accurate dosimetry and virtually complete mortality follow-up. Regarding the first point, because the ICRP (2007) recommends the use of organ-absorbed doses for assessing cancer risk in epidemiological cohort studies, the J-EPISODE developed organ-absorbed dose conversion factors from dosimeter readings to further improve accuracy of dosimetry and to facilitate international comparisons of risk estimates (Furuta et al 2020a, 2020b, 2021).
In constructing the organ-absorbed doses, the doses received by the workers in the present study were assumed to derive predominantly from photon doses in the energy range of 100–3000 keV. The possibilities of neutron and internal exposures were discussed by Furuta et al (2021), as was the uncertainty regarding photon dosimetry. Ultimately, the organ-absorbed dose reconstruction in the J-EPISODE ignored the neutron and internal exposure doses, if any.
4.2. Improved risk estimates by using the organ-absorbed dose
When over- or underestimates were found in the dose measurements, the risk estimates reflected such evaluation. In the IARC Three-Country Study including the United States, the UK and Canada, organ doses were constructed by overcoming the uncertainty in dosimetry (Fix et al 1997). The dose committee concluded that for solid cancers, the recorded dose and organ dose were compatible, but for leukaemia, the recorded dose overestimated the RBM absorbed dose by approximately 20%. Cardis et al (1995) evaluated the ERR/Sv for all cancers excluding leukaemia as is, which was computed using the recorded dose, but evaluated the risk of leukaemia to be 20% higher than the computed ERR/Sv. In the following 15-Country Study, organ-absorbed dose was used for the risk estimation. Regarding the effect of dose reconstruction on risk estimates in the INWORKS, the ERR/Gy for all cancers excluding leukaemia using colon doses was 0.48 (0.20, 0.79), while the ERR/Sv for the analysis using recorded photon doses was as low as 0.35 (0.14, 0.57) (Richardson et al 2015). The use of colon doses, which were also adjusted for errors, did not improve the fit of the model, but the comparison with the LSS became easier by using organ dose. In the subcohort of the J-EPISODE, the risk estimate for the model without the smoking adjustment using recorded doses increased from ERR/Sv 0.80 (−0.39, 2.19) to ERR/Gy 1.00 (−0.55, 2.82) when organ doses were used (table 3). This was a logical consequence of the fact that recorded doses were overestimated in terms of organ doses.
4.3. Smoking-adjusted radiation risk
As described in section 3.4, it was not surprising to see in table 3 that the ERR/Gy for cancer was slightly higher than the ERR/Sv based on recorded dose because the recorded dose was generally overestimated. However, for all cancers excluding leukaemia, when excluding lung cancer in the whole cohort and conducting smoking adjustment in the subcohort, the opposite trend may be seen. In the whole cohort, the lung-cancer-excluded ERR/Gy of 0.50 (−0.56, 1.56) in the present study was lower than the lung-cancer-excluded ERR/Sv of 0.66 (−0.18, 1.50) in the previous study for all cancers excluding leukaemia. This was because the risk estimate using organ doses (ERR/Gy 4.00 [1.81, 6.49]) for lung cancer, which accounted for 22% of the observed deaths, increased largely compared with that using the recorded dose case (ERR/Sv 3.15 [1.34, 4.96]) (table 3). Eventually, the results of excluding lung cancer in the present analysis showed a decrease from the previous study. In the subcohort, the smoking-adjusted ERR/Gy of 0.25 (−1.16, 1.92) in the present study for all cancers excluding leukaemia was slightly lower than the smoking-adjusted ERR/Sv of 0.29 (−0.81, 1.57) in the previous study. However, by comparing the smoking-adjusted risk in the subcohort between using recorded doses and organ doses for lung cancer (n = 319), stomach cancer (n = 218) and liver cancer (n = 138), which contributed largely to the number of deaths, the estimated risk value moved away from 0 for lung cancer (from ERR/Sv 0.94 [−1.24, 3.90] to ERR/Gy 1.56 [−1.15, 5.25]), stomach cancer (from −0.20 [−2.94, 2.55] to −0.70 [−3.74, 3.87]) and liver cancer (from 3.89 [−2.94, 2.55] to 4.05 [−1.50, 12.39]), respectively (REA 2015; table 4). The trend by cancer site was not necessarily the same as that for all cancers excluding leukaemia. Therefore, the decrease found in all cancers excluding leukaemia may be coincidental.
4.4. Indirect validation of smoking as a confounder by excluding lung cancer
All cohort studies were concerned about smoking as a possible confounder, but because of the few cohorts with information on smoking status, an indirect method was used to examine the possibility of smoking as a confounder by excluding lung cancer from all cancers (table 8). In the 15-Country Study, the ERR/Sv 0.97 (0.27, 1.80) for all cancers excluding leukaemia decreased to 0.59 (−0.16, 1.51) when lung and pleura cancers were excluded (Cardis et al 2007). This tendency was similar to the J-EPISODE. In the subcohort of the J-EPISODE, the ERR/Gy for all cancers excluding leukaemia without the smoking adjustment was 1.00 (−0.55, 2.85), whereas that for all cancers excluding leukaemia and excluding lung cancer without the smoking adjustment was 0.51 (−1.20, 2.56). On the contrary, in the INWORKS, the ERR/Gy for solid cancers was 0.47 (0.18, 0.79) and solid cancers excluding lung cancer also had an ERR/Gy of 0.46 (0.11, 0.85), which were essentially the same value (Richardson et al 2015). Therefore, they concluded that the values suggested no confounding by smoking in the INWORKS. However, the difference in these results when lung cancer was excluded was considered to be due to the magnitude of the ERR for lung cancer. In the INWORKS, the ERR/Gy for lung cancer was 0.51 (0.00, 1.09) (Richardson et al 2017), which was almost the same as that for solid cancers. On the contrary, in the 15-Country Study, the ERR/Sv for lung cancer was 1.86 (0.49, 3.63), which was almost twice greater than that for all cancers excluding leukaemia (Cardis et al 2007). In the subcohort of the J-EPISODE, the ERR/Gy for lung cancer without the smoking adjustment was 3.09 (−0.11, 7.34), almost three times greater than that for all cancers excluding leukaemia.
Table 8. Indirect validation of smoking confounding by excluding lung cancer from all cancers excluding leukaemia.
| Cause of cancer death | Observed deaths | Radiation risk | |
|---|---|---|---|
| 15-Country Collaborative Study | |||
| Cardis et al (2007) | ERR/Sv and 90% CI | ||
| All cancers (ca) excluding leukaemia | 5024 | 0.97 (0.27, 1.80) | |
| All ca excluding leukaemia and excluding lung ca and pleura ca | 3528 | 0.59 (−0.16, 1.51) | |
| Lung ca | 1457 | 1.86 (0.49, 3.63) | |
| Pleura ca | 39 | 5.28 (<0, 39.9) | |
| INWORKS | |||
| Richardson et al (2015, 2017) | ERR/Gy and 90% CI | ||
| All ca excluding leukaemia | 19 064 | 0.48 (0.20, 0.79) | |
| Solid ca | 17 957 | 0.47 (0.18, 0.79) | |
| Solid ca (simple model a ) | 17 957 | 0.37 (0.14, 0.62) | |
| Solid ca excluding lung ca | 12 155 | 0.46 (0.11, 0.85) | |
| Solid ca excluding lung ca (simple model) | 12 155 | 0.35 (0.07, 0.65) | |
| Lung ca | 5802 | 0.51 (0.00, 1.09) | |
| The subcohort of the J-EPISODE with the | |||
| smoking adjustment using organ dose | ERR/Gy and 90% CI | ||
| All ca excluding leukaemia | 1326 | 0.25 (−1.16, 1.92) | |
| All ca excluding leukaemia without smoking adjustment | 1326 | 1.00 (−0.55, 2.85) | |
| All ca excluding leukaemia with DOE b adjustment | 1326 | 0.76 (−0.86, 2.71) | |
| All ca excluding leukaemia and excluding lung ca without smoking adjustment | 1007 | 0.51 (−1.20, 2.56) | |
| Lung ca | 319 | 1.56 (−1.15, 5.25) | |
| Lung ca without smoking adjustment | 319 | 3.09 (−0.11, 7.34) | |
| Lung ca with DOE adjustment | 319 | 4.05 (0.19, 9.60) | |
| French combined cohort | |||
| Metz-Flamant et al (2013) | ERR/Sv and 90% CI | ||
| All solid ca | 2312 | 0.34 (−0.56, 1.38) | |
| All solid ca without SES c adjustment | 2312 | 1.47 (0.40, 2.67) | |
| Lung ca | 585 | 1.20 (−0.63, 3.55) | |
| UK updated third NRRW | |||
| Haylock et al (2018) | ERR/Sv and 90% CI | ||
| All ca excluding leukaemia | 11 329 | 0.29 (0.06, 0.53) | |
| All ca excluding leukaemia and excluding lung ca and pleura | 8114 | 0.37 (0.11, 0.65) | |
| Ca from tracher, bronchus and lung | 3058 | 0.03 (−0.38, 0.51) | |
| Pleura ca | 157 | 1.06 (−0.96, 5.21) | |
| Pooled U.S. cohort | |||
| Schubauer-Berigan et al (2015) | ERR% per 10 mSv and 95% CI d | ||
| All ca excluding leukaemia | 10 877 | 0.14 (−0.17, 0.48) | |
| Lung ca | 3514 | 0.07 (−0.43, 0.66) | |
| Smoking-related ca excluding leukaemia | 6950 | −0.08 (−0.43, 0.32) | |
a Adjusted only for country, age, sex and birth cohort. b Duration of employment. c Socioeconomic status. d Based on total (gamma, neutron and tritium) dose.
Despite the uniformity of the ERRs/Gy by cancer site in the INWORKS results, the country cohorts of France, the UK and the United States displayed different results from that of the pooled cohort, although differences in the facilities included and observation periods were found. In the French combined cohort that consisted of the Commissariat à l'Energie Atomique (CEA), AREVA Nuclear Cycle (AREVA NC) and Electricité de France (EDF), the ERR/Sv for all solid cancers was 0.34 (−0.56, 1.38), which is positive but not significant, whereas that for lung cancer was 1.20 (−0.63, 3.55) (Metz-Flamant et al 2013). The result after excluding lung cancer was not shown, but might be decreased. In the main analyses, socioeconomic status (SES) was adjusted, partially considering smoking habits. When SES was not adjusted, the ERR/Sv for all solid cancers increased to 1.47 (0.40, 2.67). In the pooled U.S. cohort from five facilities, namely Hanford, Idaho National Laboratory (INL), Oak Ridge National Laboratory (ORNL), Portsmouth Naval Shipyard (PNS) and Savannah River Site (SRS), the ERR% per 10 mSv and 95% CI for all cancers excluding leukaemia was 0.14 (−0.17, 0.48), which was positive but not significant, whereas that for lung cancer was 0.07 (−0.43, 0.66) (Schubauer-Berigan et al 2015). The results of a study on chronic obstructive pulmonary disease (COPD), which is highly influenced by smoking, indicated that confounding by smoking may be positive in Hanford and ORNL and negative in INL, PNS and SRS. A strong healthy worker survival effect (HWSE) was also identified as a feature of the pooled cohort, but the adjusted increase in ERR in HWSE was highest for smoking-related cancers. In the main analysis, SES (first job title) and duration of employment (DOE) were used as adjustment variables, which may have partially adjusted for the smoking effect along with HWSE. In the UK updated third analysis of National Registry for Radiation Workers (NRRW), including the Ministry of Defence, British Nuclear Fuels (BNFL), UK Atomic Energy Authority (UKAEA), British Energy Generation and Magnox Electric and Atomic Weapons Establishment, the ERR/Sv of 0.37 (0.11, 0.65) for all cancers excluding leukaemia and excluding lung and pleura cancers increased from 0.29 (0.06, 0.53) for all cancers excluding leukaemia (Muirhead et al 2009, Haylock et al 2018). Considering the low estimate of 0.03 (−0.38, 0.51) for lung cancer, some negative confounding effect of smoking on radiation risk estimates was indicated. The results indicate that when examining smoking as a confounder, not only smoking adjustment but also the relationship with other risk factors such as adjustment variables, that is, stratification variables, should be fully considered in the model.
4.5. Possible healthy worker survivor effects
The INWORKS estimated the risk in the main analysis by adding SES related to job, DOE and neutron monitoring status as adjustment variables to the simple model that adjusted only for country, age, sex and birth cohort. Possible confounding by SES and DOE was also examined by excluding each variable from the model. The results suggested that job position positively confounded the results but DOE negatively confounded the results because of HWSE (Cardis et al 2007, Richardson et al 2015). The estimated ERR/Gy for solid cancers from the simple model was 0.37 (0.14, 0.62), and that for solid cancers excluding lung cancer was 0.35 (0.07, 0.65), whereas the estimates from the fully adjusted model were 0.47 (0.18, 0.79) and 0.46 (0.11, 0.85), respectively (table 8), indicating that the net adjustment effect by SES and DOE was small (Richardson et al 2015). This may be due to the offsetting of the positive confounding by job position and negative confounding by DOE. As the J-EPISODE lacks information on job position, we could not conduct an analysis with both SES and DOE as adjustment variables under the same condition as that in the INWORKS. Even though interpretation of the risk estimates is difficult, the results when only DOE was adjusted are presented in table 9. The DOE-adjusted risk estimates of 0.76 (−0.86, 2.71) largely increased compared with the DOE-non-adjusted estimates of 0.25 (−1.16, 1.92), which suggests that DOE is a negative confounder. These results were similar with those obtained using recorded dose in the study of Kudo et al (2018). The third lifestyle survey, conducted between 2015 and 2019, added SES-related questions on employer type, company size, job type and final job position to allow for a more detailed analysis of confounding factors.
Table 9. ERR/Gy and 90% CI by cause of death for the subcohort of the J-EPISODE with follow-up in 1999–2010 using organ-absorbed doses when the duration of employment was added as the adjustment variable in the model.
| Without smoking adjustment | With smoking adjustment | |||
|---|---|---|---|---|
| Causes of death | ERR/Gy | 90% CI | ERR/Gy | 90% CI |
| All cancers (ca) excluding leukaemia | 1.78 [1.00] | (−0.04, 3.96) | 0.76 [0.25] | (−0.86, 2.71) |
| Ca of oral cavity and pharynx | 16.10 [6.66] | (−2.08, 59.66) | 12.75 [4.94] | (−3.9 b , 51.59) |
| Oesophageal ca | −1.42 [−1.08] | (−6.54, 3.70) a | −2.19 [−1.79] | (−6.60, 2.23) a |
| Stomach ca | −0.26 [0.15] | (−4.05 b , 5.07) | −1.25 [−0.70] | (−4.43 b , 3.36) |
| Colon ca | −3.16 [−3.17] | (−5.47, −0.85) a | −3.17 [−3.16] | (−3.81, −2.53) a |
| Rectum ca | 6.35 [3.25] | (−1.66, 22.40) | 5.30 [2.25] | (−2.12, 20.56) |
| Liver ca | 13.19 [5.44] | (3.31, 28.71) | 10.25 [4.05] | (1.47, 24.30) |
| Gallbladder ca | −0.37 [−0.15] | (−8.87, 8.12) a | −0.51 [−0.46] | (−8.71, 7.69) a |
| Lung ca | 6.29 [3.09] | (1.70, 12.76) | 4.05 [1.56] | (0.19, 9.60) |
| Prostate ca | −3.52 [−0.89] | (−8.68, 1.64) a | −3.51 [−0.76] | (−8.74, 1.72) a |
| Bladder ca | 23.76 [9.26] | (−28.20, 75.73) a | 26.91 [7.56] | (−31.30, 85.13) a |
| Ca of kidney and other urinary organs | 35.67 [24.11] | (−1.01, 144.7) | 36.92 [24.01] | (−1.02, 152.5) |
| Non-Hodgkin's lymphoma | 21.64 [16.32] | (3.17, 63.46) | 23.44 [17.01] | (3.82, 68.15) |
(1) Figures in bracket represent the ERR/Gy in table 4, where the duration of employment was not adjusted.(2) The CIs were based on the likelihood method. a Wald-based CI. b Last estimate is denoted because the ERRs did not converge.
4.6. Comparison of risk estimates with other studies
Richardson et al (2015) reported that the results of the INWORKS were statistically compatible with the LSS. The ERR/Gy and 90% CI for solid cancers was 0.47 (0.18, 0.79) in the INWORKS (table 8), whereas the ERR/Sv for men aged 20–60 years in the LSS was 0.32 with 95% CI 0.01–0.05. Furthermore, Leuraud et al (2021) emphasized that by restricting the comparison by using similar ages and follow-up periods, they found complementary results from different studies with ERR/Gy of 0.28 (0.18, 0.38) for the LSS and 0.29 (0.07, 0.53) for the INWORKS.
On the contrary, the results of the subcohort of the J-EPISODE were not statistically significant for all cancers excluding leukaemia (0.25 [−1.16, 1.92]) owing to the lack of person-years, but the point estimate of the ERR/Gy 0.25 was within the 90% CI 0.20–0.79 of ERR/Gy of 0.48 for all cancers excluding leukaemia in the INWORKS. Further accumulation of person-years of follow-up is expected for proper comparison.
5. Conclusion
The J-EPISODE established organ-absorbed doses from the recorded doses by using the organ dose reconstruction methods to improve the accuracy of dosimetry. The estimated ERRs/Gy for cancer mortality were consistent with the previous analysis results using Hp(10), indicating that the risk estimation using the organ-absorbed dose was applicable for the J-EPISODE. In the whole cohort, all cancers excluding leukaemia, lung cancer and non-Hodgkin's lymphoma had statistically significant positive ERR/Gy estimates; leukaemia excluding CLL had negative but not statistically significant estimates. Gallbladder cancer and pancreatic cancer showed statistically significant negative. The main features related to smoking as a confounder reported in the previous analysis remained unchanged. In the subcohort, for almost all causes of death such as lung cancer and stomach cancer, the estimated ERR/Gy decreased by the smoking adjustment, although those for the colon, prostate and kidney and other urinary organs were almost the same after the adjustment. These results indicate that confounding by smoking seriously biased the radiation risk estimate in the J-EPISODE and thus should be accounted for even if organ dose is used. The J-EPISODE will also use organ-absorbed doses to analyse the cancer incidence, which has become available.
Acknowledgments
This study was funded by the Nuclear Regulation Authority, Japan. The authors declare that they have no conflicts of interest associated with this manuscript. We thank all the members of the REA committees for their helpful suggestions and constructive discussions regarding this study. We also thank all those who supported the development and updating of the cohort. The study protocol was reviewed and approved by the Research Ethical Committee of the REA, based on the Ethical Guidelines for Medical and Health Research Involving Human Subjects established by the Ministry of Health, Labour and Welfare and the Ministry of Education, Culture, Sports, Science and Technology.