

Abstract
Radon is a radioactive gas which is naturally occurring in soil and can accumulate to concentrated levels inside homes and buildings. Exposure to elevated levels of radon leads to an increased risk of developing lung cancer. In recent years there has been a rise in the popularity of consumer-grade electronic radon monitors. The monitors are appealing to homeowners due to the ease of use and the ability to keep track of radon levels during the process of conducting a radon test. However, there is currently no independent process to evaluate the relative performance of these monitors against known levels of radon. In this study, three sample units of six different models representing three different manufacturers of consumer-grade electronic radon monitors were exposed to three different levels of radon in a controlled environment to evaluate their precision and accuracy. Two separate tests were conducted at the Canadian guideline level to accommodate for 'indoor winter' and 'summer' conditions. The purpose of the study was to compare the performance of the different consumer-grade electronic radon monitors and determine which factors should be considered when using these monitors to inform mitigation decisions. The monitors had a range of uncertainty from 2%–15% with a range of precision from 1%–24%. The monitors performed better at higher radon levels than at levels near the Canadian guideline level of 200 Bq m−3, and slightly better during 'summer' conditions than during 'indoor winter' conditions. While the monitors provide homeowners with a very specific number indicating their radon level, it was noted that this number should be considered with respect to a 'confidence ratio' or 'range' which could be done through a publicly available online tool which could provide the radon level range for a given radon level and device grade.
Export citation and abstract BibTeX RIS

Original content from this work may be used under the terms of the Creative Commons Attribution 4.0 license. Any further distribution of this work must maintain attribution to the author(s) and the title of the work, journal citation and DOI.
1. Introduction
Radon is a radioactive gas which is naturally occurring in soil and can accumulate to concentrated levels in homes and buildings due to the contact of these homes and buildings with the soil and to construction characteristics. Exposure to elevated levels of radon leads to an increased risk of developing lung cancer. Radon has been classified as a class 1 carcinogen by the International Agency for Research on Cancer (IARC) [1]. Canada, as well as many other countries, has developed an action plan for radon; wherein it has developed measurement guidelines [2, 3] and has recommended that all building owners test the air within their buildings for radon, and take appropriate action to reduce elevated radon levels to below the Canadian guideline level [4] of 200 Bq m−3, in order to protect occupants from radon exposure. Canada's guideline level is set by the federal government and includes recommendations to mitigate radon levels to as low as reasonably achievable. Once mitigation has occurred, a combination of short-term and long-term testing is recommended to confirm the effectiveness of the mitigation system.
The measurement guideline documents developed by Health Canada include recommended methods of testing in residential and public dwellings, including placement locations for testing in occupied areas and the use of long-term radon measurement devices that can accommodate a test duration of 91 d or longer. Long-term testing is typically completed using alpha track or electret ion detectors. Canada has a national certification program, the Canadian National Radon Proficiency Program (C-NRPP) which provides certification for radon measurement and mitigation professionals and a list of devices approved for use by certified radon professionals. Currently, the C-NRPP List of Approved Devices[5] includes passive alpha track, electret ion, and professional level continuous radon monitors.
Historically, if homeowners wanted to test their radon levels themselves their options were limited to ordering a long-term radon test kit and returning it to a processing laboratory via mail. In recent years there has been a rise in the popularity and the availability of consumer-grade electronic radon monitors. These monitors are not professional-grade continuous radon monitors used by radon professionals but are instead targeted at homeowners wanting to measure their own radon levels. Part of the appeal of these monitors seems to be the ability to begin tracking radon levels immediately, giving homeowners almost instant feedback compared to a passive detector which provides no information until a report is issued from the laboratory.
The tests conducted during this study were meant to assess the performance of the various consumer-grade electronic radon monitors currently available to the public. However, in addition to monitor performance and the measurement error, homeowners using electronic radon monitors should also be aware that radon levels are rarely stable. Radon levels inside a building are constantly fluctuating and are affected by many factors including outdoor temperature, indoor temperature, the amount of wind and its direction, whether any fans are running indoors, windows and doors opening and closing, barometric pressure variations, rainfall, and more.
Consumers have been seeking advice as to which electronic radon monitors provide the best performance or are otherwise best suited to their purposes. However, no comparative studies had been performed that included all the various monitors currently available in Canada, and there was no existing process to evaluate these monitors for precision and accuracy against known levels of radon. The manufacturers provide a user manual which includes statements of accuracy, but only one manufacturer provided a calibration certificate, typically each individual unit does not include any indication of quality control or accuracy testing. These units are not usually individually calibrated after purchase.
While Public Health England performs a regular InterComparison Study involving passive detectors [6], and the 2016 paper 'Inter-comparison of radon detectors for 1 to 4 week measurement periods' [7] compared a selection of different types of radon detectors with a focus on different durations, this research is focused solely on consumer-grade electronic radon monitors and their performance at various radon levels and different indoor conditions.
In order to provide Canadian consumers with an unbiased performance-based comparison of these monitors, the Canadian National Radon Proficiency Program (C-NRPP) developed a test procedure and conducted a series of performance tests. This paper presents the results of those tests.
2. Materials and method
Testing of the consumer-grade electronic radon monitors was performed at the Radiation Safety Institute of Canada (RSIC) National Radon Chamber; a C-NRPP reference radon chamber used for testing radon monitors in Canada. The 12 m3 walk-in radon chamber located in Saskatoon, Saskatchewan, Canada is an approved chamber facility for C-NRPP and is a certified secondary reference radon chamber under the American Association of Radon Scientists and Technologists (AARST) National Radon Proficiency Program (NRPP), certificate number SC 1005.
The radon chamber utilises two commercial NIST traceable Pylon Rn-1025 Radium-226 flow-through radon gas sources (87 kBq and 4.1 MBq). Radon gas is injected into the chamber and precisely controlled via an array of mass flow controllers. Within the radon chamber, air is circulated continuously using a fan system to ensure uniform radon concentrations throughout the chamber. Radon gas concentrations between 150 Bq m−3 and 500 000 Bq m−3 are achievable within the chamber.
Radon concentrations and environmental conditions within the chamber are measured hourly using a Saphymo AlphaGuard DF2000 continuous radon monitor. Radon concentrations in the chamber are checked independently using grab sampling with Pylon scintillation cells. To ensure traceability, inter-comparison tests are performed annually with the Bowser-Morner Radon Chamber in Dayton, Ohio, United States of America.
Temperature and humidity within the chamber are controlled using independent heaters and humidifiers.
The C-NRPP purchased three of each consumer-grade electronic radon monitor listed in table 1. The monitors listed in table 1 represent all the consumer-grade electronic radon monitors that were available for purchase by Canadian consumers as of March 2019.
Table 1. Consumer-grade electronic radon monitors included in the study.
| Manufacturer | Model | Features |
|---|---|---|
| Safety Siren [8] | Pro Series 3 |
|
| AIRTHINGS [9] | Corentium Home |
|
| AIRTHINGS [10] | 2900 Wave |
|
| AIRTHINGS [11] | Wave Plus |
|
| Radon Eye [12] | Radon Eye Plus |
|
| Radon Eye [13] | Radon Eye RD200 |
|
Whenever possible, C-NRPP ordered one monitor of each type from a large online retailer, and two other monitors from two different regional suppliers. The online retailer was chosen because of its accessibility to Canadians in all areas of the country. Retailers were selected from as many different geographic locations as possible.
All the radon monitors were shipped unopened to the Radiation Safety Institute of Canada (RSIC) National Radon Chamber in Saskatoon, Saskatchewan, Canada.
Prior to exposing the consumer-grade electronic radon monitors under the testing protocol, RSIC staff inventoried each radon monitor, logging the make, model, and serial numbers. They inspected each monitor for any visible damage that may have occurred during shipping, reviewed the operating manual for each monitor and downloaded any required applications and connected to each monitor in order to verify the functioning of each monitor. Any radon monitors that appeared to have been damaged during shipment or did not appear to be operating properly during the initial inspection would have been replaced prior to inclusion in the study. This was not necessary as all the monitors passed the inspection.
Four different test scenarios were chosen. Two sets of test conditions were developed at 200 Bq m−3 since this is the Canadian radon guideline level, and the data provided by these monitors is used by consumers to inform their mitigation decision. The temperature and relative humidity for these two sets of test conditions were meant to approximate typical indoor conditions in Canadian homes during winter and summer (the summer conditions representing homes with either no air conditioning or limited air conditioning). The third and fourth sets of conditions were chosen to be at 400 Bq m−3 and 1000 Bq m−3 to test the instrument performance across a range of radon levels at temperature and relative humidity conditions consistent with Round 1.
2.1. Ambient levels check—national laboratories
- RSIC National Laboratories ambient radon concentrations: 20–30 Bq m−3
- Temperature: 21 °C–22 °C
- Humidity: 20%–30% RH
- Duration: 7 d
During the ambient levels check, the consumer-grade electronic radon monitors' measurements were compared against co-located calibrated C-NRPP-approved continuous radon monitors. This test was intended as a general check on the operation of the monitors. All monitors involved in the study passed the ambient check with average radon levels reporting between 24 and 29 Bq.
During testing, all monitors were placed in the National Radon Chamber and exposed simultaneously to the same radon concentrations and environmental conditions. Monitors were spaced apart a minimum of 10 cm.
The radon monitors included in the study are listed in table 1. The table lists specifications including the manufacturer's claimed accuracy, and the measurement technology and detection method used by each monitor.
Performance evaluation of the devices was based the Performance Classification Scheme used by Public Health England in their 'PHE Inter-comparison of Passive Detectors' [6]. For each model of radon monitor tested, the following performance data was calculated:
- Accuracy—relative percent error between the average radon concentration measured by each monitor and the radon chamber reference radon concentration
- Precision—relative standard deviation for the results measured for each model of individual radon monitor tested
Accuracy

Precision

From the calculated relative percent error and relative standard deviation for each monitor, an overall percentage of measurement error was calculated.
Percentage of measurement error

Measurement error was used as a measure of performance because it includes consideration for variations in both precision and accuracy. In order to provide a simple reporting format that will allow consumers to compare the performance of different monitors, each monitor type was assigned a grade based on its measurement error during each of the test conditions. The grades are listed in table 2 and a summary of all the results is presented in table 4.
Table 2. Radon monitor performance classification grades.
| Measurement error (%) | Performance grade |
|---|---|
| ⩽10 | A |
| >10 and ⩽20 | B |
| >20 and ⩽30 | C |
| >30 and ⩽40 | D |
| >40 | E |
3. Results and analysis
Since 200 Bq m−3 is the Canadian guideline level, the performance of the consumer-grade electronic radon monitors is of utmost importance in this range as the data provided is often used to inform consumers' decisions to mitigate their homes. It is for this reason that two sets of test conditions were developed at 200 Bq m−3. The two sets of test conditions were meant to approximate typical indoor conditions in Canadian homes during winter and summer (the summer conditions representing homes with either no air conditioning or limited air conditioning).
The AlphaGuard DF2000 was used as the reference monitor and the margin of error reported was generated automatically by the monitor through the accompanying control software, DataView Pro. Calculated measurement uncertainties are directly related to radiation counting statistics. The lower the concentration, the lower the number of counts per minute, and the higher the counting uncertainty. The AlphaGuard has ±3% calibration error against a primary standard and is linear to within ±3% over its operating range.
The results for each set of test conditions are presented in the same way. Each type of monitor is presented as a cluster of three columns; one column for each of the three individual units tested. The closer the three columns are in height to one another, the more precise the measurements were among the three units of each type of monitor. The horizontal band on each chart indicates the radon level in the chamber during the test, with the width of the band representing the calculated uncertainty for the reference monitor.
3.1. Round 1
The conditions inside the radon test chamber during round 1 are a reasonable approximation of the conditions inside a Canadian home during the winter.
- Radon concentration target: 200 Bq m−3
- Average radon concentration measured: 206 ± 28 Bq m−3
- Temperature: 18 °C–22 °C
- Relative Humidity: 20%–50% RH
- Duration: 7 d
The average radon concentration achieved during Round 1 of testing was measured using the AlphaGuard DF2000 reference system. While there were fluctuations over the course of seven days of testing, the average concentration achieved was 206 ± 28 Bq m−3. This average concentration and the calculated uncertainty are shown in figure 1 using the placement and width of the horizontal blue band.

Figure 1. Radon measurements reported during Round 1 of testing.
Download figure:
Standard image High-resolution imageAs can be observed in figure 1, eight individual units across four different monitor types measured the radon levels in the chamber above the actual radon level. While one device type had two units measuring lower in the range, no devices measured below the actual radon levels.
The performance grades assigned for round 1 are listed in table 4.
3.2. Round 2
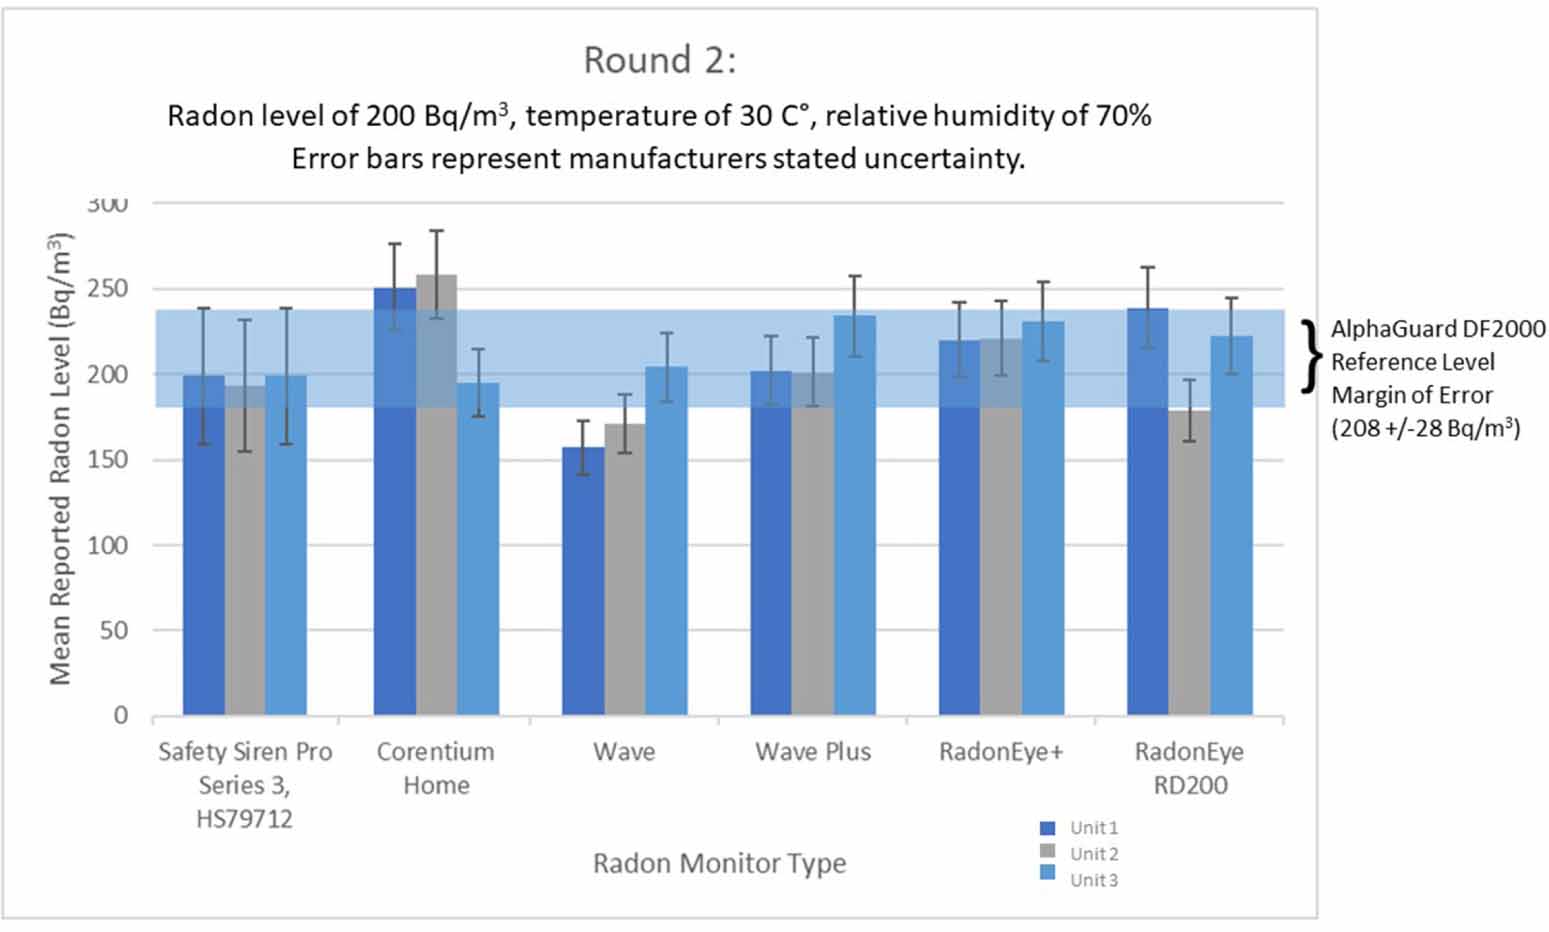
The conditions inside the radon test chamber during round 2 were a reasonable approximation of the conditions inside a Canadian home during the summer, provided the home is not equipped with air conditioning. Air conditioning systems not only cool the air inside a home; they also reduce the humidity. The conditions inside homes with air conditioning will therefore be closer to the conditions inside the radon test chamber during round 1 all year round.
- Radon concentration target: 200 Bq m−3
- Average radon concentration measured: 208 ± 28 Bq m−3
- Temperature: 30° C
- Relative Humidity: 70% RH
- Duration: 7 d
The average radon concentration achieved during Round 2 of testing was measured using the AlphaGuard DF2000 reference system. While there were fluctuations over the course of seven days of testing, the average concentration achieved was 208 ± 28 Bq m−3. This average concentration and calculated uncertainty are shown in figure 2 using the placement and width of the horizontal blue band.

Figure 2. Radon measurements reported during Round 2 of testing.
Download figure:
Standard image High-resolution imageAs can be observed in figure 2, three individual units across two monitor types measured the radon levels in the chamber below the actual radon level, and three individual units across two monitor-types measured radon levels above.
In comparing figure 2 to figure 1, there is a marked difference in the reported radon levels for several of the monitors. Given that the radon level inside the chamber remained consistent between Round 1 and Round 2, it would appear that the changes in temperature and relative humidity affected several of the monitors.
Under-reporting the radon level is of particular concern when using consumer-grade electronic radon monitor, since this can lead to a false sense of security for the homeowner. The performance grades assigned for round 2 are listed in table 4.
3.3. Round 3
In the third round of testing, the radon level was raised to 400 Bq m−3, while temperature and humidity were 18 °C–22 °C and 20%–50% RH respectively, just as they were in Round 1.
- Radon concentration target: 400 Bq m−3
- Average radon concentration measured: 410 ± 42 Bq m−3
- Temperature: 18 °C–22 °C
- Relative Humidity: 20%–50% RH
- Duration: 7 d
The average radon concentration achieved during Round 3 of testing was measured using the AlphaGuard DF2000 reference system. While there were fluctuations over the course of seven days of testing, the average concentration achieved was 410 ± 42 Bq m−3. This average concentration and calculated uncertainty are shown in figure 3 using the placement and width of the horizontal blue band.

Figure 3. Radon measurements reported during Round 3 of testing.
Download figure:
Standard image High-resolution imageAs can be observed in figure 3, two individual units from the same monitor type measured the radon levels in the chamber below the actual radon level, and eleven units across five monitor types measured above.
The performance grades assigned for round 3 are listed in table 4.
3.4. Round 4
In the fourth round of testing, the radon level was raised to 1000 Bq m−3, while temperature and humidity remained at 18 °C–22 °C and 20%–50% RH respectively.
- Radon concentration target: 1000 Bq m−3
- Average radon concentration measured: 1075 ± 79 Bq m−3
- Temperature: 18 °C–22 °C
- Relative humidity: 20%–50% RH
- Duration: 7 d
The average radon concentration achieved during Round 4 of testing was measured using the AlphaGuard DF2000 reference system. While there were fluctuations over the course of seven days of testing, the average concentration achieved was 1075 ± 79 Bq m−3. This average concentration and calculated uncertainty are shown in figure 4 using the placement and width of the horizontal blue band.

Figure 4. Radon measurements reported during Round 4 of testing.
Download figure:
Standard image High-resolution imageThe performance grades assigned for round 4 are listed in table 4.
Figures 1 through 4 provide a visual representation of the accuracy and precision of each monitor type during each round of testing. The measurement error and corresponding performance grade of each type of monitor was also calculated for each set of conditions; as summarised in table 4 below.
3.5. Analysis
For homeowners, using a consumer-grade electronic radon monitor to measure the radon levels in their home is a very different experience than using a passive long-term radon detector, which has historically been the most accessible homeowner testing option. While an electronic monitor can be a helpful tool, it is important to understand its limitations. In considering the results of this research, communicating the implications of measurement error to homeowners was found to be of primary importance.
It is important to consider the measurement error when interpreting the radon level reported by a consumer-grade electronic radon monitor. This is a new element for homeowners to consider, since for decades the only radon measurement options for homeowners were to use a passive long-term radon detector and return it to a laboratory for analysis, or to hire a radon measurement professional. With either of these options, homeowners receive a written report that clearly indicates the margin of error. Now, when using an electronic radon monitor, the margin of error is easily ignored since the radon monitors displays a very specific number without displaying any calculated uncertainties.
While the margin of error may not commonly be considered, it can make an important difference in the reported radon level and the associated perception of risk, especially near the Canadian guideline level of 200 Bq m−3. As illustrated in figure 5, if a monitor were to indicate a radon level of 185 Bq m−3, a homeowner might easily feel reassured that the radon level is comfortably below Canada's guideline level of 200 Bq m−3. However, even if this monitor had scored a grade of A (as defined in table 3 of this paper), it would mean that the margin of error could be up to plus or minus 10%. Considering that 10% of 185 Bq m−3 is 18.5, when taking that margin of error into account, the monitor is in fact reporting that the radon level is between 166.5 Bq m−3 and 203.5 Bq m−3.

Figure 5. Visual illustration of range due to measurement error for each performance grade at a given radon level.
Download figure:
Standard image High-resolution image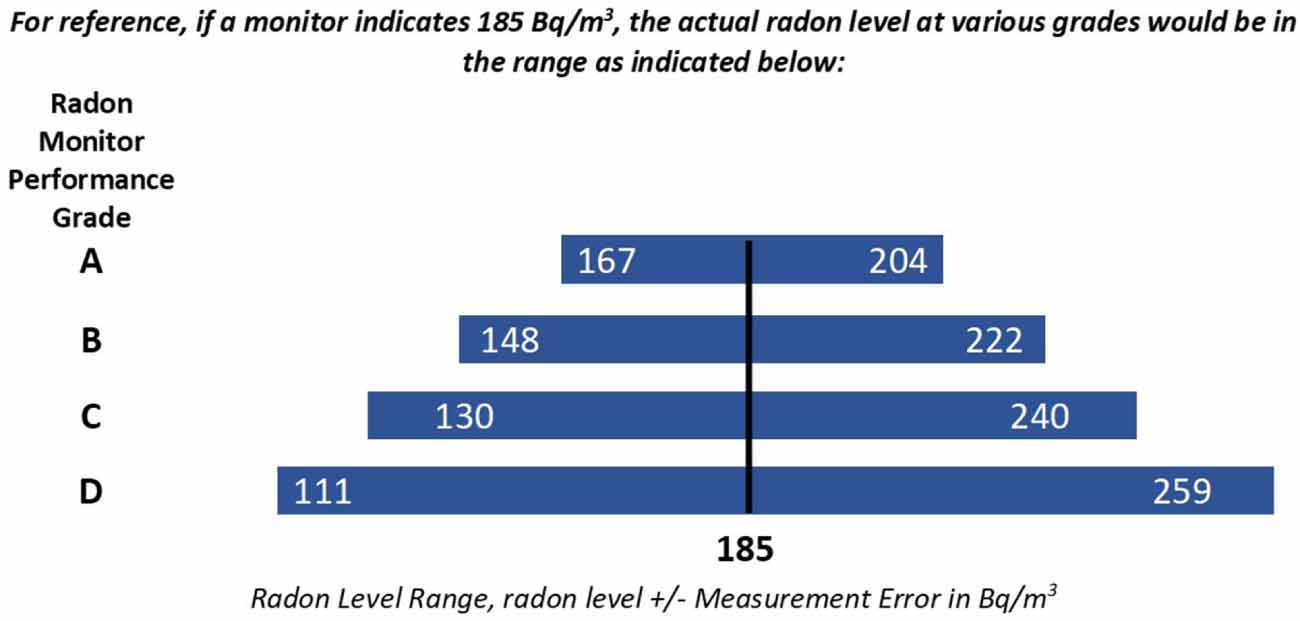
Table 3. Summary of performance grades.
| Performance | Performance | Performance | Performance | ||
|---|---|---|---|---|---|
| Manufacturer's | Monitor | grade for | grade for | grade for | grade for |
| name | name | Round 1 | Round 2 | Round 3 | Round 4 |
| Safety Siren | Pro Series 3 | B | A | B | B |
| Airthings | Corentium Home | A | B | A | A |
| Airthings | 2900 Wave | C | C | B | A |
| Airthings | Wave Plus | C | A | C | B |
| Radon Eye | Radon Eye Plus | B | A | B | B |
| Radon Eye | Radon Eye RD200 | B | B | B | B |
Table 4. Summary of statistical variances.
| Performance at 200 Bq m−3 | Performance at 200 Bq m−3 | Performance at 600 Bq m−3 | Performance at 1000 Bq m−3 | ||||||||||
|---|---|---|---|---|---|---|---|---|---|---|---|---|---|
| Round 1 | Round 2 | Round 3 | Round 4 | ||||||||||
| Manufacturer | Monitor name | Relative standard deviation (%) Accuracy | Relative percent error (%) Precision | Measurement error (%) | Relative standard deviation (%) Accuracy | Relative percent error (%) Precision | Measurement error (%) | Relative standard deviation (%) Accuracy | Relative percent error (%) Precision | Measurement error (%) | Relative standard deviation (%) Accuracy | Relative percent error (%) Precision | Measurement error (%) |
| Safety Siren | Pro Series 3 | 5.53 | −8.65 | 10.26 | 1.76 | −5.45 | 5.73 | 6.78 | −11.02 | 12.94 | 5.96 | −9.29 | 11.04 |
| Airthings | Corentium Home | 4.95 | 0.08 | 4.95 | 14.71 | 12.63 | 19.39 | 6.99 | 5.64 | 8.98 | 2.02 | 7.04 | 7.33 |
| Airthings | 2900 Wave | 4.81 | 22.24 | 22.75 | 13.61 | −14.89 | 20.17 | 3.76 | 18.72 | 19.09 | 2.35 | 8.53 | 8.85 |
| Airthings | Wave Plus | 9.27 | 24.01 | 25.74 | 8.84 | 1.91 | 9.04 | 6.98 | 20.75 | 21.89 | 2.78 | 10.30 | 10.67 |
| Radon Eye | Radon Eye Plus | 3.08 | 11.73 | 12.12 | 2.72 | 7.51 | 7.98 | 3.68 | 13.93 | 14.40 | 2.97 | 13.71 | 14.03 |
| Radon Eye | Radon Eye RD200 | 7.21 | 11.4 | 13.49 | 14.5 | 2.39 | 14.69 | 7.31 | 8.40 | 11.13 | 7.43 | 15.10 | 16.83 |
| Highest | 9.27 | 24.01 | 14.71 | 14.89 | 7.31 | 20.75 | 7.43 | 15.10 | |||||
| Lowest | 3.08 | 0.08 | 1.76 | 1.91 | 3.68 | 5.64 | 2.02 | 7.04 | |||||
| Mean | 5.48 | 6.06 | 7.05 | 5.72 | 5.68 | 11.89 | 3.47 | 10.29 | |||||
| Median | 5.24 | 11.57 | 11.23 | 6.48 | 6.88 | 12.48 | 2.88 | 9.80 | |||||
It is worth noting that none of the consumer-grade electronic radon monitors included in this study scored a grade of A during both Round 1 and Round 2, which were the two sets of test conditions at the Canadian guideline level of 200 Bq m−3. Therefore, when considering figure 5, the range of radon levels as indicated by Grade B is probably the most realistic starting point for most applications near the guideline level of 200 Bq m−3.
Once again, when compared to the more traditional radon measurement method of installing a long-term passive radon detector and returning it to the laboratory for a report after three months' time, the fluctuation of radon levels is more of a concern for the homeowner using an electronic radon monitor because these monitors provide readings within hours or days rather than months.
When looking at a digital read-out, it can be alarming to see a sudden spike in radon levels. It is important for homeowners to understand that while radon levels may occasionally spike upwards or dip downwards, it is the average annual exposure level that is a concern. Health Canada recommends that homeowners base any decision to mitigate their home on a long-term average radon level, which is determined by testing for 91 d or more. Most of the digital monitors reviewed in this study display the average radon level over a given time period in addition to the 'current' radon level. However, since the electronic radon monitors begin to report a radon level within minutes, hours, or days, homeowners may now be increasingly tempted to base decisions on shorter testing periods.
Those homeowners who do make decisions based on shorter testing periods will fall into one of three categories: those whose short-term radon test is higher than their annual average, those whose short-term radon test is indicative of their annual average, and those whose short-term radon test is lower than their annual average. The risk to the first group of homeowners is that they decide to install a radon mitigation system even though this system may not have been judged necessary were the annual average radon level known. The second group have, purely by chance, gained a representative measure of their annual average radon level, though they have no way of knowing this before completing a long-term test. The third group is the group most at risk, because they risk concluding that their annual average radon levels are below the guideline level, when in fact this in not the case.
Without further research, it is impossible to know for sure how many homeowners consider their homes to have a 'safe' radon level after any given short-term testing period using an electronic radon monitor indicating below the Canadian guideline level. It might seem natural to assume that any homeowner who has made the investment in a consumer-grade electronic radon monitor will leave it in place for at least a three-month period as recommended by Health Canada. However, a growing number of Canadian homeowners are not purchasing these consumer-grade electronic radon monitors but are instead borrowing them from a library or other loan program [14]. These loan programs inherently lead almost exclusively to one-time, short-term testing, as the loan period rarely extends to three months. In addition, the loan period may occur any time throughout the year given that the borrowers can only obtain the device during the season when their turn comes up on the waiting list [15]. Given these considerations, more research into the effectiveness of radon monitor loan programs is merited.
4. Conclusions
The main goal of this project was to assess the accuracy and precision of consumer-grade electronic radon monitors currently available to Canadians. Given that the acceptable range of error for professional-grade electronic radon monitors is 20%, the monitors in this project can be considered to have performed quite well, with the lowest grade achieved by any monitor during any round of testing being a C (>20 and ⩽30% measurement error).
While these test results are promising, it is important to remember that the monitors included in this study are still consumer-grade, rather than professional-grade. Professional-grade monitors are subjected to Quality Control programs that include annual calibration and cross-checks and are also required to have additional features that consumer-grade monitors do not possess [5].
One of the features of professional-grade monitors is the ability to be calibrated; either annually or at any other interval if a concern arises. In this project the tests were conducted on newly purchased monitors, and it is possible that accuracy and precision may change over the lifetime of the monitor. Since there exists no framework currently for calibration of these consumer-grade radon monitors, it will be important to determine how they perform over time. It is the intent of the authors to continue this project by keeping the monitors that were evaluated this year so that they may be re-evaluated next year, along with a selection of new monitors.
In closing, this study successfully measured the accuracy and precision of the various consumer-grade electronic radon monitors currently available to Canadian consumers. In considering the results of the performance testing and the potential implications of using these new monitors, the authors identified several areas of concern that may be addressed through further research and through the development of communication tools for consumers.