

Abstract
After the Fukushima accident, airborne monitoring was implemented to measure airborne radiation. We examined the relationships between airborne and individual radiation monitoring and clarified the use of airborne monitoring to evaluate the effects of decontamination on residents' received doses. We used the air dose rate data from four airborne monitors conducted between 2013 and 2016, and the dose data from four individual monitors (in which a total of 18 392 adults and 3650 children participated), conducted in Minamisoma City during the same period. We examined the Pearson correlation coefficients between the airborne and individual monitoring data and estimated exposure ratios (ERs; ratios of individual dose to air dose rates) among adults and children. We also estimated the effects of decontamination on residents' doses based on airborne monitoring data, adjusting this for timing and dosing through propensity score matching, which were then compared to individual monitoring data. There were significant correlations between airborne and individual monitoring doses among adults and children, and more than 80% of residents showed a good estimation–observation agreement within a factor of two. The median of ERs was 0.304 and 0.250 among adults and children, respectively. There was a significant difference between the two. Effects of decontamination on residents' doses estimated from airborne monitoring were significantly lower than those estimated from individual monitoring. These findings suggest that airborne monitoring can be used to estimate representative radiation doses within residential areas. It may be a useful tool for enhancing communication among stakeholders and supporting individual and policy decisions; however, it is less sensitive for evaluating individual effects of decontamination than individual monitoring. Combined use of airborne and individual monitoring also showed a lower median of ERs in children than in adults and in a Japanese government's model, possibly due to prioritised decontamination for children and differences between their behavioral patterns.
Export citation and abstract BibTeX RIS

Original content from this work may be used under the terms of the Creative Commons Attribution 3.0 licence. Any further distribution of this work must maintain attribution to the author(s) and the title of the work, journal citation and DOI.
Introduction
Dose assessment has an essential role in radiation protection and implementation of effective measures after a nuclear disaster. There are two approaches to dose assessment: Model estimation and individual dose monitoring. Model estimation for individual doses from external exposure generally requires detailed information of the temporal or spatial air doses or radionuclide concentrations in soils. Other factors that should be accounted for include, individual's length of stay inside and outside, shielding factor, and conversion factors for the dose absorbed from the air into the effective dose [1–5]. Individual doses of external exposure can be measured by personal dosimeters, such as glass badges, but demand participants' voluntary cooperation and willingness to be inconvenienced by the measurements [6–8].
After the Fukushima nuclear accident in 2011, the Japanese government launched a monitoring program for measuring the spatial and temporal air dose rates [9]. Data from airborne monitoring has been used for various purposes, such as decontamination plans or termination of evacuation orders as well as research, including estimation of the initial fallout from the plant [10]. To support decisions on decontamination measure and return policy, it is promising to establish a regression between air dose rates from airborne monitoring and individual doses.
In our previous study [11], we reported individual radiation doses from external exposure among 18 392 adults (≥18 years old) and 3650 children (<18 years old) in Minamisoma City, Fukushima prefecture (within 10–50 km north of the Fukushima Daiichi Nuclear Power Station), between 2013 and 2016 and also evaluated the effectiveness of the decontamination measures in reducing individual doses. Using the same data, in this study, we examined correlations between air dose rates from airborne monitoring and individual doses, and exposure ratios (ERs; ratios of individual doses to air dose rates) among adults and children. Such studies involving large samples are rare [12–14]. We also investigated whether airborne monitoring is useful in evaluating the effects of decontamination.
Materials and methods
Study site, period, and individual dose monitoring
Details of the study setting were described previously [11]. Briefly, the study site was Minamisoma City, where some areas were denoted as 'no-go' zones after the Fukushima accident and following the government's evacuation orders (figure S1(a)). This study targeted areas outside of the 'no-go' zone, where decontamination program was implemented from September 2012 through December 2016. The study period was between 2013 and 2016. Individual radiation doses from external exposure were measured for three months by personal dosimeters (hereafter referred to as a 'glass badge'). The output of the glass badge measurement corresponds to a personal dose equivalent to a tissue depth of 1 cm [Hp(10)] and can be regarded as a realistic indicator of the effective dose from external exposure following the Fukushima accident [15]. The doses from natural sources (i.e. the universe and ground, equivalent to 0.54 mSv y−1) were subtracted from the measurements by default. The detection limit was set at 0.2 mSv y−1. Participants whose doses exceeded 5 mSv y−1 (40 adults and no children) were excluded from the analysis because these values likely resulted from the improper use of the glass badge. We further excluded participants whose individual doses were less than detection limits (2112 adults and 527 children).
Airborne monitoring
Four time-series of air doses between 2013–2016 were obtained from publicly available data provided by the Nuclear Regulation Authority (figures S1(b)–(e)) [9]. The values represented the averages from the ∼600-m-diameter circles captured below the measuring aircraft on the final day of each survey period (i.e. November 19, 2013; November 7, 2014; November 4, 2015; and November 18, 2016), which represents the ambient dose (H*(10)). The doses from natural sources (i.e. the ground; 0.35 mSv y−1) were subtracted from the measured values. We aggregated the air dose rates at the Oaza level (an administrative municipal unit) using ArcMap (version 10.4) and district information based on the National Census 2010 [16]. District data with negative values after subtraction (2.3% of the sample) were excluded from the analysis.
Relationships between airborne and individual monitoring
We examined correlations between individual doses and air dose rates in the participants' residential areas among adults and children. Since airborne monitoring and individual dose monitoring were performed on different dates, the data of the airborne monitoring were corrected to correspond to the date of individual dose monitoring. This correction employed the following formula, taking into account the physical decay rate on the middle day of individual monitoring in a given year, using the formula [6]:

where,
D is air dose rate,
x1 is the final day of airborne monitoring,
x2 is the middle day of individual monitoring in the same year,
134Cs and 137Cs of the contribution to the additional external dose was 0.73:0.27 on the reference date of August 23, 2011,
λCs134 and λCs137 are the physical decay constants (0.000 9191 d−1 and 0.000 062 91 d−1 [17]),
d1 and d2 are days between August 23, 2011 and x1 or x2.
The air dose rates and individual doses were logarithmically transformed and rounded to one decimal place to display the number of participants in bubble charts. A Pearson correlation coefficient was calculated between the individual dose and air dose rates. We calculated the proportions of adults and children who showed agreements between observed and estimated values within a factor of 2.
We also investigated differences in the median values of ERs between adults and children using a quantile regression approach. A quantile regression expresses the conditional median of the outcome variable as a linear function of covariates. The ERs were then used as the outcome variable, while an explanatory variable included the age status (adult or children) in the model. Covariates included the year in which the monitoring was performed, as well as the interaction between the monitoring year and adult or child status because the participation distribution of adults/children differed among the monitoring years [11]. SPSS Statistics 24.0 and R version 3.5.0 [18, 19] were used for the statistical analyses.
Effects of decontamination on residents' doses
To evaluate the effects of decontamination on residents' doses, we estimated the dose reduction rate (DRR) between monitoring periods and one that ruled out the effects of physical decay (DRRw/o). The rate was based on airborne monitoring data, which were then compared between areas where decontamination statuses differed (i.e. Area 2 versus Areas 1 and 3: see details of the definitions of the areas in the supplementary text). We then estimated the dose reduction rate by decontamination (DRRdec) and compared this to individual monitoring data. Details of the estimation process of DRR and DRRw/o are described in the supplementary text.
Briefly, similar to our previous study [11], monitoring periods were divided into three periods: Period 1, 2013–2014; Period 2, 2014–2015; Period 3, 2015–2016. The exact start (t = 1) and end dates (t = 2) of Periods 1–3 differed slightly between this and the previous study; however, the overlap between the periods and years remained.
We calculated DRR and DRRw/o for each of the three periods. To minimise bias due to possible dose variations from natural sources, we considered only districts where the air dose rate (after the subtraction of natural sources [0.35 mSv y−1] and physical decay corrections) exceeded 0.35 mSv y−1; that is, we targeted the districts where the air dose rate, including natural sources, was more than twice the natural air dose rate level.
We used the Mann–Whitney U test to investigate the differences in DRR between areas with and without decontamination.
Periods and doses of exposure were adjusted to calculate DRRdec, because the effects of decontamination depend on them [11]. We adjusted the periods and doses at t = 1 which were logarithmically transformed using a propensity score matching technique [20]. The propensity score is the conditional probability of assignment to a particular treatment given a vector of observed covariates; it is used to find matched samples with a reduction of selection biases owing to covariates [20]. We used 1:1 nearest-neighbor matching with a ±0.1 caliper and no replacement. DRRdec was defined as the ΔDRRw/o of each matched pair (DRRw/o with decontamination minus DRRw/o without decontamination). We used Wilcoxon's matched-pairs signed-rank test to investigate the DRRw/o between pairs after matching. Finally, we used the Mann–Whitney U test to investigate any differences in DRRdec between airborne and individual monitoring.
We used R for the propensity score matching [21], and SPSS Statistics 24 for other analyses.
Ethical approval
Ethical approval for the study was granted by the ethics committee of Minamisoma Municipal General Hospital (30-09) and Fukushima Medical University (3065).
Results
Air dose rates were significantly correlated with individual doses among both adults and children (figures 1(a), (b); P < 0.001). Slopes were significantly lower than 1: i.e. 0.354 (95% confidence interval: 0.342–0.365) for adults and 0.302 (0.277–0.327) for children. About 81.4% of adults and 83.1% of children showed a good agreement between the observed and estimated values within a factor of 2. Median ERs were 0.304 and 0.250 for adults and children, respectively. About 90.1% of adults and 95.0% of children had lower ERs than the Japanese governmental model (0.6), that assumes outside stay of 8 h and a shielding effect of 0.4. Median ERs in adults were significantly higher than those in children after the adjustment of survey periods (table S1).

Figure 1. Correlation between air dose rates and individual doses. (a) Adults, (b) children. Circle areas are proportional to the number of participants. Dashed line represents a factor of 2 doses estimated from the regression. Gray bold line represents 0.6 of exposure ratios (ERs), based on the Japanese governmental model.
Download figure:
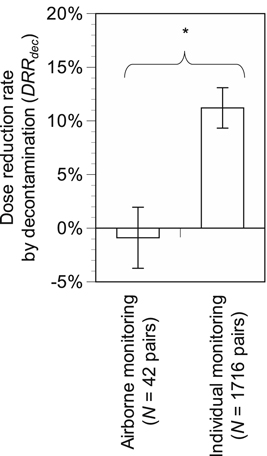
Standard image High-resolution imageThere were no significant differences in DRR estimated from airborne monitoring depending on decontamination (figures S2(a)–(c); P > 0.05). There were no significant differences, depending on decontamination, in DRRw/o estimated from airborne monitoring adjusted for the doses and periods (P > 0.05). In contrast, DRRw/o with decontamination estimated from individual monitoring was significantly higher than that without decontamination (P < 0.001). DRRdec estimated from individual monitoring was significantly higher than that from airborne monitoring (figure 2; P < 0.05).
Figure 2. Comparison in dose reduction rate by decontamination (DRRdec) between airborne and individual monitoring. Error bars represent standard errors. *P < 0.05.
Download figure:
Standard image High-resolution image
Discussion
This study revealed significant correlations between airborne and individual monitoring data for both adults and children. In addition, measurements from more than 80% of participants showed a good agreement between estimated and observed values within a factor of two. This is consistent with previous studies [12, 14], highlighting that airborne monitoring is useful at estimating representative doses within residential areas. While individual dose monitoring puts a burden on participants, airborne monitoring does not involve such inconveniences. Continuous airborne monitoring is suitable to deliver information on radiation doses that can support residents' and policy decisions
The ERs in this study were 0.304 and 0.250 for adults and children, respectively, comparable with or slightly higher than in previous studies [12–14]. Furthermore, these values were lower than the values proposed by the Japanese government model (0.6) used for lift of evacuation order and decontamination. More than 90% of participants showed ERs < 0.6, indicating that the Japanese government set conservative reduction factors. The difference between the observed values and the government's model may be attributable to multiple factors, including the length of stay inside and outside, shielding effects, and types of dose units (i.e. Hp(10) and H*(10)) [22]. Importantly, in this study, the ERs in children were significantly lower than those in adults. This may have resulted from prioritising decontamination for environments occupied by children (e.g. schools) [23], although it may also be due to differences in behavior between children and adults. Furthermore, slopes in log-log plots in figure 1 were significantly lower than one, representing that the ERs decreased with air dose rates. This is consistent with previous studies [4, 24]. This can be partly explained by a difference in dose rate reduction due to decontamination between indoor and outdoor [4].
Airborne monitoring did not confirm the effects of decontamination, although they were observed from individual monitoring at the same locations and periods. Furthermore, DRRdec estimated from airborne monitoring was significantly lower than that from individual monitoring, suggesting airborne monitoring is less sensitive to the effects of decontamination than individual monitoring. This result may be due to airborne monitoring also accounting for non-decontamination areas (e.g. forest) or being affected by surrounding areas. Overall, individual monitoring appears more beneficial to evaluate the effects of decontamination among residents.
This study had some limitations in addition to the dataset-related limitations reported previously [11]. For brevity, we discuss only methodological limitations specific to this study. First, we aggregated air doses at Oaza level because of data availability for individuals. More detailed dose assessment, accounting for particular residential areas, may improve the estimates. Second, although this study revealed differences in ERs between adults and children, and the observed and government-estimated values, the factors determining these differences remain elusive. Despite these limitations, this study presents preliminary evidence for the use of airborne monitoring.
Acknowledgments
We appreciate Ms. Naomi Sato, Mr. Masatsugu Tanaki and all staff in the city office of Minamisoma City for their assistance in providing data for this study. This study was partly supported by the JSPS KAKENHI grant number JP16H01836 and JP16H05894.
Competing interests
None to declare.