


Abstract
Interventional radiology and cardiology are widespread employed techniques for diagnosis and treatment of several pathologies because they avoid the majority of the side-effects associated with surgical treatments, but are known to increase the radiation exposure to patient and operators. In recent years many studies treated the exposure of the operators performing cardiological procedures. The aim of this work is to study the exposure condition of the medical staff in some selected interventional radiology procedures. The Monte Carlo simulations have been employed with anthropomorphic mathematical phantoms reproducing the irradiation scenario of the medical staff with two operators and the patient. A personal dosemeter, put on apron, was modelled for comparison with measurements performed in hospitals, done with electronic dosemeters, in a reduced number of interventional radiology practices. Within the limits associated to the use of numerical anthropomorphic models to mimic a complex interventional procedure, the personal dose equivalent, Hp(10), was evaluated and normalised to the simulated Kerma-Area Product, KAP, value, indeed the effective dose has been calculated. The Hp(10)/KAPvalue of the first operator is about 10 μSv/Gy.cm2, when ceiling shielding is not used. This value is calculated on the trunk and it varies of +/−30% moving the dosemeter to the waist or to the neck. The effective dose, normalised to the KAP value, varies between 0.03 and 0.4 μSv/Gy.cm2. Considering all the unavoidable approximation of this kind of investigations, the comparisons with hospital measurement and literature data showed a good agreement allowing to use of the present results for dosimetric characterisation of interventional radiology procedures.
Export citation and abstract BibTeX RIS
Corrections were made to this article on 9 December 2019. One of the author's names was corrected.
1. Introduction
Interventional radiology and cardiology are widespread used techniques for diagnosis and treatment of various heart, vascular and hepatobiliary pathologies, for tumor therapy (embolisation procedures) and pain management (vertebroplasty). Being minimally invasive, they avoid the majority of the side-effects associated with surgical treatments but are known to increase the radiation exposure to patient and operators (Williams 1997, Vañó et al 1998, Covens et al 2007, Morrish and Goldstone 2008, Martin 2009, Olgar et al 2009, Faroux et al 2018, Vano et al 2018).
In recent years, many studies have explored the exposure of the operators performing interventional procedures. This was mostly done for the interventional cardiology (Baptista et al 2015, Vano et al 2015), where usually the long duration of the procedure could determine high exposure for the medical personnel. In interventional radiology (PTC-Percutaneous transhepatic cholangiography, PTBD-Percutaneous transhepatic biliary drainage and/or stenting, PTA-Percutaneous Transluminal Angioplasty, TIPS-Transjugular Intrahepatic Portosystemic Shunt, DSA-Digital subtraction angiography, etc.) exposures are generally lower, though, when optimised shielding is not employed, personnel exposure could reach significant values (Domienik et al 2011, Ferrari et al 2016). For this reason improving the compliance of operators towards radioprotection strategies is needed (Sailer et al 2017), and a special attention should be devoted to the unprotected parts of the body (e.g. eye lens and head).
The aim of this work is modeling the exposure conditions for the interventional radiologists for some selected procedures using Monte Carlo simulations, reproducing the response of individual dosemeters worn on the protective apron. This is performed in terms of personal dose equivalent, Hp(10) (ICRU 1993), estimating the effective dose for the operator, and evaluating the dose received by the eye lens and the brain. In order to validate the simulations, it was decided to perform measurements during different interventional radiology procedures, using electronic dosemeters.
This work is part of a wider activity performed in the WG-12 group (Dosimetry in medical imaging) of EURADOS (European Radiation Dosimetry Group, www.eurados.org). The general scheme of this task has been presented at the 2018 national conference of the Italian Association for Radiation Research (SIRR, a member of the International Association for Radiation Research)whose proceeding has been published in Nuovo Cimento C (Ferrari et al 2018). In that paper a first comparison with our preliminary results and available literature data (Olgar et al 2009) has been shown. In the present paper the new results concerning the whole body dosimetry will be presented.
2. Material and methods
In recent years our group has already employed these anthropomorphic models, based on the MIRD-ORNL description (Snyder et al 1978), in interventional radiology dosimetric studies (Ferrari et al 2010, Carinou et al 2011, Koukorava et al 2011, Ferrari et al 2016, Principi et al 2016). In this work we employ the same geometry, the operator is standing up, near the patient (both having the dimensions of the standard man, 176 cm and 73 kg), but a third anthropomorphic phantom, representing the second radiologist, has been added at the right hand of the first operator. Indeed, for both operators, the description of operator's eyeballs was modified and a small volume was introduced at a depth of 3 mm in its soft tissue to calculate the eye lens personal dose equivalent Hp(3) (ICRU 1993).
The operator's brain (a simple ellipsoid) was subdivided into sections to better investigate the local exposure conditions of this organ. Tissue composition and densities have been taken from ICRU report 46 (ICRU 1992). The operators wear a 0.5 mm lead apron and a thyroid protection collar of the same thickness, that were both designed as a thin lead layer covering the phantoms protected parts (see figure 1).

Figure 1. Geometries of the simulated scenarios for the four considered projections.
Download figure:
Standard image High-resolution imageThe first operator is placed on the right side of the patient near the patient's abdomen (next to the patient's liver), with the hands almost in the x-ray field (a quite common situation in these procedures) and the second operator is about 70 cm to his right hand (figure 1). The distances from the x-ray beam isocentre are 50 cm, for the first operator and 86 cm for the second one.
Each simulation scenario is described by 240 volumes, defining the structures and the different parts of the bodies, which are delimited by 347 surfaces in total. Because the operator receives only the scattered radiation coming from the patient, in order to get an uncertainty of few per cent on the calculated values, several hours to days of CPU and up to months (depending on the case) of computer time for a single CPU, on a standard level PC, are required for each investigated scenario. This is the reason why the simulations were shared among the member of the group using different Monte Carlo codes and version (including parallel computing options): MCNP4B (Briesmeister 1997, MCNPX (Pelowitz 2005), MCNP6 (Pelowitz 2013), PENELOPE (Penelope 2014) and different photon libraries (mcplib22, mcplib84, EPDL97).
Due to the energy range of radiological procedures, the kerma approximation mode was employed, i.e. the transport of secondary charged particles was not followed.
MCNP and PENELOPE are well-validated Monte Carlo codes, they were tested in x-ray fields and with various geometries, and results agreed within the statistical uncertainty (AAPM 2015). To check the different aspects of the scenario different inputs were prepared. In order to assure the coherence between the results obtained among the members, specific parameters, as the photon fluence received by the simulated KAP and the fluence reaching the simulated image device, were cross checked employing the same input.
2.1. Characteristic of the simulated scenario
2.1.1. Projections
Because the aim of the study was to reproduce interventional procedures such as PTC, PTBD or TIPS, a reduced number of x-ray beam projections was needed. In interventional radiology procedures Postero-Anterior projection (PA) is predominant, if not the only, projection in the majority of situations. However, in order to complete the analysis, three additional x-ray beam projections were added: Right-Anterior Oblique 25°, RAO 25°, Left-Anterior Oblique 25°, LAO 25°, and Cranio-Caudal 25°, CRA 25°.
2.1.2. Shielding
Only the under-couch shielding was considered in the reference scenario; some shielding, as simple layer of lead of the given thickness, has been simulated for the comparison with measurements.
2.1.3. X-ray source
The x-ray beam has been simulated as a point source emitting a cone of photons, of fixed aperture, on the patient. In order to reproduce the square field of modern digital equipment, an ideal filter was inserted between the source and the simulated KAP (Kerma Air Product)-meter. This filter kills all the photons outside its central square aperture (i.e. imp:p = 1 in the center and imp:p = 0 outside the aperture in MCNP syntax). X-ray beam spectra where selected from IPEM catalogue (IPEM 1997) and vary in terms of kV and additional Al and Cu filtration (see table 1).
Table 1. Simulated beam qualities. Beam No.1 is the reference case.
| Beam number | Beam kV | Al filtration (mm) | Cu filtration (mm) | Calculated mean energy (keV) |
|---|---|---|---|---|
| 1 | 90 | 3 | 0.2 | 54.8 |
| 2 | 70 | 3 | 0 | 40.2 |
| 3 | 70 | 3 | 0.4 | 50.2 |
| 4 | 80 | 3 | 0.4 | 54.8 |
| 5 | 80 | 4 | 0 | 45.4 |
| 6 | 100 | 4 | 0.6 | 65.0 |
| 7 | 100 | 5 | 0 | 53.2 |
| 8 | 110 | 3 | 0.2 | 60.9 |
| 9 | 110 | 3 | 0.9 | 71.2 |
| 10 | 110 | 4 | 0 | 54.7 |
2.1.4. KAP-meter
The KAP-meter was designed as a simple thin parallelepiped filled with air, positioned between the source and the patient, rotating together with the source and the image device (a parallelepiped mimicking the presence of the image detector). The simulated entrance KAP value was used to normalise all the calculated quantities for each beam-projection combination.
2.1.5. C-arm distances
The source to skin distance (SSD) was set to about 60 cm and the distance between the source and the image device (SID) was about 90 cm. These distances were kept constant for all irradiation conditions and are fairly representative of routine practice.
2.1.6. AEC
At the entrance of the image device, where the radiation exiting from the patient should be detected, a second thin air-filled layer (here named IDEK: image device entrance kerma) is used for the normalisation among projections. This should mimic the presence of the Automatic Exposure Control (AEC). IDEK value was used to normalise the calculated quantities to the PA condition (chosen as the reference projection) when different projections have been compared.
2.1.7. Dosemeters
In order to simulate the measurement during medical procedure, spherical scoring volumes, filled by air, were simulated at various positions on the operator's protective apron. Fluences were converted to Hp(10) employing Hp (10)/ϕ conversion coefficients (ICRU 1996) (DE/DF card in MCNP syntax).
2.1.8. Apron transmission factor
In order to compute the radiation transmission factor of the simulated apron (0.5 mm lead), an additional sphere was simulated inside the operator trunk at the same height of the sphere simulating the over apron dosemeter. The apron transmission factor was calculated as the ratio of the inner and outer spheres absorbed doses.
2.2. In hospital measurements
In order to provide a comparison of the simulated values with real situations, a series of measurements have been performed in interventional radiology departments of three hospitals located in Italy (employing Philips Allura Xper FD10, Philips Allura Clarity FD20 and GE Innova systems) and Croatia (employing Shimadzu Bransist Saphire angiography system). Electronic dosemeters (DMC 2000X and DMC 3000 Mirion Technologies Inc.) were used. They were put over the apron, near the dosemeter usually employed for the routine monitoring. For each monitored procedure the main parameters describing the practice have been registered: fluoroscopy duration, KAP value, predominant kV values and additional shielding together with the Hp(10) value.
3. Results
3.1. Simulation of Hp(10)
In figure 2 the simulated values of Hp(10)/KAP conversion coefficients at the breast level, over the apron, are reported for the first (1st op) and second operator (2nd op) for the beam quality 1 of table 1, without additional shielding (i.e. for the reference case). The conversion coefficients for the four considered projections vary from 2.5 μSv/Gy.cm2 and 14 μSv/Gy.cm2 and from 2.8 μSv/Gy.cm2 and 3.6 μSv/Gy.cm2 respectively for the first and the second operator (with an uncertainty of 1% at one standard deviation). The only difference is given by the RAO 25° projection for the first operator. In this case, the image device acts as additional shielding for the radiologist (see figure 1) reducing the scattering field reaching the trunk.

Figure 2. Over apron Hp(10)simulated for the four projections (normalised by KAP values in all figures).
Download figure:
Standard image High-resolution imageIn order to mimic the results obtained with a dosemeter put under the apron, the Hp(10)/KAP conversion coefficients were multiplied by the calculated apron transmission factor (figure 3). The resulting attenuation of the dose equivalent of about two orders of magnitude is in agreement with the results calculated by Saldarriaga Vargas et al (2018).
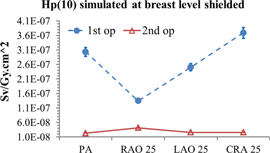
Figure 3. Apron shielded Hp(10)simulated for the four projections.
Download figure:
Standard image High-resolution imageConsidering the energy dependence, the Hp(10)/KAP conversion coefficients increase with the x-ray beam energy (figure 4). Because PA projection is predominant, if not the only, projection in the majority of situations, here only the PA data are reported. The influence of the energy spectrum on the results can be perceived considering the beams having the same mean energy (beams 1, 4 and 10 of table 1).

Figure 4. Hp(10) simulated at the breast level for the PA projection for the beam qualities of table 1.
Download figure:
Standard image High-resolution imageIn the same figure 4 it is possible to see how the Hp(10)/KAP conversion coefficients differ between the two operators. This effect is caused by the variation of the photon fluence at different operator heights at different distances. As a matter of fact, the ratio between the photon fluence calculated for the second operator and the photon fluence for the first operator is 0.25, if one considers the dosemeter put at the breast level, and 0.87, for the dosemeter put at the neck level (for reference case). This is the reason why the results of the first and the second operators are more similar when taking into account a dosemeter placed on the thyroid protective collar (figure 5).
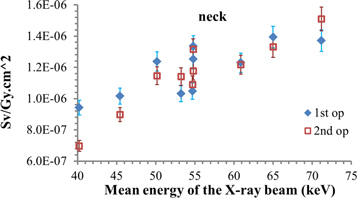
Figure 5. Hp(10) simulated at the neck level for the PA projection for the beam qualities of table 1.
Download figure:
Standard image High-resolution imageIn table 2 the Hp(10)/KAP conversion coefficients for three dosemeters, put at different heights (waist, breast, neck), on the sagittal mid-plane, for the reference case are reported.
Table 2. Simulated dose equivalent (KAP-normalised), for PA projection and beam quality 1, for three different dosemeter positions on the operator's apron (uncertainties of the order of 5% at one standard deviation.).
| Dosemeter position | 1st op Hp(10)/KAP Sv/Gy.cm2 | 2nd op Hp(10)/KAP Sv/Gy.cm2 | Ratios between 2nd and 1st operator Hp(10)/KAP |
|---|---|---|---|
| Waist | 1.30E-05 | 6.06E-06 | 0.47 |
| Breast | 1.03E-05 | 2.80E-06 | 0.27 |
| Neck | 1.33E-06 | 1.18E-06 | 0.89 |
3.2. Simulation of the (male) effective dose
Within the approximation generally admitted with these phantoms for the calculation of the dose in bone surfaces and red bone marrow (see (Lee et al 2006)), the (male) effective dose can be calculated.
Figure 6 displays the behaviour of the effective dose conversion coefficients for the two operators, wearing aprons but in absence of further shielding. They refer to the PA projection. The other projections are shown in figure 7. The effect of partial shielding given by the RAO 25° is suppressed here because the apron already protects the majority of the target organs.
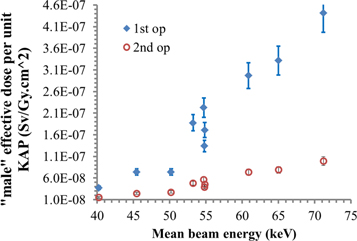
Figure 6. 'male' effective dose simulated for the PA projection for the beam qualities of table 1.
Download figure:
Standard image High-resolution image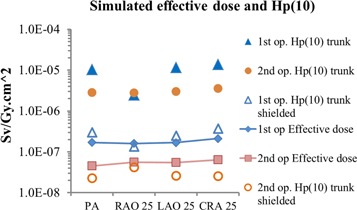
Figure 7. Comparison among 'male' effective dose simulated for the four projection and the evaluated Hp(10) over apron and shielded for reference case.
Download figure:
Standard image High-resolution image
It is interesting to compare the results of the effective doses conversion coefficients, E/KAP, and the Hp(10)/KAP conversion coefficients, simulated for the over and under apron dosemeter. In figure 7 it can be seen that the under apron dosemeter yields values more similar to the effective dose. However, taking into account the second operator, a combination of the two readings, or at least a proper correction factor should be applied (but these considerations are beyond the scope of the present study and will be treated in a specific further work).
3.3. Comparison with measurements
The comparison of measurements and the MC simulation can be assumed as a sort of validation within the following limitations of the investigated conditions. In the hospital setting, each measurement is a single point with a precision of the order of 10% (considering the value registered by the electronic dosemeter). However, a larger uncertainty, around 30% (Struelens et al 2011), can be related to the variability and complexity of the procedures (even among the selected ones), to the difference in operators (see for example the effect of operator height and angle in Principi et al (2016) and to different patient sizes. Moreover, when the additional shielding is used, the uncertainty of the measurement is higher because of the lower dose (and higher associated uncertainties). In simulations, the precision is of the order of 5% but the operators are rigid and in a fixed position. The dosemeters have been simulated on the phantom sagittal mid-plane for the sake of simplicity and not on the left side, where the dosemeter is generally worn. This was done to avoid the possible partial shielding, due to the fixed geometry, given by the left arm (particularly affecting the second operator, see figure 1).
The dose equivalent was obtained by multiplying the Hp(10)/KAP conversion coefficients (for the PA projection) with the measured KAP. For each case, it was chosen the conversion coefficient calculated for the beam energy of table 1 that is more similar to the predominant kV value employed in the hospital procedure.
In the following tables, three situations are presented: without shielding, with a ceiling shielding of 0.5 mm lead and with a mobile shielding of 1 mm lead.
In table 3, the results of the measurements performed in AOSP S. Orsola-Malpighi Hospital (Italy) are reported for the first or second operator. They worked without additional shielding. The Hp(10) was measured with the electronic dosemeter put at the breast level, on the protective apron. The calculated Hp(10) is obtained multiplying the simulated Hp(10)/KAP conversion coefficients (μSv/Gy.cm2) with the measured KAP value (Gy.cm2).
Table 3. Interventional radiology measurement at AOSP S. Orsola-Malpighi Hospital, no shielding.
| Case | Operator | Procedure | Measured KAP value (Gy.cm2) | prevalent clinical set kV | Measured Hp(10) (μSv) | Simulated beam number (see table 1) | Conversion coefficient (μSv/Gy.cm2) | Calculated Hp(10) (μSv) |
|---|---|---|---|---|---|---|---|---|
| 1 | First | PTC | 32.5 | 88 | 141 | 1 | 1.03E-05 | 333 |
| Second | 52 | 2.80E-06 | 90 | |||||
| 2 | First | PTC | 79.96 | 85 | 749 | 4 | 1.11E-05 | 884 |
| 3 | Second | TIPS | 82.37 | 99 | 219 | 7 | 2.54E-06 | 209 |
| 4 | First | PTC | 35.18 | 96 | 456 | 7 | 9.35E-06 | 329 |
| Second | 37 | 2.54E-06 | 89 | |||||
| 5 | First | PTC | 19.18 | 90 | 216 | 1 | 1.03E-05 | 205 |
| Second | 87 | 2.80E-06 | 55 |
The number of cases is limited, but as can be seen, measured and calculated Hp(10) values are always comparable, at least in terms of order of magnitude, within a large range of values. In three cases calculated values overestimate the measurements (as in case 1 for the first and 1 and 4 for the second operator); in two cases underestimate (first operator of case 4 and second of case 5) and in three cases a good agreement can be found (case 2, 3 and 5 (first operator)).
In table 4 the results of the measurement performed in Reggio Emilia Hospital—IRCCS (Italy) are reported for the first operator working with a ceiling shielding of 0.5 mm Pb. The ceiling shielding was reproduced in the simulation. As can be seen the calculated estimates of Hp(10) are all conservative but acceptable.
Table 4. Interventional radiology measurement at Reggio Emilia—IRCCS, 0.5 mm ceiling shielding.
| Case | Procedure | Measured KAP value (Gy.cm2) | prevalent clinical set kV | Measured Hp(10) (μSv) | Simulated beam number (table 1) | Conversion coefficient (μSv/Gy.cm2) | Calculated Hp(10) (μSv) |
|---|---|---|---|---|---|---|---|
| 6 | PTC | 53.2 | 102 | 34 | 7 | 9.62E-07 | 51 |
| 7 | PTC | 31.8 | 90 | 17 | 1 | 7.89E-07 | 25 |
| 8 | PTA | 49.2 | 89 | 11 | 1 | 7.89E-07 | 39 |
| 9 | PTC | 22.2 | 80 | 13 | 5 | 8.39E-07 | 19 |
In order to extend our evaluation to a larger part of interventional radiology it was decided to use also data from different kind of interventional radiology procedures. In table 5, the results of the measurements performed in Osijek University Hospital (Croatia) are reported. They refer only to the first operator working behind a large shielding of 1 mm Pb thickness that was reproduced in the simulation. In this case it is still possible to calculate Hp(10) but the uncertainties related to the position of the operator during the practice affect the results heavier, indeed the uncertainty associated to measurements of few microsieverts can be very high. Nevertheless, the general results are still satisfactory, in particular for cases 11, 12, 13, 14, 18, 22 and 23.
Table 5. Interventional radiology measurements at Osijek University Hospital, 1 mm Pb shielding.
| Case | Procedure | Measured KAP value (Gy.cm2) | set kV | Measured Hp(10) (μSv) | Simulated beam number (table 1) | Conversion coefficient (μSv/Gy.cm2) | Calculated Hp(10) (μSv) |
|---|---|---|---|---|---|---|---|
| 10 | DSA | 8.8 | 68 | 1 | 2 | 5.73E-08 | 0.5 |
| 11 | PTA BTK | 11.8 | 68 | 1 | 2 | 5.73E-08 | 0.7 |
| 12 | DSA + CROSS OVER PTA ILIAC, FEM-POP | 173.7 | 80 | 15 | 5 | 7.17E-08 | 12.5 |
| 13 | PTA FEM-POP + STENT | 22 | 72 | 1 | 2 | 5.73E-08 | 1.3 |
| 14 | PTA ILIAC BILL | 32 | 72 | 2 | 2 | 5.73E-08 | 1.8 |
| 15 | DSA + CROSS OVER PTA FEM-POP + STENT | 36.7 | 70 | 3 | 5.73E-08 | 2.1 | |
| 16 | PTA FEM-POP, BTK | 9.2 | 72 | 1 | 2 | 5.73E-08 | 0.5 |
| 17 | PTA FEM-POP + STENT | 8.9 | 78 | 1 | 5 | 7.17E-08 | 0.6 |
| 18 | PTBD | 38 | 97 | 5 | 7 | 1.24E-07 | 4.7 |
| 19 | PTBD + STENT | 74.5 | 70 | 2 | 2 | 5.73E-08 | 4.3 |
| 20 | PTBD | 83.8 | 93 | 3 | 1 | 1.20E-07 | 10.1 |
| 21 | PTBD | 44.2 | 72 | 1 | 2 | 5.73E-08 | 2.5 |
| 22 | PTBD | 18 | 66 | 1 | 2 | 5.73E-08 | 1.0 |
| 23 | PTBD | 30 | 74 | 2 | 2 | 5.73E-08 | 1.7 |
| 24 | PTBD | 29.5 | 69 | 1 | 2 | 5.73E-08 | 1.7 |
DSA: Digital subtraction angiography—complete lower extremities run-off study; PTA: Percutaneous transluminal angioplasty; BTK: below the knee; CROSS OVER: contralateral, cross-over approach; ILIAC: iliac arteries, FEM-POP: femoropopliteal artery, STENT: additional stenting; BILL: bilateral; PTBD: percutaneous transhepatic biliary drainage.
4. Discussion
Since the aim of this work was modeling the exposure condition of the interventional radiologists, one of the main points was establishing the accuracy of the values that can be calculated through Monte Carlo simulated scenarios. In the present study we did not distinguish between fluoroscopy and digital subtraction angiography (DSA). The RDSR (Radiation dose structured report) that contains all data about every employed projection was not employed (and for some units it was not available) during this investigation. That can affect the accuracy of the simulations and the comparisons presented in tables 3–5 can give an idea of the range of the validity of the calculated quantities. Considering that no special duty or request was put upon the medical personnel performing those procedures, apart from wearing an additional dosemeter, we think that, even in case of larger discrepancy, the work succeeded in demonstrating, in some case with very satisfactory agreement, the possibility of mimicking the exposure of operators.
Notwithstanding the limits of the model in reproducing the investigated beam energy and filtration, about the dimensions of the patient and of the operator, that are fixed, the dimensions of the field of view, the 'rigidity' in schematizing the operator's position with respect the patient and the isocentre of the x-ray beam, some important conclusions can be outlined.
If one considers the variability of these procedures and the variability of the doses, the evaluated data are coherent with what can be found in literature. The conversion coefficients for the first operator for the beam quality 1 is of the order of 10 μSv/Gy.cm2 in absence of shielding, decreasing to 0.8 μSv/Gy.cm2 and 0.1 μSv/Gy.cm2 in case of 0.5 mm and 1 mm lead shielding, respectively. The unshielded value is consistent with the 8.3 μSv/Gy.cm2 found by Leyton et al employing PMMA plates and plastic phantoms (Leyton et al 2016). The decreasing of a factor of three or four in the exposure, passing from the first to the second operator, is coherent with similar evaluations (Tsalafoutas et al 2007). About (male) effective dose, the E/KAP for the first operator varies from 0.03 to 0.4 μSv/Gy.cm2, with the mean energy of the beam increasing from 40 keV to 70 keV . These estimates are coherent with the values of 0.06–0.2 μSv/Gy.cm2 reported by Kim et al (2012) for biliary procedures and TIPS. Indeed, it is possible to compare the results calculated by Santos et al (2018), which employed anthropomorphic voxel models, with the data for the second operator (the presence of the shielding excludes a direct comparison with the first operator). In Santos et al E/KAP, for PA protection, different kV and patient sizes, varies in the range 0.02–0.07 μSv/Gy.cm2 which is consistent with 0.03 to 0.09 μSv/Gy.cm2 found in the present study.
5. Conclusions
In the present work a model for the simulation of the Hp(10) of the personnel working in interventional radiology is presented and validated. Within the limits of the rigidity of the simulated geometries, with respect the larger variability of the real condition, the comparison with hospital measurement showed a good agreement.
The values calculated in this work are applicable to interventional radiology practices. Their extension to the interventional cardiology procedures should be considered with caution, because the different operator position, beam filtration, projections and shielding could affect the values.
The present model can be used to determine the effect of shielding, in the dosimetric characterisation of a radiology theater. The calculated Hp(10)/KAPvalue values can be employed to compare algorithms for the double dosimetry for effective dose calculation in interventional procedures and to give a rough estimate of the operator exposure. When for example, for some reasons, direct dosimetry is not available, Hp(10)/KAP conversion coefficients can be used to assess, at least, the order of magnitude of the personal dose equivalent value. That can be useful, for example, in case of personnel not normally exposed to the radiation, assisting the patient during the practice.
Extensive simulations to investigate the doses to the operators lens of the eyes and to the operators' brain are planned for the future.
This work was supported by the European Radiation Dosimetry Group (EURADOS, WG12).