


Abstract
The aim of this work is to analyse the scattered radiation produced by the mobile accelerator Mobetron 1000. To do so, detailed Monte Carlo simulations using two different codes, Penelope2008 and Geant4, were performed. Measurements were also done. To quantify the attenuation due to the internal structures, present in the accelerator head, on the scattered radiation produced, some of the main structural shielding in the Mobetron 1000 has been incorporated into the geometry simulation. Results are compared with measurements. Some discrepancies between the calculated and measured dose values were found. These differences can be traced back to the importance of the radiation component due to low energy scattered electrons. This encouraged us to perform additional calculations to separate the role played by this component. Ambient dose equivalent, H*(10), outside of the operating room (OR) has been evaluated using Geant4. H*(10) has been measured inside and outside the OR, being its values compatible with those reported in the literature once the low energy electron component is removed. With respect to the role played by neutrons, estimations of neutron H*(10) using Geant4 together with H*(10) measurements has been performed for the case of the 12 MeV electron beam. The values obtained agree with the experimental values existing in the literature, being much smaller than those registered in conventional accelerators. This study is a useful tool for the clinical user to investigate the radiation protection issues arising with the use of these accelerators in ORs without structural shielding. These results will also enable to better fix the maximum number of treatments that could be performed while insuring adequate radiological protection of workers and public in the hospital.
Export citation and abstract BibTeX RIS
1. Introduction
Intraoperative radiation therapy (IORT) is a set of clinical techniques designed to administer a uniform absorbed dose in a single fraction to a tumour, or tumour bed, during a surgical procedure while the patient is under anaesthesia. Their clinical usefulness has been proved in the treatment of many different types of cancer [1–7]. As compared with conventional radiotherapy, IORT presents in the vast majority of cases a decrease in morbidity on normal tissues, and/or an improvement in disease local control, and/or overall survival of patients.
From its beginnings, IORT has used different techniques, from high rate brachytherapy to low-kV x-rays or electron beams [8, 9]. In the case of linear electron accelerators (linacs), irradiation was performed in the shielded rooms where this equipment is installed. This presents the inconvenience of requiring moving the anaesthetised patient outside the surgical area. This circumstance had multiple logistical and patient-safety problems and led to the design of mobile linacs in the late 1990s. These new accelerators allowed the irradiation of the tumour in the operating room (OR), thus avoiding the problems associated with the transfer of the patient and hence reducing the duration of the treatment.
Several Monte Carlo (MC) studies have been published characterising the electron beams present in mobile linacs [10, 11]. The main goal of these studies has been to analyse the dosimetric aspects of IORT implementation from the clinical point of view and not to address radiation protection issues. Such MC techniques has been applied by some of the authors of the present work in the field of radiation protection in other similar devices [12–17]. The proven usefulness of such developments has encouraged us to perform a MC and experimental study for mobile linacs in the field of radiation protection.
The present study focuses on the Mobetron 1000® (Intraop Medical Corporation, Sunnyvale, CA, USA) that is able to produce electron beams with energies of 4, 6, 9 and 12 MeV. The new model, Mobetron 2000 [18], only produces electrons with nominal energies of 6, 9 and 12 MeV.
The Mobetron 1000 was specifically designed for intraoperative radiotherapy in the OR. The radiation protection safety studies for this equipment are carried out using measured data provided by the manufacturer. The user must extrapolate them for their particular installation considering their particular use and the existing structural barriers.
Although mobile accelerators are designed to deliver pure electron beams, neutrons and x-rays also necessarily arise when those electrons interact with the accelerator structures and the patient. X-rays consist mainly of bremsstrahlung photons together with a small component due to characteristic x-rays. The main process for neutron production by an electron beam is the absorption of the bremsstrahlung photons produced by electrons above a threshold energy, typically of the order of 10–19 MeV for light nuclei (A < 40). Therefore, neutrons can be produced in any material along the beam path, the scattering foil, the collimation system, shielding or the beam stopper. In the particular case of the Mobetron 1000 this may only happen for the case of a 12 MeV energy electron beam. Due to this unintended photon component, the maximum number of treatments may be limited to ensure that the dose delivered to both workers and members of the public are well within the safety dose limits when a typical OR with no shielding is used. This issue has forced the manufacturers to adapt the design of the linacs to minimise the scattered radiation component.
The purpose of this work is to study the area dosimetry of the Mobetron 1000 in a standard OR using experimentally validated MC simulations. To do so, the geometry of the Mobetron 1000 head was modelled in a detailed way and the scattered radiation produced was studied. Air collision kerma, absorbed dose and ambient dose equivalent were obtained and compared with the corresponding measured data.
2. Material and methods
2.1. The mobetron
At the Quirónsalud Torrevieja Hospital (Alicante, Spain) a Mobetron 1000 IORT accelerator has been in use since 2004. Its collimation system is based on metallic cylindrical applicators with a flat or bevelled at 15° or 30° end to facilitate its adaptation to any surgical field. Applicator diameters range from 3 to 10 cm in 0.5 cm increments. The source-skin distance of treatment is 50 cm and the length of the applicator is 30 cm. The Mobetron 1000 has two different dose rate modes: 'Low' (250 MU min−1) and 'High' (1000 MU min−1), being the latter one used in clinical mode [19]. The 4 MeV beam energy was not considered in the present study because it is not used in clinical practice.
Figure 1 shows an image of the Mobetron accelerator in its treatment position and the plan view of the OR used in our hospital for IORT treatments (a standard OR), in which we have placed the (1) modulator system, the (2) control console, the (3) treatment table and the (4) Mobetron 1000 itself.
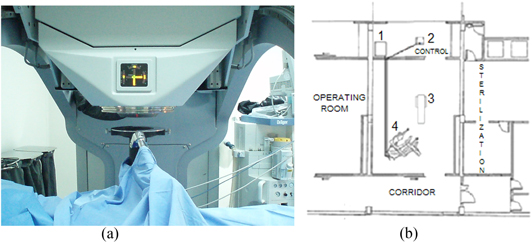
Figure 1. (a) The Mobetron and (b) blueprint of the OR at the Quirónsalud Torrevieja. (1) corresponds to the modulator system, (2) to the control console, (3) to the treatment table and (4) to the Mobetron 1000 itself.
Download figure:
Standard image High-resolution image2.2. Experimental dosimetry
Absorbed dose in water was measured to obtain percentage depth dose curves (PDD) and dose profiles to model the Mobetron 1000 beam. Then, a radiation survey was performed around the Mobetron 1000 in the OR by measuring ambient dose equivalent, H*(10) [20], due to the electrons and photons leaving the unit. Additionally, H*(10) and H*(10) rate due to the neutron radiation produced in the Mobetron 1000 were also been studied for the highest energy beam of 12 MeV.
The ICRU 47 recommended the ambient dose equivalent, H*(d) for area monitoring, including a specification of the reference depth, d (in mm). For strongly penetrating radiation, a depth of 10 mm is frequently employed. The ambient dose equivalent for that depth is then denoted by H*(10). All photons with energies greater than about 15 keV are considered to be strongly penetrating. For weakly penetrating radiation, a depth of 0.07 mm for the skin and 3 mm for the eye are employed with analogous notation. It is also stated that area monitors for strongly penetrating radiation should be calibrated in terms of the ambient dose equivalent, H*(10).
2.2.1. Dosimetric characterization of the Mobetron therapeutic beam: PDD curves and dose profiles in water
Measurements of the PDDs and dose profiles for the largest 10 cm diameter applicator and outputs were performed with the computerised beam model of MP3 (PTW, Freiburg, Germany) by using EFD3G diodes (Scanditronix Wellhöfer AB, Uppsala, Sweden) of 2.5 mm active diameter. These diodes were designed for absorbed dose measurements of electron beams of energy between 1 and 50 MeV.
2.2.2. Photon and electron area dosimetry for the Mobetron
In the following, all distances are referred to a coordinate system shown in figure 2 and based on the Mobetron 1000 itself as proposed by Krechetov et al [21]. The origin of such coordinate system is taken at the point of intersection of the beam axis on the floor.
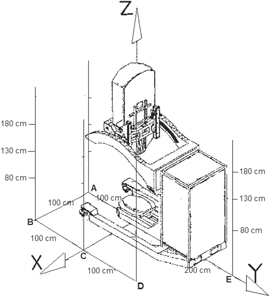
Figure 2. Coordinate system with the distribution of measurement points around the Mobetron 1000. Mobetron 1000 illustration from Krechetov et al [21].
Download figure:
Standard image High-resolution imageArea dosimetry was carried out with the radiation monitor model 451P-DE-SI [22] (Fluke Biomedical, Cleveland, USA). This radiation monitor consists on an ionization chamber detection system of 230 cm3 of pressurised air at 6 atm. The active volume of the detector can be approximated to a cylinder 2.8 cm in radius and 9.35 cm in height. It detects β-radiation with energies greater than 1 MeV and γ-radiation above 25 keV. This detector is calibrated in terms of H*(10). At each point H*(10) is expressed as a fraction of the absorbed dose at dmax (μSv Gy−1). It was measured for the 10 cm applicator using irradiations between 200 and 500 MU.
The area dosimetry was measured around the Mobetron 1000, both inside and outside the OR.
Measurements inside the OR were performed at the three different heights representative of patient-plane, second scatter plane and the union of the two acceleration sections, respectively. Five locations were chosen around the Mobetron 1000, named A, B, C, D and E and shown in figure 2. The coordinates of these points (x, y) are specified in table 1. The measurements were performed using a RW3 (PTW, Freiburg, Germany) [23] phantom made of fifteen 30 cm × 30 cm sheets of 10 mm thickness each to mimic typical clinical conditions.
Table 1. Area dosimetry locations for the Mobetron 1000 dosimetry inside the OR. The coordinates are specified with respect to the same coordinate system used in figure 2. Measurements were performed at z = 80 cm, z = 130 cm, and z = 180 cm for each (x, y).
| Locations | Point coordinates (x, y) (cm) |
|---|---|
| A | (0, −100) |
| B | (100, −100) |
| C | (100, 0) |
| D | (100, 100) |
| E | (0, 200) |
Outside the OR and behind the structural barriers, area dosimetry was taken at six locations described in table 2. In this table, the location coordinates and the barrier thickness/material are given. We have labelled the locations in each barrier according to the names of the rooms they are adjacent with (see figure 1). The measurements were performed with two phantoms, the aforementioned RW3 and the one provided with the Mobetron 1000 unit for QA purposes (QAP). This phantom incorporates at the end of the 10 cm diameter aluminium applicator a cylinder of plastic 13.5 cm in diameter and 8.5 cm high. The reason to select different points in this study for MC and measurements is that in our facility during treatment the unit is located close to one of the walls (see figure 1(b)) while the MC studies in the literature usually assume that the unit is located at the centre of the OR.
Table 2. Measurement locations for the Mobetron 1000 area dosimetry outside the OR and behind the structural barriers. The coordinates are specified with respect to the same coordinate system used in figure 2.
| Monte Carlo | Measurements | |||
|---|---|---|---|---|
| Locations | Wall material | Thickness (mm) | Point coordinates (x, y, z) (cm) | |
| Control | Gypsum | 30 | (330, 0, 130) | (660, 0, 130) |
| OR | Gypsum | 30 | (0, 330, 130) | (0, 400, 130) |
| Sterilization | Gypsum | 30 | (0, −330, 130) | |
| Corridor | Gypsum | 30 | (−330, 0, 130) | |
| Ceiling | Concrete | 120 | (0, 0, 330) | |
| Floor | Concrete | 120 | (0, 0, −30) | |
2.2.3. Neutron area dosimetry for the Mobetron
H*(10) and H*(10) rate for neutrons was measured using a BERTHOLD model LB6411 (Berthold Technologies, BadWilbad, Germany). This detector has been calibrated using an Am-Be source for neutrons of energies up to 20 MeV and consists of a 3He filled proportional counter located in the centre of a moderator system made of a sphere of polyethylene of 25 cm of external diameter. The active volume of the detector is 45 cm3.
In order to compare with similar measurements performed by Loi et al [24], H*(10) was obtained at various heights, from 13 to 130 cm, and distances, from 30 to 73 cm, in two different positions, in the frontal and lateral sides of the Mobetron 1000.
2.3. MC study of the mobetron
Using the Mobetron 1000 head structural data as supplied by the manufacturer [11], we have modelled its geometry and material composition (see figure 3).

Figure 3. Details of the Mobetron 1000 head (not to scale) modelling done with the Penelope2008 code. The top of the diagram shows the accelerator head, where the radiation beam is generated, while the lower part depicts a detail of the applicator that comes into contact with the water phantom (in blue).
Download figure:
Standard image High-resolution imageThe Mobetron 1000 head was independently modelled using two MC codes: Penelope2008 [25] and Geant4 (version 9.3) [26]. The size of the electron source was taken to be 1 mm2 in both cases as given by Janssen et al [11], and a cut-off energy of 10 keV was considered for all particles and materials. To obtain an adequate spatial resolution, voxels were specified in cylindrical coordinates with values Δz = 0.2 cm and Δr = 0.2 cm. Initially, the same distributions of incident energy fluence of the electrons were assigned in both codes.
2.3.1. Calculations of PDD and modelling the head of the Mobetron
PDDs in water were calculated and compared with the measured ones. New simulations were performed modifying the incident electron beam energy spectrum, both its mean energy and Gaussian width, independently for each MC code until the agreement of measured and calculated PDD was good enough.
After fully constraining the details of the MC simulation of the Mobetron 1000 head, the only remaining details to be determined were the characteristics of the most relevant shielding structures present in the accelerator head and inside the cabinet behind the stand. The shielding located below the patient was also considered. These shielding structures are shown in figure 4.

Figure 4. (a) Details of the Mobetron structural shields (not to scale). Cross section of the head (code Penelope2008). (b) 3D rendering of the Mobetron, including the cabinet, shield, applicator and a phantom simulating the patient (Geant4 code).
Download figure:
Standard image High-resolution imageDue to the unfeasibility of reproducing the precise geometry and composition of the electronics inside the case forming the outer part of the accelerator head, it was filled with a material equivalent to integrated electronic circuitry with an effective density of 1.4 g cm−3 to mimic it sparseness [27]. Nevertheless, two structures of importance in the production of leakage radiation were explicitly included inside the case: the acceleration section, made of cooper, and the lead plates covering them on three sides. A rectangular prism-like structure simulating the magnetron was also located inside the box. This structure is positioned to the right of the intersection of the acceleration sections (figure 4 left). For the sake of simplicity, we assumed that it was made entirely of iron with a density of 3 g cm−3. Regarding the cabinet located behind the stand, we considered it solid and also filled by the same iron-equivalent material as the magnetron. We consider that for the purpose of this work the simplifications introduced in modelling are sufficient and will not make the simulation results unrealistic, as we will see in the next sections.
2.3.2. Photon and electron area dosimetry for the Mobetron
Once the Mobetron accelerator head was fully established, several MC simulations were performed with the Geant4 code using the full model described. The Mobetron 1000 was placed in the treatment configuration, i.e., with the gantry and the head aligned vertically, with the 10 cm in diameter flat end applicator and delivering a maximum dose rate of 1000 MU min−1. The scatter on the patient was simulated using plastic dummy RW3 (PTW, Freiburg, Germany) [23] made of fifteen 30 cm × 30 cm sheets of 10 mm thickness each. The flat end of the applicator was put in contact with the phantom. In this way, the most unfavourable treatment conditions were reproduced.
The first simulation was performed to obtain air collision kerma and absorbed dose around the Mobetron 1000 inside the OR for the energies of 6, 9 and 12 MeV (see figure 2) and was evaluated at the locations described in table 1.
Simulations were also performed by varying the shielding structures of the Mobetron 1000 (in a range from half the nominal density to doubling the density) to quantify the importance of these unknown parameters in the calculated doses. To obtain a good spatial resolution with adequate statistical uncertainty and preventing an excessively large calculation time, air cubic voxels of Δx = Δy = Δz = 10 cm were adopted.
The second simulation was carried out incorporating to the modelling the OR structural barriers. Air collision kerma for all available energies were evaluated at the locations outside the OR (see table 2). In this case air collision kerma values were converted to H*(10) values using the conversion factors taken from table A2 of ICRU 47 [20].
2.3.3. Neutron area dosimetry for the Mobetron
Finally, for the case of an electron beam with an energy of 12 MeV a simulation was performed to estimate the fluence of neutrons at points indicated in table 1 around the Mobetron 1000.
2.4. Uncertainty analysis.
In the following, all uncertainties are provided with a coverage factor k = 2.
2.4.1. Measurements of H*(10) for photons and electrons
For the H*(10) measurements performed with the Fluke monitor, according to the information provided by the manufacturer the uncertainty associated with the calibration factor of the detector in H*(10) is ±3.6%, while those associated with its accuracy and precision are ±10% and ±5%, respectively.
Regarding the energy response, it has been found that this type of detectors has an optimal response except at low energies. According to IEC standard 1017-2 [28], the response of these monitors to incident radiation energy in the 50–150 keV range will not differ by more than 30% from the calibration performed using 137Cs. Also, the manual indicates that there is a greater deviation in the range of energies of 25–80 keV [22], not describing its behaviour above 1500 keV. Since in most part of the photon energy spectrum the behaviour of the detector with the energy is similar to the one used for its calibration, an additional uncertainty of ±10% associated to the dependence of the detector with the energy of the incident particle has been estimated.
We have not considered any uncertainty associated with the dependence on the angle of incidence, since all measurements were taken with the detector aligned towards the applicator and the variation of the response with the angle of incidence of the radiation is very low between ±90°, coincident with the bibliography [28].
With respect to the uncertainty of positioning, it has been verified experimentally that a variation in the position of up to 2 cm in any of the three axes has a negligible repercussion in the measurements.
The stability of the reference dose has been extensively discussed in the literature [29]. An uncertainty of ±3% has been assigned to the accelerator monitor system independently of the energy considered.
Therefore, by taking into account all these factors (see table 3 for a summary), we have estimated an expanded uncertainty of ±20%. This is the value assigned to the H*(10) measured data.
Table 3. Uncertainties estimated in the measurement of the ambient dose equivalent H*(10).
| Detector calibration factor | ±3.6% |
| Accuracy | ±10% |
| Precision | ±5% |
| Energy response | ±10% |
| Reference dose | ±3% |
| Expanded uncertainty (k = 2) | ±20% |
2.4.2. Measurements of H*(10) for neutrons
Finally, for the measurements of H*(10) rate due to neutrons made with the neutron dosimeter BERTHOLD model LB6411, according to the information supplied by the manufacturer, the uncertainty associated to the calibration factor in H*(10) is of ±3%, the one associated with accuracy is ±5% and due to the spherical symmetry of the moderator and detector, the one corresponding to the directional dependence is less than ±10% across the entire range of energies of interest.
The characteristic of our detector that influences most negatively the accuracy of our measurements is the energy dependence between 50 keV and 10 MeV. The associated uncertainty gave a value of ±30%.
In addition, the Mobetron 1000 absorbed dose rate cannot be monitored directly in real-time. Therefore, its inherent instabilities have been minimised by using a prolonged stabilization period (more than 8 h) and with a previous warming-up period before measuring. For nominal rates of 1000 MU min−1, the MU rates registered have oscillated between 960 and 1020 MU min−1. Hence, the uncertainty associated with the MU rate and calibration factor cGy MU−1 has been estimated to be ±4%. By considering all these issues, an expanded uncertainty of ±38% (k = 2) has been obtained for the H*(10) measured data (see table 4 for a summary).
Table 4. Uncertainties estimated in the measurement of the ambient dose equivalent H*(10) rate for neutrons.
| Detector calibration factor | ±3.0% |
| Accuracy | ±5% |
| Directional dependence | ±10% |
| Energy response | ±30% |
| Ratio and reference dose | ±4% |
| Expanded uncertainty (k=2) | ±38% |
2.4.3. MC calculations
With respect to the MC modelling of the Mobetron 1000 radiation head, for the Penelope2008 simulation the global MC uncertainty is defined as the average uncertainty of all those voxels whose value is above 50% of the maximum absorbed dose. This global Type A uncertainty is 0.2%–0.4% depending on the energy considered. In the case of specific voxels, the precision near the maximum absorbed dose in the depth dose curves may reach 1%–1.5%. In the case of the Geant4 simulation, the Type A uncertainty was less than 1% in the PDDs and less than 2% for the off-axis profiles.
In the case of the MC simulations performed using Geant4 including all shielding structures, the Type A uncertainty is less than 5% in the points of interest for the study.
In addition to of the Type A uncertainty, there is a Type B uncertainty difficult to quantify. This is due to the lack of knowledge on the head and cabinet composition, in both materials and densities. Another relevant component of Type B uncertainties to be considered is that the MC simulation performed does not take into account the leakage radiation in the radiation head. For all of the above, by combining Type A and Type B uncertainties, we estimate a global uncertainty on the MC of ±20% (k = 2).
3. Results
3.1. Experimental dosimetry
3.1.1. PDD curves
Figure 5 presents the PDDs measured compared with those obtained with Penelope2008 and Geant4. Comparison of measured PDDs versus MC.
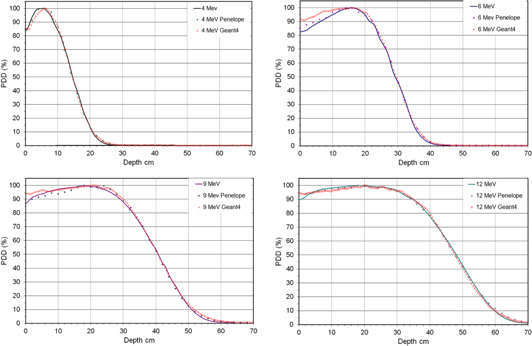
Figure 5. Comparison of measured PDDs (lines) versus those calculated with Penelope2008 (circles) and with Geant4 (stars) normalised at 100% of the maximum absorbed dose in each case.
Download figure:
Standard image High-resolution image3.1.2. Photon and electron area dosimetry for the Mobetron
We measured the ambient dose equivalent H*(10) values due to photons and electrons at the points described in figure 2 around the Mobetron 1000 expressed as a fraction of the absorbed treatment dose at dmax for each energy (μSv Gy−1). The results are given in table 5.
Table 5. Ambient dose equivalent H*(10) values measured at the points around the Mobetron 1000 given in table 1, expressed in units of μSv Gy−1 of the absorbed dose at dmax for the applicator of 10 cm.
| Positions | Energy | |||
|---|---|---|---|---|
| z (cm) | 6 MeV | 9 MeV | 12 MeV | |
| A | 80 | 42 ± 8 | 92 ± 18 | 102 ± 20 |
| 130 | 24 ± 5 | 35 ± 7 | 32 ± 6 | |
| 180 | 3.7 ± 0.7 | 5.6 ± 1.1 | 5.1 ± 1.0 | |
| B | 80 | 19 ± 4 | 44 ± 9 | 47 ± 9 |
| 130 | 13 ± 3 | 20 ± 4 | 20 ± 4 | |
| 180 | 4.3 ± 0.8 | 6.1 ± 1.2 | 6.0 ± 1.2 | |
| C | 80 | 41 ± 8 | 87 ± 17 | 97 ± 19 |
| 130 | 23 ± 4 | 34 ± 7 | 30 ± 6 | |
| 180 | 3.5 ± 0.7 | 4.9 ± 1.0 | 4.6 ± 0.9 | |
| D | 80 | 17 ± 3 | 42 ± 8 | 44 ± 9 |
| 130 | 12.4 ± 2.4 | 20 ± 4 | 19 ± 4 | |
| 180 | 3.5 ± 0.7 | 5.3 ± 1.0 | 5.1 ± 1.0 | |
| E | 80 | 0.000 ± 0.010 | 0.000 ± 0.010 | 0.29 ± 0.05 |
| 130 | 0.18 ± 0.03 | 0.30 ± 0.05 | 0.25 ± 0.04 | |
| 180 | 0.28 ± 0.04 | 0.39 ± 0.06 | 0.32 ± 0.05 | |
In table 6 we present the measured the ambient dose equivalent H*(10) values at the points described in table 2 outside the OR and behind the structural barriers. The H*(10) values are expressed as a fraction of the absorbed treatment dose at dmax for each energy (in 10−3 μSv Gy−1). Due to the fact that the barriers at floor and ceiling are thicker than 30 cm of concrete, the H*(10) measurements was background.
Table 6. Ambient dose equivalent H*(10) values measured at the locations given in table 2, expressed in units of 10−3 μSv Gy−1 of the absorbed dose at dmax for the applicator of 10 cm.
| Ambient dose equivalent H*(10)(×10−3 μSv Gy−1) | ||||||
|---|---|---|---|---|---|---|
| 6 MeV | 9 MeV | 12 MeV | ||||
| Locations | RW3 | QAP | RW3 | QAP | RW3 | QAP |
| Control | 40 ± 10 | 40 ± 10 | 30 ± 10 | 40 ± 10 | 30 ± 10 | 30 ± 10 |
| OR | 90 ± 20 | 80 ± 20 | 60 ± 10 | 50 ± 10 | 50 ± 10 | 40 ± 10 |
| Sterilization | 260 ± 50 | 240 ± 50 | 220 ± 40 | 200 ± 40 | 190 ± 40 | 170 ± 30 |
| Corridor | 290 ± 60 | 270 ± 50 | 290 ± 60 | 260 ± 50 | 290 ± 60 | 250 ± 50 |
| Ceiling | Background | |||||
| Floor | Background | |||||
3.1.3. Neutron area dosimetry for the Mobetron
Measured H*(10) rate values for neutrons at points near the Mobetron 1000 are detailed in table 7. To facilitate the comparison with similar measurements performed by Loi et al [24] we have considered the locations used there instead of those chosen in this work for the photon and electron case. H*(10) values were obtained from the neutron ambient equivalent dose rate measurements for a Mobetron 1000 nominal rate of 1000 MU min−1.
Table 7. Measured neutron H*(10) rate and H*(10) per absorbed dose at dmax for the 12 MeV case for different locations around the Mobetron 1000.
| Position | Height (cm) | Distance to the axis (cm) | H*(10) rate (μSv h−1) | H*(10) (μSv Gy−1) |
|---|---|---|---|---|
| 1 | 13 | 73 | 160 ± 60 | 0.27 ± 0.10 |
| 2 | 47 | 30 | 240 ± 90 | 0.41 ± 0.16 |
| 3 | 47 | 30 | 240 ± 90 | 0.41 ± 0.16 |
| 4 | 47 | 50 | 190 ± 70 | 0.33 ± 0.13 |
| 5 | 80 | 30 | 200 ± 80 | 0.35 ± 0.13 |
| 6 | 80 | 30 | 200 ± 80 | 0.35 ± 0.13 |
| 7 | 80 | 50 | 180 ± 70 | 0.31 ± 0.12 |
| 8 | 130 | 50 | 140 ± 50 | 0.24 ± 0.09 |
3.2. MC modelling of the Mobetron 1000
3.2.1. Calculations of PDD and modelling the head of the Mobetron 1000
The parameters of the radiation beams obtained from the MC simulations are shown in table 8. Initially, the energy distributions obtained by Janssen et al 2008 [11] were adopted for both codes. However, since each code implements different physical models, it was necessary to use different values for each code.
Table 8. Energy parameters for the MC simulation.
| Mean energy (MeV) | Width (FWHM) (%) | |||
|---|---|---|---|---|
| Nominal energy (MeV) | Geant4 | Penelope2008 | Geant4 | Penelope2008 |
| 4 | 3.7 | 4.0 | 60 | 55 |
| 6 | 7.6 | 8.0 | 20 | 15 |
| 9 | 10.2 | 10.5 | 30 | 25 |
| 12 | 11.9 | 12.3 | 25 | 25 |
3.2.2. Photon and electron area dosimetry for the Mobetron
In table 9 we present the calculated air collision kerma values at the points indicated in table 1 around the Mobetron 1000 expressed as a fraction of the absorbed treatment dose at dmax for each energy (μGy Gy−1).
Table 9. Air collision kerma expressed as a fraction of the absorbed treatment dose at dmax (μGy Gy−1) at the locations indicated in table 1.
| Energy | ||||
|---|---|---|---|---|
| Positions Z (cm) | 6 MeV | 9 MeV | 12 MeV | |
| 80 | 67 ± 13 | 99 ± 20 | 96 ± 19 | |
| A | 130 | 43 ± 9 | 51 ± 10 | 42 ± 8 |
| 180 | 12 ± 3 | 11.8 ± 2.4 | 12 ± 2 | |
| 80 | 32 ± 6 | 44 ± 9 | 44 ± 9 | |
| B | 130 | 24 ± 5 | 29 ± 6 | 24 ± 5 |
| 180 | 9.4 ± 1.9 | 11.9 ± 2.4 | 9.6 ± 1.9 | |
| 80 | 43 ± 9 | 60 ± 12 | 62 ± 12 | |
| C | 130 | 31 ± 6 | 38 ± 8 | 30 ± 6 |
| 180 | 8.8 ± 1.8 | 8.4 ± 1.7 | 9.5 ± 1.9 | |
| 80 | 32 ± 6 | 44 ± 9 | 44 ± 9 | |
| D | 130 | 24 ± 5 | 27 ± 6 | 25 ± 5 |
| 180 | 9.2 ± 1.8 | 9.9 ± 2.0 | 8.9 ± 1.8 | |
| 80 | 0.16 ± 0.03 | 0.50 ± 0.10 | 0.22 ± 0.04 | |
| E | 130 | 0.19 ± 0.04 | 0.11 ± 0.02 | 0.42 ± 0.08 |
| 180 | 1.20 ± 0.24 | 1.4 ± 0.4 | 1.4 ± 0.3 | |
In order to analyse the dependence of the results on the shielding composition of the Mobetron 1000 used in the modelling, several simulations were made modifying the densities of the materials described in section 2.3.
Air collision kerma and ambient dose equivalent H*(10) values obtained from the MC simulation at the calculation points given in table 2 are given in tables 10 and 11, respectively. They are expressed in units of 10−3 μGy Gy−1 of absorbed dose at dmax for the applicator of 10 cm. An average energy value considering equal contribution of all energy beams is also obtained.
Table 10. Air collision kerma values calculated with MC at the locations given in table 2, expressed in units of 10−3 μGy Gy−1 of absorbed dose at dmax for the applicator of 10 cm.
| Air collision kerma (×10−3 μGy Gy−1) | |||||
|---|---|---|---|---|---|
| Locations | 4 MeV | 6 MeV | 9 MeV | 12 MeV | Average |
| Control | 140 ± 30 | 230 ± 50 | 300 ± 60 | 270 ± 50 | 240 ± 50 |
| OR | 20 ± 4 | 23 ± 5 | 30 ± 6 | 27 ± 5 | 25 ± 5 |
| Sterilization | 160 ± 30 | 240 ± 50 | 310 ± 60 | 280 ± 60 | 250 ± 50 |
| Corridor | 130 ± 30 | 220 ± 40 | 290 ± 60 | 270 ± 50 | 230 ± 50 |
| Ceiling | 3 ± 1 | 6 ± 1 | 8 ± 2 | 7 ± 1 | 6 ± 1 |
| Floor | 140 ± 30 | 430 ± 90 | 810 ± 160 | 940 ± 190 | 580 ± 120 |
Table 11. Ambient dose equivalent H*(10) values calculated with MC at the locations given in table 2, expressed in units of 10−3 μSv Gy−1 of absorbed dose at dmax for the applicator of 10 cm.
| Ambient dose equivalent H*(10)(×10−3 μSv Gy−1) | |||||
|---|---|---|---|---|---|
| Locations | 4 MeV | 6 MeV | 9 MeV | 12 MeV | Average |
| Control | 180 ± 40 | 300 ± 60 | 380 ± 80 | 360 ± 70 | 310 ± 60 |
| OR | 27 ± 5 | 35 ± 7 | 43 ± 9 | 39 ± 8 | 36 ± 7 |
| Sterilization | 200 ± 40 | 320 ± 60 | 420 ± 80 | 380 ± 80 | 330 ± 70 |
| Corridor | 180 ± 40 | 300 ± 60 | 390 ± 80 | 360 ± 70 | 310 ± 60 |
| Ceiling | 4 ± 1 | 6 ± 1 | 9 ± 2 | 8 ± 2 | 7 ± 1 |
| Floor | 170 ± 30 | 510 ± 100 | 950 ± 190 | 1090 ± 220 | 680 ± 140 |
In figure 6, we depict air collision kerma and absorbed dose for the y = 0 cm plane and for the 12 MeV case. It can be observed that in many locations around the Mobetron 1000 the dose component due to low energy electrons is 20 times larger than that of the photons.

Figure 6. Comparison for y = 0 cm and 12 MeV of: (a) air collision kerma. (b) Absorbed dose.
Download figure:
Standard image High-resolution image3.2.3. Neutron area dosimetry for the Mobetron
With respect to the MC simulations performed, the excessive computational time required makes a detailed MC simulation of this component impracticable. The reason is the very low numerical efficiency of the neutron production mechanism. For each 108 primary electrons only about 100 neutrons were produced, of that only one reach the measuring points. Therefore, although one could increase the simulation time, the calculated dose values would remain small as compared to the photon and electron component and the statistical uncertainties too large.
4. Discussion
The main objective of this work is to analyse the scattered radiation produced by the mobile accelerator Mobetron 1000. To do so, detailed MC simulations using two different codes, Penelope2008 and Geant4, have been performed. We have measured ambient dose equivalent, H*(10), for photons and electrons, outside of the OR and for neutrons around the Mobetron 1000. Discrepancies between calculated and measured dose values can be traced back to the importance of the radiation component due to low energy scattered electrons. Therefore, this study is a useful tool for the clinical user to investigate the radiation protection issues arising with the use of these accelerators in ORs without structural shielding. These results will also enable to better fix the maximum number of treatments that could be performed while insuring adequate radiological protection of workers and public in the hospital.
4.1. PDD and modelling the head of the Mobetron 1000
Taking into account the experimental uncertainty of the positioning of the diodes, that we estimate of ±0.15 cm, the data obtained with the MC simulations agree with the measured data, so that more than 94% of the points analysed are within the gamma criterion of 3%/3 mm deviation, usually used in comparisons in clinical dosimetry [30]. Discrepancies in the final fit could be attributed to a possible combination of inaccuracy in geometry and/or source [31] characterization (a detailed knowledge of the Mobetron 1000 geometry was not accessible to us and there may be a significant variation between machines) and the experimental uncertainty itself. Therefore, the agreement obtained after the adjustment of the parameters is acceptable for the purpose of using this MC model in the field of radiation protection.
No significant changes of the air collision kerma were observed by varying the densities of the shielding structures of the Mobetron 1000. The main reason for that comes from the fact that the MC simulation does not take into account the leakage radiation that occurs at the intersection of the acceleration sections. In fact, the MC simulation does not consider any interaction before the second scattering plane since the electrons in the accelerator cavity move in vacuum and the presence of the electromagnetic fields and accelerator cavities has not been considered. Therefore, since the shielding structures introduced in the modelling are mainly located in the upper part of the accelerator head, the approximations done about their components, dimensions, compositions, and geometry are not relevant and any observed difference between the calculated and measured values cannot be attributed to them.
4.2. Photon and electron area dosimetry
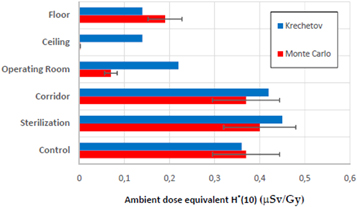
H*(10) MC values were compared with both the H*(10) measurements obtained on site and those published by Krechetov et al 2010 [21]. In both approaches, an H*(10) average of the four available energy beams was considered. The low energy electron component was excluded by interposing 6 cm of gypsum between the Mobetron 1000 and the detector used. Figure 7 compares H*(10) MC average value at the locations behind each barrier with the H*(10) Krechetov et al [21]. measurements. All values have been extrapolated using the inverse square law at the same distance, 3 m. Based on these results and a typical prescription of 15 Gy/patient, a maximum number of three treatments per week could be done while preserving the radiological limits for the public behind a barrier at such distance.
Figure 7. Comparison of H*(10) average MC data behind each structural barrier with H*(10) measurements from Krechetov et al [21]. All values have been extrapolated using the inverse square law at the same distance, 3 m.
Download figure:
Standard image High-resolution image
The comparison between our results and those reported by Krechetov et al [21] is not direct. Some comments are in order before undergoing such comparison. To carry out these MC simulations, a RW3 phantom has been used as scattering material while in the measurements taken from the literature the Mobetron 1000 quality control kit phantom is used instead of a more clinically realistic one. The Mobetron 1000 quality control phantom is smaller and allows obtaining the scattering on the patient more easily without a complicated experimental setup. To analyse the influence of the phantom, we have performed H*(10) measurements with both phantoms. The results are independent of the phantom used (see table 6).
The MC H*(10) values obtained at the corridor and control locations are the same. This pattern is consistent with the fact that the contribution of the leakage radiation coming from the intersection of the acceleration sections is very small. Therefore, the H*(10) values obtained will not be affected by the attenuation of the shielding structures located in the upper part of the head. However, the H*(10) measurements reported by Krechetov et al [21] do not show this symmetry.
At the OR location, H*(10) values obtained from the MC simulation and those obtained in the literature are both affected by the attenuation caused by the cabinet located behind the stand. The MC H*(10) values are much lower than those measured by Krechetov et al [21]. This suggests an over-attenuation of this component, which would require an adjustment of the density and composition of the material. In fact, in the approximation introduced in the modelling it has been considered solid and with a density of 3 g cm−3, without taking into account the gaps existing between the different structures inside the cabinet. MC simulations have been performed for the case of the 12 MeV electron beam varying the cabinet density in the range 1–8 g cm−3. No significant differences on the H*(10) values have been observed. This is due to the fact that the most important contribution to the H*(10) at this location comes from the acceleration intersection sections, and those were not taken into account in the MC calculations.
In the case of the Ceiling, all H*(10) measurements discussed in the literature consider only the minimum shielding for the attenuation of the scattered electrons. Such shielding corresponds to 6 cm of gypsum for Krechetov et al [21]. In our facility, the ceiling is made of 12 cm of concrete, and therefore the H*(10) values calculated are much smaller. For the Floor locations, H*(10) measurement both in this work and the literature has been performed behind the lower shielding, hence the effect of the concrete thickness is diminished and the agreement improves.
Daves and Mills, 2001 [32] measured air collision kerma inside the OR. The 3.2 cm of drywall used by Daves et al are insufficient to absorb the electron component and consequently the comparison with the air collision kerma values obtained here is uncertain. Krechetov et al [21] point out that 6 cm of gypsum board eliminates the effect of low penetrating radiation completely, while 4 cm of gypsum board shielding produced numbers 10%–40% higher for Hp(0.07) relative to Hp(10).
4.3. Neutron dosimetry
The H*(10) obtained at location number 8, at the height of the scattering plane, is compatible with 0.36 ± 0.10 μSv Gy−1 obtained by Loi et al [24]. Also, the H*(10) measured at 50 cm from the applicator axis (positions 4, 7, and 8) can be corrected with the inverse square law to the distance to 100 cm. In doing so, we obtain H*(10) values between 0.06 and 0.08 μSv Gy−1, which are similar to those reported in the literature. By comparing tables 5 and 7, we conclude that this component is of low relevance from the point of view of radiation protection in the Mobetron 1000.
Another interesting feature that can be observed in figure 6(b) is the absence of left–right asymmetry despite the fact that the accelerator head is not symmetric. See figure 4. This is consistent with the previous discussion about the minor role played by the leakage radiation emitted from the intersection of the acceleration sections, the volume where the shielding structures are located.
5. Conclusions
The feasibility of modelling the Mobetron accelerator head using state-of-the-art MC codes to obtain the distribution of the scattered radiation around the system has been demonstrated. The simulation performed constitutes the first theoretical study using MC techniques of the Mobetron 1000 in the field of radiation protection. The detailed modelling of the shielding structures in its head has been found to play a minor role on the results.
The neutron H*(10) values estimated and those measured show that it is not necessary to adopt any additional protection warning for this type of radiation. This fact, coupled with the need for exceedingly long calculation times, discourage the MC simulation of the neutron component.
The prevalence of low energy secondary electrons in the scattered radiation produced by the Mobetron 1000 has been theoretically verified. Such contribution is not relevant for shielding estimations or for evaluating the maximum workloads, since these electrons are attenuated in the structural barriers usually located in a typical OR.
The scattered radiation produced by the Mobetron 1000 has been analysed by MC simulation. This has proved to be a very useful tool for Mobetron 1000 users. Once the dimensions and structural shielding of the OR where the IORT is to be performed are known it is possible to use the calculated dose distributions to perform the safety study, an essential step during the commissioning of the equipment. Besides, the dose maps obtained are useful for checking the area dosimetry data obtained in the shielding verification.
Using this data, it will also be possible to evaluate a priori the suitability of any facilities before installing the radiotherapy equipment and to estimate the total dose in the adjoining room and the maximum number of treatments that could be done preserving the radiological protection of the workers in the OR.
Acknowledgments
F Ballester and J Vijande acknowledge financial support from the Universitat de València under project UV-INV-AE17-707705. We would like to thank Omar Keshek and Intraop Medical Corporation for providing us the data concerning the treatment head design of the Mobetron 1000.