
Abstract
Binding energies are traditionally simulated using cluster models by computation of each synthon for each individual co-crystal former. However, our investigation of the binding strengths using the electron localization function (ELF) reveals that these can be determined directly from the crystal supercell computations. We propose a new modeling protocol for the computation of physical binding energies directly from bulk simulations using ELF analysis. In this work, we establish a correlation between ELF values and binding energies calculated for co-crystals of 4-hydroxyphenylboronic acid (4HPBA) with four different aza donors using density functional theory with varying descriptions of dispersion. Boronic acids are gaining significant interest in the field of crystal engineering, but theoretical studies on their use in materials are still very limited. Here, we present a systematic investigation of the non-covalent interactions in experimentally realized co-crystals. Prior diffraction studies on these complexes have shown the competitive nature between the boronic acid functional group and the para-substituted phenolic group forming heteromeric interactions with aza donors. We determine the stability of the co-crystals by simulating their lattice energies, and the different dispersion descriptions show similar trends in lattice energies and lattice parameters. Our study bolsters the experimental observation of the boronic acid group as a competitive co-crystal former in addition to the well-studied phenolic group. Further research on correlating ELF values for physical binding could potentially transform this approach to a viable alternative for the computation of binding energies.
Export citation and abstract BibTeX RIS

Original content from this work may be used under the terms of the Creative Commons Attribution 4.0 license. Any further distribution of this work must maintain attribution to the author(s) and the title of the work, journal citation and DOI.
1. Introduction
Crystal engineering involves a thorough understanding of the many interactions present in the crystal structures, which is a key knowledge in the synthesis of new materials [1–3]. These interactions include those among molecular crystals such as co-crystals, polymorphs, salts, and others, which form supramolecular assemblies. As many physico-chemical properties of materials, such as solubility, stability, and fluorescence, are greatly influenced by the arrangement of molecules in their solid states, the study of crystal structures is crucially important in many fields, such as pharmaceutics [4–7], energy materials [8–10], organic electronics [11, 12], and others. The structures of molecular crystals are formed by non-covalent interactions such as ionic, dipole-dipole/Keesom, polarization, and dispersion, forming different types of physical binding. The study of such non-covalent interactions with accuracy and precision is key to understand the complex nature of these materials, which can subsequently be implemented to design new materials. An effective way to interpret and predict these interactions is through using appropriate computational methods, especially if generalized to the smallest structural unit formed by the known intermolecular interactions known as a 'supramolecular synthon' [13]. Supramolecular synthons are crucial when designing new molecular crystal with tailor-made properties [14–18].
To comply with traditional computational methods used to study co-crystals, we have computed binding energies between the crystal constituents using cluster models of the supramolecular synthons using experimental structures from diffraction data. The binding energy ( ) of the synthons was simulated by both density functional theory (DFT) and second-order Møller–Plesset perturbation theory (MP2). For monomers A and B forming a synthon, the binding energy (
 ) of the synthon was calculated according to

where  and
and  are the energy of monomers A and B respectively, and
  is the energy of the synthon in a cluster. There are several approaches which have been explored to study physical binding in matter including quantum theory of atoms in molecules (QTAIMs) proposed by Bader [19–21], charge density difference which studies electron density of the system in comparison to its constituents, and the non-covalent interaction index (NCI) [22, 23]. In this study we have explored the electron localization function (ELF) to compute the binding energy directly from the crystal structure computations [24–26]. We put special emphasis on comparing our computed binding energies with the binding strengths obtained through ELF analysis. In ELF analysis the interactions that are due to Keesom force (dipole–dipole attraction), such as hydrogen bonds, are characterized by a V-shaped minimum in the ELF-profile between the atoms involved. Here we explore using the ELF value at this minimum as a descriptor of the binding strength of physical binding and relate them to binding energies calculated using equation (1). Within QTAIM there is a method of estimating the binding energy for physical binding using the electron density at the bond critical point (BCP) suggested by Shahi and Arunan, [27] that was inspired by work of Koch et al [28]. This approach was also used by Romanova et al for different types of physical binding with good correlation [29]. We have used the ELF approach because we believe it gives a better description of binding strength since it gives such clear differences between chemical bonding (associated with an ELF maximum) and physical binding (that has an ELF minimum), while the electron density always has a minimum between atoms regardless of if they are chemically bound or its physical binding (the BCP). Another drawback with the electron density at the BCP is that it is minute, and variations in it will still affect the correlation with binding energies. Au contraire, the ELF varies between values close to zero and can be as large as 0.5 at the V-shaped touching point for physical bonding (see below). Our approach is an attempt that is similar to the NCI based analysis by Saleh et al correlating binding energies with the kinetic energy densities integrated over the volume enclosed by low-value reduced density gradient isosurfaces [30], which includes good correlation for hydrogen bonds.
The unit cell of molecular crystals often contains a large number of atoms; hence a balance between accuracy and the computational cost of their modeling is a delicate challenge. Electronic structure theory methods, such as post-Hartree–Fock methods [31–33], can predict material properties with very high accuracy, and quantum Monte Carlo methods [34–36] have been successfully used for benchmark systems. Even though these methods can compute electronic properties with high accuracy, they are highly demanding with regard to computational resources and are only applicable to small systems. On the other hand, molecular mechanics force fields can be used to compute the structure and mechanical properties of materials. Their application, using either tailor-made or generic force fields, have also been used to study molecular crystals [37–40], but force field approaches are highly system specific and have limited predictive power. Besides, molecular mechanics neither gives any information about electronic states nor electron density. Significant improvements in first-principles DFT has made it the electronic structure theory method of choice for the prediction of material properties [41–44].
Over the last couple of decades, DFT has been developed to include dispersion effects, which improves the description of all non-covalent interactions. Many methods are based on a posteriori corrections to existing functionals. These corrections include Grimme's pairwise approach, DFT-D [45, 46], DFT-vdW (Tkatchenko–Scheffler method) [47], and the exchange dipole moment method proposed by Becke and Johnson [31, 33, 48]. However, there are also non-local functionals developed to include dispersion in the exchange and correlation term directly, called vdW-DF methods [49, 50]. These functionals have been tested for their accuracy in computing lattice energies for benchmark systems for which experimental data is available [51].
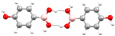
In this study, DFT methods with different types of descriptions to include dispersion have been used to study the lattice energies of co-crystals of 4-hydroxyphenylboronic acid (4HPBA) with four different aza donors (co-crystal formers). The boronic acid group (BA) is known to form motifs with other co-crystal formers that are dominated by the dipole–dipole/Keesom interactions usually called hydrogen-bonds (H-bonds), although these comprise strong physical binding [52–57]. BA shows flexibility in forming H-bonds and its orientation depends upon the complementary nature of the co-crystal former involved. This ability of BA to adopt different conformations depending upon the topology of the co-crystal former makes it an interesting candidate in crystal engineering (see figure 1).
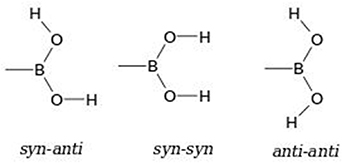
Figure 1. BA can adopt different conformations to interact with other co-crystal formers.
Download figure:
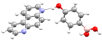
Standard image High-resolution imageEven though BAs have been used in crystal engineering and shown to form exotic architectures, the number of theoretical studies are still limited [58–64]. To use BAs as a precursor in the design of new materials, it is vital to understand the different interactions formed with the donor/acceptor sites of BA. In this work, some complexes involving 4HPBA are studied for their capability of establishing H-bonds with four co-crystal formers (see figure 2).
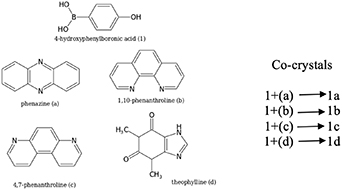
Figure 2. Structure of (1) 4-hydroxyphenylboronic acid (4HPBA) and co-crystal formers (a) phenazine, (b) 1,10-phenanthroline, (c) 4,7-phenanthroline, and (d) theophylline, and scheme of co-crystals studied including these (right).
Download figure:
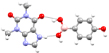
Standard image High-resolution imageThe experimental synthesis and characterization of the resulting co-crystals have already been published by one of the authors, Talwelkar Shimpi et al [54, 65] and the resulting structures are shown in figure 3. The experimental structure analysis revealed that the BA functional group forms strong intermolecular interactions with the other co-crystal formers and with the phenolic group present at the para position in 4HPBA. The present work extends this study by simulating the energetics for complexes 1a–1d.
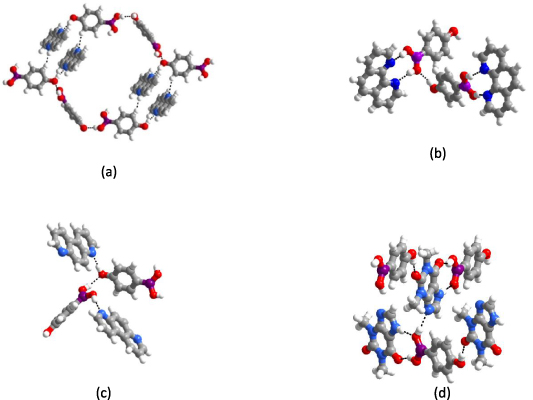
Figure 3. The supramolecular synthons present in the crystal structures of complexes 1a, 1b, 1c, and 1d in (a), (b), (c), and (d), respectively.
Download figure:
Standard image High-resolution imageIn this study, we have computed the lattice energies of the crystals using bulk models. The intermolecular interactions present in complexes 1a–1d were investigated by different descriptions of dispersion in DFT. They were further analyzed using the ELF that can be used to categorize the different types of non-covalent interactions present in the crystal structures. The lattice energies ( ) were calculated for the optimized crystal structures using,

where  is the total energy of the crystal, Z is the number of co-crystal molecule pairs present in the unit cell, and
  is the energy of each molecule constituent in the co-crystal molecular pair, all in their lowest energy configuration.
2. Computational methods
The lattice energy simulations were performed using the Vienna ab initio simulation package (VASP) [66] with the projector augmented wave method [67] and a range of different functionals. For the DFT-D a posteriori methods, the Perdew–Burke–Ernzerhof (PBE) [68] exchange and correlation functional was used. All the structural inputs were prepared using VESTA [69]. We have used a plane-wave cut-off energy of 900 eV and Gamma point k-mesh. The self-consistent electronic field was convergence to 10−6 eV. The structures were optimized until the forces were minimized to 10−5 eV Å−1 or less. For the simulations of the individual molecules the distance between periodic images was at least 12 Å apart with the same size and shape of the cell as the crystal. To include dispersion we used the Grimme DFT-D3 (PBE-D3) [45], DFT-D3 with Becke-Johnson damping (PBE-D3(BJ)) [70], the Tkatchenko-Scheffler methods (PBE-TSI and PBE-TSII) [47, 71], as well as the SCAN functional with rVV10 of Peng et al (SCAN) [72], and the vdW-DF functionals (vdW-DF(86), vdW-DF(88), and vdW-DF(PBE)) [49, 73] available in VASP.
For the calculation of individual binding energies, cluster calculations on supramolecular synthons were carried out using DFT with NWChem [74] and the 6-311++G(2d,2p) basis set, with corrections for basis set superposition error using the counterpoise method [75]. The synthon structures were taken from experimental high-resolution x-ray diffraction data (from [54, 65]), and in all cases the H-atom positions were optimized using PBE-D3 while keeping the heavy atoms fixed. To evaluate the effect of the functional on the binding energies, simulations were carried out using the two DFT hybrid functionals B3LYP [76] and PBE0 [77] as well as the GGA functional PBE96 [68, 78] as implemented in NWChem. The Gaussian code [79] was used for the MP2 calculations.
3. Results and discussion
The first step in calculations of the lattice energies is to obtain an optimized structure for the crystal with the lowest energy (Ebulk). To ensure the optimized structure we obtained is the minimal energy structure, all the parameters used in geometry optimizations were carefully explored. Hence, three approaches were used with respect to the variation of the lattice parameters, cell shape, and atomic positions during the optimization.
- (1)Atomic positions of atoms and the shape of the cell were allowed to vary while the cell volume was kept fixed. In these simulations, the cell volume was varied manually over a range of fixed volumes. The energy vs volume plot applying Vinet's equation of state was used to obtain the lowest energy structure (figure S1 in SI)).
- (2)All three degrees of freedom, atomic positions, cell shape, and cell volume were varied simultaneously.
- (3)An initial optimization was done for which only the atomic positions were allowed to vary. The resulting optimized structures were used for a second optimization where all degrees of freedom were allowed to vary.
The simulations with these three approaches were performed for four a posteriori semiempirical methods for inclusion of dispersion (PBE-D3, PBE-D3(BJ), PBE-TSI and PBE-TSII), and similar results were obtained with respect to cell volume and energy. Hence, only the results for the PBE-D3(BJ) method are given here (see table S1 in SI). The vdW-DF(86) and vdW-DF(88) functionals were not used, as they showed unexpected volume expansions. Since all three approaches give approximately the same structures and total energies, we have used the second approach in the remainder of the work.
The resulting lattice parameters for the different functionals are presented in table 1. For systems 1a–1d, the SCAN functional gives the most significant deviation from experiment, while vdW-DF(PBE) gives the smallest deviations. The other functionals fall in between these two. This is also reflected in the cell volume of the co-crystals (see table S2 in SI).
Table 1. The experimental and calculated lattice parameters (a, b, and c in Å, angle β expressed in 0) for complexes 1a–1d using different DFT dispersions.
| 1a | 1b | 1c | 1d | |||||||||||||
|---|---|---|---|---|---|---|---|---|---|---|---|---|---|---|---|---|
| a | b | c | β | a | b | c | β | a | b | c | β | a | b | c | β | |
| Exp. | 8.40 | 23.22 | 9.10 | 115.18 | 12.43 | 10.94 | 12.18 | 108.18 | 7.23 | 20.72 | 11.04 | 107.58 | 12.86 | 8.21 | 14.20 | 98.03 |
| SCAN | 7.99 | 22.21 | 8.85 | 113.45 | 12.09 | 10.48 | 11.68 | 107.62 | 7.55 | 19.53 | 10.15 | 103.97 | 13.01 | 7.51 | 13.87 | 98.17 |
| PBE-D3 | 8.27 | 22.92 | 9.05 | 114.78 | 12.22 | 10.99 | 12.06 | 107.98 | 7.67 | 20.30 | 10.54 | 105.04 | 12.85 | 8.09 | 14.11 | 98.28 |
| PBE-D3(BJ) | 8.21 | 22.90 | 9.01 | 114.63 | 12.21 | 10.91 | 12.02 | 107.86 | 7.65 | 20.28 | 10.45 | 104.08 | 12.83 | 8.06 | 14.09 | 97.95 |
| PBE-TSI | 8.18 | 22.82 | 9.03 | 114.88 | 12.28 | 10.77 | 11.99 | 107.68 | 7.41 | 20.35 | 10.68 | 105.12 | 13.05 | 7.88 | 14.04 | 98.71 |
| PBE-TSII | 8.22 | 22.96 | 8.98 | 114.50 | 12.33 | 10.81 | 12.07 | 107.76 | 7.50 | 20.35 | 10.65 | 104.78 | 12.85 | 8.1 | 14.06 | 98.29 |
| vdW-DF(86) | 8.14 | 22.62 | 8.99 | 113.90 | 12.20 | 10.78 | 11.89 | 106.74 | 7.54 | 20.25 | 10.42 | 103.67 | 13.12 | 7.78 | 13.88 | 100.61 |
| vdW-DF(88) | 8.17 | 22.51 | 8.99 | 113.92 | 12.19 | 10.75 | 11.85 | 106.85 | 7.49 | 20.25 | 10.48 | 104.21 | 12.97 | 7.86 | 13.89 | 101.67 |
| vdW-DF(PBE) | 8.29 | 23.17 | 9.04 | 114.19 | 12.35 | 10.95 | 12.09 | 107.55 | 7.64 | 20.50 | 10.60 | 104.60 | 13.02 | 8.05 | 14.13 | 99.84 |
With all the methods, the volume is smaller than in the experiment (except for two functionals for 1c), with vdW-DF(PBE) giving the closest agreement. However, the methods PBE-D3, PBE-D3(BJ) and PBE-TSI have deviations only marginally larger than vdW-DF(PBE). It is normal that the simulated volume decreases since it is without the effect of temperature. If vibrational contributions are added to account for temperature effects, the volume expands to values near the experimental ones. Since experimental sublimation data for the studied systems is not available in literature, we cannot make such corrections in this work. However, this study should be a good starting point for researchers who are interested in BA based co-crystals. The inclusion of thermal effects from theoretical vibrational simulations is computationally very demanding and will be left to future work.
Figure 4 compares the cell volumes obtained from optimizations with the different dispersion methods. All complexes, except 1c, show contraction in the volume compared to experiment. In the case of 1c, PBE-D3 shows an expansion in volume by 10 Å3 and vdW-DF(PBE) gives an expansion of 31 Å3.
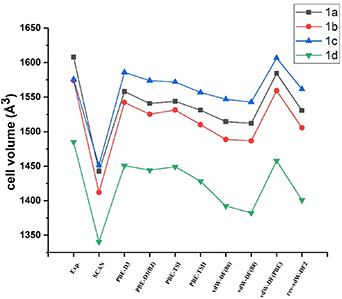
Figure 4. Graphical presentation of the choice of dispersion DFT method on the volume for 1a–1d.
Download figure:
Standard image High-resolution imageThe lattice energies of the co-crystals 1a–1d for the different DFT dispersion methods are given in table 2. Grimme's D3 method with (PBE-D3(BJ)) and without (PBE-D3) BJ damping, as well as rev-vdW-DF2 and SCAN, gives very similar values. Both TS methods, PBE-TSI and PBE-TSII, predicted almost identical lattice energies in all cases, and they are close to the values obtained using vdW-DF functionals of Langreth and Lundqvist et al. The 1d co-crystal has the lowest lattice energy among all, while 1a and 1c are close in energy. Even though 1d shows the highest stability, the energy difference between 1d and the other co-crystals is at most 10 kcal mol−1, which is not significant.
Table 2. The calculated lattice energies (in kcal mol−1) for 1a–1d using the different DFT dispersions.
| 1a | 1b | 1c | 1d | |
|---|---|---|---|---|
| SCAN | −62.18 | −67.57 | −61.82 | −71.09 |
| PBE-D3 | −63.65 | −68.91 | −64.73 | −70.73 |
| PBE-D3(BJ) | −62.56 | −68.02 | −63.61 | −68.68 |
| PBE-TSI | −71.93 | −76.09 | −71.83 | −77.60 |
| PBE-TSII | −72.05 | −77.01 | −71.66 | −77.43 |
| vdW-DF(86) | −75.40 | −80.32 | −75.02 | −83.08 |
| vdW-DF(88) | −75.89 | −81.00 | −75.53 | −84.79 |
| vdW-DF(PBE) | −74.35 | −79.35 | −74.37 | −83.10 |
| rev-vdW-DF2 | −62.32 | −67.23 | −62.37 | −71.02 |
The overall stability of the crystals depends upon the structural arrangement of the molecules within. The solid-state structure of molecular crystal comprises of periodically arranged molecules connected through different non-covalent interactions, dominated by H-bonds. Hence, it is essential to study how their structural motifs (synthons) interact to interpret the energetics within the crystal structures. We have simulated the binding energies of the synthons present in the complexes 1a–1d using DFT methods and MP2, with the structures taken from the experimental x-ray diffraction data from [54, 65] and the hydrogen positions were optimized using the PBE-D3 method. Different DFT-functionals have been compared with regard to their description of the binding energies. They include the DFT hybrid functionals B3LYP and PBE0, and the GGA functional PBE. To use the geometries obtained from experimental crystal structures and only optimize the H positions while keeping the heavy atoms fixed is the standard method of computing synthons in cluster models where the surrounding molecules has been removed. This is done to avoid changing the interaction under study when all other molecule–molecule interactions have been removed. In 1a, 1c, and 1d, the BA group adopts the energetically most favourable syn-anti conformation. Interestingly, it adopts the energetically less favourable 'syn-syn' conformation in the 1c co-crystal. All synthons present between the molecular constituents in 1a, 1b, 1c, and 1d are tabulated in table 3.
Table 3. Synthons present for 4HPBA homomeric interactions (BA with BA and phenolic with phenolic) and in the co-crystals 1a, 1b, 1c, and 1d. The H-atom of the phenolic group is named H, while the H-atom of BA is named Hb.
| Complex | Synthons | |||
|---|---|---|---|---|
| Homomeric interactions for 4HPBA |
 O-Hb⋯O O-Hb⋯O |
 O–H⋯O O–H⋯O | ||
| 1a |
 O-H⋯N O-H⋯N |
 phen⋯phen phen⋯phen |
 O-Hb⋯O2 O-Hb⋯O2
|
 O-Hb⋯O1 O-Hb⋯O1
|
| 1b |
 O–Hb⋯N O–Hb⋯N |
 O-H⋯O O-H⋯O |
 phen⋯phen phen⋯phen | |
| 1c |
 O–H⋯N O–H⋯N |
 O–Hb⋯N O–Hb⋯N |
 O-Hb⋯O O-Hb⋯O | |
| 1d |
 O–Hb⋯O and N–H⋯Oba O–Hb⋯O and N–H⋯Oba
|
 O-H⋯O O-H⋯O |
 O–Hb⋯N O–Hb⋯N | |
Table 4 gives the resulting binding energies for the supramolecular synthons given in table 3. All the studied synthons are bound, which justifies their formation. When two functional groups are available for the formation of heteromeric interactions, as in the case of 4HPBA, which group and how they couple in the resulting crystal structure depends on several factors such as the topology of both monomers, kinetics of the crystal formation, etc. However, a maximum number of strong interactions between the molecular constituents can be considered the main driving force in their formation.
Table 4. Hydrogen-bond distance in interaction D-H⋯A (Å), where D and A are the hydrogen bond donor and acceptor, respectively. The H-atom of the phenolic group is named H, while the H-atom of BA is named Hb. Binding energies are given in kcal mol−1.
| Complex | Interaction | H⋯A distance | Binding energies | |||
|---|---|---|---|---|---|---|
| B3LYP | PBE0 | PBE | MP2 | |||
| Homomeric interactions for 4HPBA | O–Hb⋯O | 1.98/1.99 | 10.96 | 10.74 | 11.02 | 12.72 |
| O–H⋯O | 2.10 | 6.47 | 6.48 | 6.36 | 8.58 | |
| 1a | O–Hb⋯O1 | 1.94 | 8.63 | 8.58 | 8.49 | 10.88 |
| O–Hb⋯O2 | 1.91 | 4.71 | 4.67 | 4.64 | 7.15 | |
| O–H⋯N | 1.81 | 11.86 | 11.92 | 11.20 | 14.80 | |
| π⋯π | 3.57 | 8.76 | 8.20 | 8.23 | 20.37 | |
| 1b | O–H⋯O | 1.89 | 7.34 | 7.37 | 7.49 | 9.07 |
| O–Hb⋯N | 1.92 | 19.21 | 19.37 | 18.93 | 22.53 | |
| π⋯π | 3.56 | 11.15 | 10.18 | 9.95 | 22.95 | |
| 1c | O–Hb⋯O | 1.96 | 4.98 | 4.90 | 4.92 | 7.24 |
| O–Hb⋯N | 1.97 | 10.72 | 10.56 | 11.00 | 13.02 | |
| O–H⋯N | 1.74 | 11.24 | 11.46 | 11.61 | 13.57 | |
| π⋯π | 3.56 | 11.11 | 10.32 | 10.25 | 22.78 | |
| 1d | N–H⋯O and O–Hb⋯O | 1.91 1.85 | 14.69 | 14.77 | 15.05 | 17.28 |
| O–H⋯O | 1.81 | 10.10 | 10.11 | 10.00 | 11.78 | |
| O–Hb⋯N | 2.02 | 8.49 | 8.67 | 8.75 | 10.70 | |
When comparing the results for the strength of interactions, all DFT functionals and MP2 show similar trends. Analysis of the interactions in the 1a–1d complexes show that the strength of the H-bonds formed by the 4HPBA phenolic group and the BA group with the different co-crystal formers varies with up to 6 kcal mol−1 (N.B. the O–Hb⋯N value in 1b results from two H-bonds), and either of them can be the strongest. However, the H-bonds involving the phenolic group are always the shortest. Even though it is relatively well known that the H-bond distance depends upon structural factors when compared between different complexes, it is clear that the H-bond length cannot alone be used to decide which H-bond is the strongest. In 1a, 1c, and 1d, the phenolic group has the shortest and strongest H-bonds, but in 1b, the phenolic groups have the shortest H-bonds, but the BA-groups H-bonds are the strongest (considering half the value for the O–Hb⋯N interaction in 1b).
The study of the individual synthons in 1a–1d has given new insights into understanding the energetics of the intermolecular interactions present in their crystal structures. In the complexes 1a–1c, π⋯π interactions are present between adjacent conformer molecules, which plays a significant role in the overall crystal structure stabilities. The π⋯π interaction strength is on par with the other interactions formed between BA and phenolic groups within the co-crystals. Another interesting synthon observed in this study is the catemeric interaction formed between the phenolic and BA groups of neighboring 4HPBA molecules (O–Hb⋯O2 in 1a, O–Hb⋯O in 1c). The strength of this interaction is weaker than the others, but it indeed plays a role in the crystal structure stability.
The different DFT methods give very similar binding energies for all synthons. Comparison between the DFT and MP2 shows that the B.E.s for the hydrogen bonds are similar, with MP2 values being lower by ca. 1–3 kcal mol−1. However, when π⋯π interactions are compared, the MP2 B.E.s are twice as strong as the DFT ones. It has been noted before in the literature that MP2 overestimates such dispersion interactions, and a similar trend has been observed here. This study aims to understand the intermolecular interactions using readily available electronic structure theory methods; hence, we have not used any improved MP2 methods explicitly developed to describe dispersion interactions.
To further analyze the non-covalent interactions formed between the molecular constituents in the co-crystals 1a–1d, we have analyzed their ELF. The ELF is often used to analyze covalent bonds through the localized electrons in the chemical bonds, but it can also be used for non-covalent interactions by the lack of localized electron regions between the atoms in question [80]. Figure 5(a) shows a representative 2D ELF plot for 1b (for the other co-crystals, 2D ELF plots are presented in the supplementary information). The BA group adopts the syn-syn conformation and interacts with b through an O-H⋯N H-bond, while the phenolic group at the para position interacts with a BA group in a neighboring 4HPBA through an O–H⋯O H-bond. All H-bonds are physical binding and do not show localized regions between the molecules (see figure 5(a)), but the absence of dark blue dividing bands (zero ELF) indicates they are strong. Comparison of the ELF between different H-bonds gives a direct interpretation of their nature and strength. From the 2D ELF in figure 5(a), one can see the proximity of the ELF basins between the molecules in the H-bonds, and such 'touches' indicate strong interactions. This creates a V-shaped minimum in the ELF-profile. When comparing the ELF value at these touches (minima) in the different H-bonds, one can see that the touch has a lower ELF value for the H-bond formed by the phenolic group than for the BA interaction, which indicates a weaker interaction. This analysis can be made quantitatively using the ELF profile of the H-bonds, which we explore in this work.
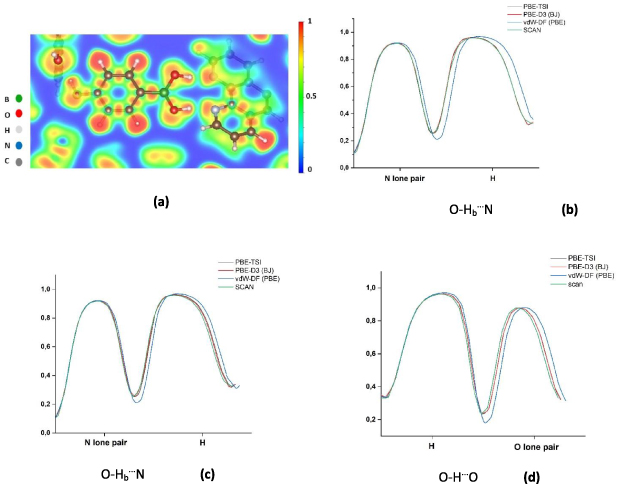
Figure 5. (a) 2D-ELF for co-crystal 1b in the plane of BA. (b), (c) and (d) ELF profiles along the three H-bonds with the different dispersion DFT methods SCAN, PBE-D3(BJ), PBE-TSI, and vdW-DF(PBE). The ELF value at the touching point in the center of the H-bond has defined the ELFx value. The H-atom of the phenolic group is named H, while the H-atom of BA is named Hb.
Download figure:
Standard image High-resolution imageFigures 5(b)–(d) shows the ELF profiles for the H-bonds present in co-crystal 1b for four representative dispersion DFT methods. For all four H-bonds, SCAN has the highest ELF value at the touching point, while vdW-DF(PBE) has the lowest. The other methods fall between these two values, and are generally very similar to the SCAN results. The ELF profile touching point values (the minimum defined as ELFx ) confirm that the H-bonds involving the BA group are both stronger than the phenolic H-bond, which was also concluded from the B.E.s (e.g. for PBE half of the O–Hb⋯N B.E. of 18.93 kcal mol−1 is larger than 7.49 kcal mol−1, the corresponding value for the O–H⋯O interaction).
In table S3 (presented in the supplementary information), we list the ELF values for the involved D-H⋯A touching points (ELFx ) for the supramolecular synthons using PBE-D3(BJ), which were retrieved directly from the crystal unit cell simulations. We propose to use equilibrium properties (ELF) to determine the H-bond binding energies between co-crystal formers. In the case of co-crystal 1c, where both the phenolic group and BA form hydrogen-bonds with aza donors, the O-H⋯N interaction formed with the phenolic group is stronger than that with BA using ELFx although they are of similar strength in the cluster B.E. calculations. However, with ELFx we get a similar strength for the O-H⋯N interaction for the phenolic group in 1c and 1a (0.50 and 0.46, respectively). The corresponding ELFx values involving BA (O-Hb⋯N) range between 0.20 and 0.28 (in 1b, 1c and 1d).
In table 5, we list the ELFx or the sum of several Σ(ELFx ) values (denoted ELFx /Σ(ELFx )) corresponding to the binding energies calculated the traditional way from the cluster models of the synthons based on experimental diffraction data structures for all atoms but the hydrogens, as listed in table 4. These different measures of binding strengths are plotted against each other in figure 6. From their linear relation, we have determined a scaling factor, f = 25.43, to convert ELFx /Σ(ELFx ) to binding energies (PBE values), which are also listed in table 5. The binding energy simulations for the isolated synthons from the experimental crystal structure involved restricted atomic positions and are only expected to give guiding values, which could be contributing to the relatively large spread of the values. Our limited data supports the use of one scaling factor, and division into O–H⋯N and O–H⋯O does not drastically change the spread or slope. This choice also ensures the inclusion of the origo, which is essential. On the other hand, with further parameterization of the scaling factor(s) f, the ELF analysis method could be developed to become a more practical tool to determine H-bond binding energies, as has been done using electron densities at the BCP [27–29] and the kinetic energy densities integrated over the volume enclosed by low-value reduced density gradient isosurfaces [30].

Figure 6. PBE cluster binding energies (Clust. B.E.) vs ELFx /Σ(ELFx ) for co-crystals 1a–1d. The linear scaling factor from the graph is 25.43.
Download figure:
Standard image High-resolution image
Table 5. Comparison of binding energies obtained from ELF values (B.E.) and obtained from cluster simulations (Clust. B.E.) in co-crystals 1a–1d for the synthons presented in table 3 and listed in table 4 (PBE values).
| Co-crystals | Synthons | ELFx /Σ(ELFx ) | B.E. = ELFx /Σ(ELFx )*f | Clust. B.E. |
|---|---|---|---|---|
| 1a | O–H⋯N | 0.46 | 11.698 | 11.2 |
| O–Hb⋯ O2 | 0.16 | 4.069 | 4.64 | |
| O–Hb⋯ O1 | 0.23 | 5.849 | 8.49 | |
| 1b | 2 × O–Hb⋯N | 0.52 | 13.223 | 18.93 |
| O–Hb⋯O | 0.24 | 6.1032 | 7.49 | |
| 1c | O–H⋯N | 0.50 | 12.715 | 11.61 |
| O–Hb⋯N | 0.28 | 7.120 | 11.00 | |
| O–Hb⋯O | 0.20 | 5.086 | 4.92 | |
| 1d | N–H⋯Oba + O–Hb⋯O | 0.33 | 8.392 | 15.05 |
| O–H⋯O | 0.24 | 6.103 | 10.00 | |
| O-Hb⋯N | 0.20 | 5.086 | 8.75 |
We can, thus, compute binding energies (B.E.s) from the ELF values of the touching points (ELFx ) using the scaling factor f determined from figure 6 according to:

There are two major advantages of determining the H-bond B.E.s through the suggested ELF analysis: the ELFx values of the touching points can be determined for each individual H-bond; And most importantly, the ELF analysis is made directly from the crystal structure and avoids complicated cluster computations of each synthon component in the co-crystal and each individual co-crystal former. Thus, the amount of simulations is reduced considerably. In addition, since no actual bond dissociation is computed, the ELFx values are free from (de)stabilization effects in the free constituents [81, 82], although such are expected to be small for H-bonds. Through further parameterization of scaling factor(s) for hydrogen bonds in the general case, the method of computing B.E.s using ELF analysis has the potential to reform the simulation of H-bond (physical binding) strengths directly from crystal structures in a variety of fields. However, we have not found a similar ELF-based parameter to determine the π⋯π interaction B.E.s.
4. Conclusions
In this study, we propose a modeling protocol for the computation of physical binding energies, in particular for H-bonds, directly from crystal structure simulations using ELF analysis, which offers a more convenient and precise binding energy determination than traditional methods. This resembles prior work based on the Bader analysis and the NCI analysis. The binding strengths of H-bonds have been computed from equilibrium crystal electronic structure properties, by considering the ELF-value at the acceptor–donor touching point along the interaction (minimum), which have been correlated with the binding energy computed from cluster simulations. Thus, the amount of simulations required to determine each H-bond binding energy has been reduced to one, namely the equilibrium crystal structure.
This study included a detailed structural analysis of four different molecular co-crystal complexes formed by 4HPBA with four different aza donors using electronic structure theory methods. We believe this study will stimulate more work to study and design new materials using BA as a precursor. The structural stability of the co-crystals was investigated by calculating their lattice energies, synthon binding energies, and ELF analysis of the non-covalent molecule-molecule interactions in the crystals. All dispersion DFT methods used show similar trends for the lattice energies and cell volumes. The co-crystal 1d has the highest lattice energy, which is attributed to stronger heteromeric interactions compared to the other complexes. The computed cell volumes were up to 12% smaller than the experimental room-temperature ones, but it is without incorporating zero-point energy vibration contributions. Our results could be used together with experimental sublimation enthalpy data to include vibrational contributions. Hence, more experiments are required for validation to further study the properties of these complexes.
The binding energies of the synthons present in the co-crystals 1a–1d support the use of BA as a co-crystal former in crystal engineering and material science. The choice of 4HPBA made it possible to compare the B.E.s of the synthons formed by BA with those formed by the phenolic group at the para position. We find that they have similar B.E.s and either of them can be the strongest, reflecting that BA can form strong and directional heteromeric interactions like that of the well-known phenolic group. Our binding energy study also showed that π⋯π interactions between the co-crystal formers involved in the complexes 1a, 1b, and 1d play significant roles in crystal structure stabilization.
Acknowledgments
We gratefully acknowledge financial support from the Knut and Alice Wallenberg Foundation and the Kempe Foundations. The computations were enabled by resources provided by the Swedish National Infrastructure for Computing (SNIC) at Umeå (HPC2N) and Linköping (NSC), partially funded by the Swedish Research Council through Grant Agreement No. 2018-05973. We dedicate this paper to the memory of our friend and co-worker, Professor Sven Öberg.
Data availability statement
All data that support the findings of this study are included within the article (and any supplementary files).
Supplementary data (1.0 MB DOCX)