

Abstract
Spinels (AB2O4) with magnetic ions occupying only the octahedral B sites have inherent magnetic frustration which inhibits magnetic long-range order (LRO) but may lead to exotic states. Here we report on the magnetic properties of the tetragonal spinel Zn0.8Cu0.2FeMnO4, the tetragonality resulting from the Jahn–Teller active Mn3+ ions. X-ray diffraction and x-ray photoelectron spectroscopy of the sample yielded the composition ( )A[
)A[ ]BO4‒δ. Analysis of the temperature dependence of magnetization (M), ac magnetic susceptibilities (χ' and χ''), dc susceptibility (χ), heat capacity Cp, and neutron diffraction (ND) measurements show complex temperature-dependent short-range order (SRO) but without LRO. The data of χ vs. T fits the Curie–Weiss law: χ = C/(T ‒ θ) from T = 250 K to 400 K with θ ≃ 185 K signifying dominant ferromagnetic (FM) coupling with the FM exchange constant J/kB = 17 K, and C = 3.29 emu K mol‒1 Oe‒1 yielding an effective magnetic moment µeff = 5.13 µB resulting from the high-spin states of Cu2+ (A site) and Fe2+ (B site), while the B site trivalent ions Mn3+ and Fe3+ are in their low-spin states. The extrapolated saturation magnetization obtained from the M vs. H data at T = 2 K is explained using the spin arrangement (Cu2+↓)A[Fe2+↑, Fe3+↓, Mn3+↑]B leading to FM clusters interact antiferromagnetically at low temperatures. Temperature dependence of d(χT)/dT shows the onset of ferrimagnetism below ∼100 K and peaks near 47 K and 24 K. The relaxation time τ obtained from temperature and frequency dependence of χ'' when fit to the power law and Vogel–Fulcher laws confirm the cluster spin-glass (SG) state. The magnetic field dependence of the SG temperature
  follows the equation:
 ![${T_{{\text{SG}}}}\left( H \right) = {T_{{\text{SG}}}}\left( 0 \right)\left[ {1 - A{H^{2/\phi }}} \right]$](https://content.cld.iop.org/journals/0953-8984/35/37/375802/revision2/cmacdbfaieqn4.gif) with TSG (0) = 46.6 K, A = 8.6 × 10‒3 Oe‒0.593 and
with TSG (0) = 46.6 K, A = 8.6 × 10‒3 Oe‒0.593 and  = 3.37. The temperature dependence of hysteresis loops yields coercivity HC∼ 3.8 kOe at 2 K without exchange-bias, but HC decreases with increase in T becoming zero above 24 K, the TSG(H) for H = 800 Oe. Variations of Cp vs. T from 2 K to 200 K in H= 0 and H= 90 kOe do not show any peak characteristic of LRO. However, after correcting for the lattice contribution, a broad weak peak typically of SRO becomes evident centered around 40 K. For T < 9 K, Cp varies as T2; a typical signature of spin-liquids (SLs). Comparison of the ND measurements at 1.7 K and 79.4 K shows absence of LRO. Time dependence of thermo-remanent magnetization MTRM(t) studies below 9 K reveal weakening of the inter-cluster interaction with increase in temperature. A summary of these results is that in Zn0.8Cu0.2FeMnO4, ferromagnetic clusters interact antiferromagnetically without LRO but producing a cluster SG state at TSG(0) = 46.6 K, followed by SL behavior below 9 K.
Export citation and abstract BibTeX RIS
1. Introduction
Frustrated magnetic materials as a special class different from ferromagnets, antiferromagnets, ferrimagnets and metamagnets was first noted in a review by Ramirez in 1994 [1]. A more recent review by Balents [2] describes how magnetic frustration resulting from competing exchange interactions among nearest neighbors (nn) that cannot be simultaneously satisfied due to geometry of the lattice can lead to exotic states such as spin-liquid (SL), spin-ice and magnetic monopoles. Such geometrical frustration is easily visualized on a triangular lattice with spin on each lattice point coupled to nn antiferromagnetically. In this case, all three spins cannot be antiparallel, leading to large degeneracy of the ground state and absence of long-range order (LRO). Lattices in two-dimension (2D) suitable for magnetic frustration are edge-sharing triangular lattice and corner-sharing Kagomé lattice with spins on each lattice point coupled with nn with antiferromagnetic (AFM) interaction [3–5]. In 3D, the corresponding lattices with magnetic frustration are edge sharing face-centered cubic (FCC) and corner-sharing Pyrochlore lattice [1].
Another class of materials with inherent magnetic frustration are spinels AB2O4 with cations occupying the 8 tetrahedral A sites and 16 octahedral B sites. As first noted by Anderson [6], spinels containing magnetic ions only on the B sites (with A sites occupied by non-magnetic ions such as Zn2+) should lack long-range magnetic order due to magnetic frustration. This is so because magnetic ions on the B site are arranged on corner-sharing tetrahedra, with the tetrahedra forming the FCC structure. This situation resembles the Pyrochlore lattice leading to magnetic frustration.
The idea of magnetic frustration in the spinel structure has been thoroughly tested in the spinel ZnFe2O4 = (Zn2+)A [2Fe3+]B O4 if the magnetic Fe3+ ions only occupy the B site. An early report by Lotgering [7] on the magnetic properties of an annealed polycrystalline sample of ZnFe2O4 (ZFO) showed a peak in the magnetic susceptibility χ vs. T at 15 K which was associated with the Néel temperature TN, possibly resulting from site inversion involving the presence of a fraction of Fe3+ on the A site. More recent detailed studies by Schiessel et al [8] on a polycrystalline ZFO employing neutron diffraction (ND), muon-spin rotation (µSR) and Mössbauer spectroscopy showed TN ≃ 10.5 K with LRO, although short-range order (SRO) was evident up to 10TN and even below TN, up to 20% of sample had SRO. In the recent χ vs. T studies in both polycrystalline [9] and single crystals of ZFO [10], a cusp has been reported near 11 K. The main conclusion from the neutron scattering experiments in the high-quality single crystal of ZFO was that there is no LRO in this system due to geometrical frustration and that ZFO is effectively a SL rather than a spin-glass (SG) [10]. The observed θ = 120 K from the Curie–Weiss variation: χ= C/(T ‒ θ) with C yielding effective magnetic moment µeff = 4.08 µB is due to dominant ferromagnetic (FM) nn exchange interaction [10], whereas the third-neighbor interaction J3 is AFM [11]. Further, the ratio of |J3/J1| is temperature dependent tending towards zero for T > 50 K [11]. However, the density functional theory (DFT) calculations of Cheng [12] reported all three exchange interactions J1, J2 and J3 to be AFM in both ZnFe2O4 and CdFe2O4 with J2 being much weaker than J1 and J3. These calculations, however, do not explain why θ = 120 K in ZFO is positive.
In more recent DFT studies in ZFO, Mel Quintero et al [13] predicted that in pristine ZFO, the ground state consists of several metastable states with different AFM ordering, all separated by an energy barrier ∼kB TF (TF ∼ 10 K is the freezing temperature), so that ZFO can be described as a spin glass below TF. In ZFO with defects (oxygen deficiency and cation inversion), the DFT calculations by Mel Quintero et al [14] predict the formation of local FM coupling between Fe ions leading to ferrimagnetic ordering in ZFO. In a stoichiometric single crystal of ZFO with minimal site disorder, recent detailed experimental investigations by Dronova et al [15] including ND, heat capacity and magnetic studies showed that these crystals have long-range AFM order with the Néel temperature TN = 9.9 K with short-range magnetic ordering persisting till ∼3TN. Also, the peak in the Cp vs. T data around TN in the single crystals with site disorder was observed to broaden out [15]. Dey et al [16] have also recently carried out magnetic and dielectric studies on polycrystalline ZFO sample prepared using solid-state reaction technique, which reports a glassy state with memory effects below TN ∼ 10 K and rhombohedral distortion near 110 K accompanied by spontaneous electric polarization. In the related cubic spinel GeCo2O4 = (Ge4+)A [2Co2+]B O4 with the similar Pyrochlore lattice as ZFO, and where the A site is also occupied only by non-magnetic Ge4+, recent DFT calculations showed J1 to be FM and considerably larger than AFM J2 and J3 [17]. In this system with observed AFM ordering below TN = 20.4 K, considerable amount of SRO was observed for temperatures up to 5TN. MgMnO3 is another cubic spinel but with the defect structure: 4 MgMnO3 = 3(Mg2+)A [Mg2+ 1/3Mn4+ 4/3Δ1/3]B O4 containing magnetic Mn4+ ions only on the B sites [18]. It also showed only SRO and absence of LRO, presumably due to magnetic frustration [18]. So, in cubic spinels with magnetic ions only on the B sites, magnetic frustration is inherently present, and the type of magnetic ordering is determined by nature of the magnetic ions on the B sites and degree of defects present in the spinel.
In contrast to the cubic spinel ZnFe2O4, ZnMn2O4 is a tetragonal spinel because of the presence of the Jahn–Teller (JT) active Mn3+ ions on the B site [19, 20] and specific heat Cp vs. T data in this system show a magnetic transition at TN ≃ 63 K. ND and µSR measurements in this system for T < TN show 2D correlations with full development of ordered magnetic moment due to single-ion anisotropy [19, 20].
In this paper, we present results on a sample consisting of intermediate composition between ZnFe2O4 and ZnMn2O4 since results on such systems have not yet been reported. Specifically, the investigated sample has the composition Zn0.8Cu0.2FeMnO4 in which we have also added JT-active Cu2+ ions to see the effect of magnetic dilution in addition to the effect of JT distortions of Mn3+ and Cu2+ ions. To arrive at this composition, a series of intermediate compositions of bulk ZnFe2−y Mny O4 (0 ⩽ y⩽ 2) were synthesized. The crystal structural analysis revealed cubic phase for y < 1, while the rest of the systems (1 ⩽ y ⩽ 2) stabilizes in the lower symmetry tetragonal crystal structure (I41/amd). Since, ZnFeMnO4 lies on the morphotropic phase boundary, it is diluted with 20% of the JT active Cu2+ ion with the motive to keep the tetragonality intact. As evident from the discussions given later, increasing the 'y' content will certainly not serve our purpose of achieving a magnetically diluted system essential for a SL state. Nevertheless, Cu2+ possesses greater importance in the sense that it alters normal ↔ mixed ↔ inverse spinel configuration of the overall system, simultaneously changing the dominant magnetic coupling to ferrimagnetic/ferromagnetic from AFM type. Therefore, incorporation of Cu2+ in its percolation limit serves the purpose dynamically. Detailed results only on one composition viz. Zn0.8Cu0.2FeMnO4 were carried out and presented here because of the extensive effort involved in such studies as described below.
After structural and elemental characterizations of this sample viz. Zn0.8Cu0.2FeMnO4, using x-ray diffraction (XRD) and x-ray photoelectron spectroscopy (XPS), respectively, temperature dependence of the ac and dc magnetic susceptibilities, ND and temperature dependence of specific heat studies were carried out. These studies show the absence of LRO in Zn0.8Cu0.2FeMnO4, but presence of SRO combined with cluster SG state near 47 K followed by SL state below 9 K. Details of these results and their discussion are presented in the following pages.
2. Materials and methodology
There are five important experimental parts in this work: (i) growth of the bulk samples using standard solid-state-reaction method, (ii) electronic and crystal-structure characterization, (iii) magnetic characterization, (iv) low-temperature heat-capacity measurements and (v) ND studies. For the synthesis of polycrystalline bulk samples of Zn0.8Cu0.2FeMnO4 (ZCFMO), we used high purity binary transition-metal oxides viz. zinc oxide (ZnO), copper oxide (CuO), ferric oxide (Fe2O3) and manganese (IV) oxide MnO2 as precursors. As an initial step, stoichiometric quantities of these oxides were mixed (ground) in an agate mortar with pestle for five hours which were then made into 13 mm diameter cylindrical pellets using a hydraulic press followed by multiple times sintering at 1200 °C for 8 h in air with 4 h rising time and natural cooling to room temperature (RT). For crystal structure analysis and determination of the phase purity of the sample, we used the x-ray diffractometer from Rigaku (Model: TTRAX III) with Cu-Kα radiation (λ = 1.54056 Å). The corresponding XRD patterns and their analysis using Rietveld refinement are discussed in next section. To understand the electronic structure and cationic distribution analysis we made XPS measurements using Thermo-Fisher Scientific 250Xi system. Detailed frequency and temperature dependence of dynamical magnetization studies were carried out using SQUID magnetometer, whereas for the dc magnetization measurements we employed a physical property measurement system (PPMS) from Quantum Design of Model DynaCool. The temperature dependent specific heat Cp (T) measurements were performed by means of a Quantum Design PPMS system using the standard heat-pulse calorimetry in the presence of both H = 0 and 90 kOe from 4 K to 200 K. Powder ND experiments on the polycrystalline Zn0.8Cu0.2FeMnO4 were carried out on the instrument E6 at the BER II reactor of the Helmholtz–Zentrum Berlin. This instrument uses a pyrolytic graphite monochromator selecting the neutron wavelength λ = 2.417 Å. Powder patterns were collected between the diffraction angles of 4.6° and 136°. The powder sample was placed in a cylindrical vanadium container with the dimensions d = 6 mm and h = 5 cm. Rietveld refinements were carried out with the program FullProf [21] using the nuclear scattering lengths b(O) = 5.805 fm, b(Mn) = −3.73 fm, b(Fe) = 9.54 fm, b(Cu) = 7.718 fm and b(Zn) = 5.68 fm [22].
3. Results and discussion
3.1. Structural and elemental information
The structural characterization of the prepared sample of Zn0.8Cu0.2FeMnO4 using x-ray and ND confirmed the monophasic nature of the sample. As evident in the x-ray pattern (figure 1) collected at RT (295 K), this compound exhibits the tetragonal spinel structure with lattice parameters a= 5.8390(7) Å and c = 8.8156(14) Å giving a c/a√2 ratio of 1.0676(3). For comparison, the parameter a= 8.52 Å was found for cubic ZnFe2O4 [10], and a= 5.72 Å and c = 9.245 Å has been reported for tetragonal ZnMn2O4 giving a c/a√2 ratio of 1.143 [20]. The elongation along the c direction results from the presence of JT active Mn3+ ions. However, this JT effect is also well established in Zn0.8Cu0.2FeMnO4, where the tetragonal distortion is smaller and therefore weaker pronounced than in ZnMn2O4. From our neutron data collected at 1.7 K it is found that the tetragonal splitting is slightly smaller than that obtained at RT leading to c/a√2 = 1.06054(10). Here, it is noted that no changes could be detected for Zn0.8Cu0.2FeMnO4 concerning the structural part between 1.7 K and 79.4 K. Further, our refinements revealed anisotropic peak broadenings, especially for the reflections (220) and (004). The fit could be improved by using strain parameter implemented in the FullProf suite [21]. Due to the better instrumental resolution of the x-ray data, the half widths could be determined more precisely. Interestingly, the best fit of the integrated intensities (shown in the inset in figure 1) could be obtained by using a Lorentzian peak shape.

Figure 1. The main panel shows the neutron powder diffraction pattern of bulk Zn0.8Cu0.2FeMnO4 collected at 1.7 K with λ = 2.417 Å along with its Rietveld refinement analysis. Rietveld refinement was also performed on the x-ray diffraction pattern obtained at 295 K (inset) for λ = 1.54056 Å showing better instrumental resolution of the 220 peak from the broader 004 peak. For both the patterns, satisfactory fits are obtained using a Lorentzian line shape. In the main panel, the calculated patterns (red solid line) are compared with the observations (black-filled circles); also shown are the positions of the nuclear (N) reflections (black bars) and the difference pattern (Iobs − Ical) (blue solid line) along with the positions of expected magnetic (M) reflections if long-range ordering were present. From the difference pattern, only a strongly broadened magnetic reflection is observed in the 2θ range between 20° and 40° close to the positions of the reflections (101), (002) and (110).
Download figure:
Standard image High-resolution imageTo obtain more information on the crystal structure properties we carried out Rietveld refinements of the powder ND pattern recorded at 1.7 K. Here, it is noted that the scattering power of oxygen is more pronounced in ND than in XRD which allowed us to determine its positional parameters with higher accuracy. Further, we can get important information on the distribution of the metal atoms Mn, Fe, Cu and Zn in the AO4 tetrahedra and BO6 octahedra since their neutron scattering lengths show considerable differences, whereas their x-ray form factors are very similar. A satisfactory fit can be obtained for refinements in the tetragonal space group I41/amd (No. 141, cell choice 2). The metal ions at the A and B sites are located at the Wyckoff sites 4b(0,¼,⅜) and 8c(0,0,0), respectively, and the O atom at the site 16h(0,y,z). The refinements resulted in a residual RF = 0.0155, where the occupancies of the A and B sites are initially allowed to vary using the constraints occ(CuA ) + occ(ZnA ) = 1 and occ(FeB ) + occ(MnB ). Here it has to be noted that the occupancies of the B site atoms Fe and Mn can be determined with much higher accuracy because of their strongly different neutron scattering lengths resulting in the values occ(FeB ) = 0.4986(10) and occ(MnB ) = 0.5014(10) which is very close to ratio of 1:1. Nonetheless, in the case of refinements of the occupancies at A site the difference of neutron scattering lengths of Cu and Zn are much smaller, resulting consequently in an enlarged standard deviation. This may also be the reasons that the occupancies are not in good agreement with the expected values as per the chemical stoichiometry, because of the dilute incorporation of Cu2+, where for occ(ZnA ) and occ(CuA ) the values 0.913(11) and 0.087(11) (instead of 0.8 and 0.2) are found, respectively. Therefore, we have inspected the possibility that Cu at the A site is fully or partially replaced either by Fe or Mn. In the next step we carried out a refinement, where Cu is partially replaced by Mn which has a negative neutron scattering length. In this refinement we have set occ(ZnA ) = 0.8 and occ(FeB ) = 0.5 as well as the constraints 2 × occ(CuB ) = occ(MnA ) and occ(CuA ) + occ(MnA ) = 0.2. Finally, we obtained the stoichiometry (Mn0.0128(18)Cu0.1872(18)Zn0.8)A [FeMn0.9872(18)Cu0.0128(18)]B O4. This would only give a replacement of Cu by Mn at the A site of 6.4%, which does not support existence of Mn at the A site. At this point feasibility of either of the chemical formula (Zn0.8Cu0.2)A [FeMn]B O4 and (Zn0.8Fe0.2)A [Cu0.2Fe0.8Mn]B O4 cannot be ruled out. If both Cu and Fe occupy the A site along with Zn, the following constraints are used: occ(ZnA ) = 0.8, occ(MnB ) = 0.5, 2 × occ(CuB ) = occ(FeA ) and occ(CuA ) + occ(FeA ) = 0.2. Finally, the refinements result in the occupancies occ(CuA ) = 0.214(4) and occ(FeA ) = −0.014. This is a strong indication that the A site is fully occupied with Zn and Cu whereas the B site with Fe and Mn giving the chemical formula (Zn0.8Cu0.2)A [FeMn]B O4.
The refinement of the structural parameters of Zn0.8Cu0.2FeMnO4 (table 1) revealed a strong elongation of the TB O6 octahedra, where the apical bond length dab (TB –O) = 2.1274(11) Å is somewhat larger than the equatorial one dc (TB –O) = 1.9752(7) Å which is finally the cause of the increase of the c/a√2. A similar trend was found recently for mixed spinel Ti0.6Mn0.4Co2O4, but weaker pronounced, having the bond lengths dc (TB –O) = 2.025(4) Å and dab (TB –O) = 1.998(2) Å despite the fact that the c/a√2 ratio is very close to 1 [23]. The enlarged c/a√2 of Zn0.8Cu0.2FeMnO4 also leads to an elongation of the TA O4 tetrahedra. Here the bond angle ∠c (O–A–O) = 107.76(8)°, having a bisector along the c axis, is slightly smaller than the ideal tetrahedron angle of 109.47°. More information about cation distribution and valence states of the determined interatomic T–O distances of Zn0.8Cu0.2FeMnO4 are compared with those obtained from the ionic radii given by Shannon [24]. It is noted that the ionic radius of Cu2+ (rCu2+ = 0.57 Å) is closer to the value of Zn2+ (rZn2+ = 0.6 Å) than to that of Fe3+ (rFe3+ = 0.49 Å). If one assumes that iron occupies the A site instead of Cu2+ it is more likely that iron is in the valence state 2+ (rFe2+ = 0.63 Å, high spin). With this insight, the bond length in the TA O4 tetrahedron is found to be d(TA –O) = 1.9667(10) Å. This value is somewhat smaller than the value 2.01 Å using the ionic radii of Shannon if the composition at the A site is Zn2+ 0.8Fe2+ 0.2. If the composition Zn2+ 0.8Cu2+ 0.2 (Zn2+ 0.8Fe3+ 0.2) is assumed the value 1.95 Å (1.87 Å) is obtained using the ionic radii of Shannon. Here, it is noted that the value 1.95 Å of the composition Zn2+ 0.8Cu2+ 0.2 is only slightly smaller than the refined bond distance d(TA –O) = 1.9667(10) Å. All these aspects again strongly indicate the chemical formula is simply (Zn0.8Cu0.2)A [FeMn]B O4 for which the cationic and spin states of all the individual atoms are determined below.
Table 1. Results of the Rietveld refinements of Zn0.8Cu0.2FeMnO4 at 1.7 K using neutron powder diffraction data collected on the instrument E6. The refinements were carried out in the tetragonal space group I41/amd (No. 141, cell choice 2). The metal ions at the A and B site are located at the Wyckoff sites 4b(0,¼,⅜) and 8c(0,0,0), and the O atom at the site 16h(0,y,z). Listed are the positional parameters y and z of the O atom, lattice parameters and the overall isotropic thermal parameter Bis. The obtained residual (RF = 0.0155) is defined as RF = ||Fobs | − |Fcalc ||/|Fobs |. Further the bond distances and angles in the TA O4 tetrahedra (TA = CuA , and ZnA ) and TB O6 octahedra (TB = MnB , and FeB ) are also given.
| Structure parameters | Bond distances and angles | ||
|---|---|---|---|
| y(O) | 0.52219(16) | d(TA –O) (Å) | 1.9667(10) |
| z(O) | 0.24257(13) | da (TB –O) (Å) | 1.9752(7) |
| Bis (Å2) | 0.55(4) | dc (TB –O) (Å) | 2.1274(11) |
| a (Å) | 5.8366(3) | ∠ab (O–A–O) (°) | 110.33(7) |
| c (Å) | 8.754(5) | ∠c (O–A–O) (°) | 107.76(8) |
| c/a√2 | 1.06054(10) | ∠ab (O–B–O) (°) | 84.63(3) |
| V (Å3) | 298.21(7) | ∠ac (O–B–O) (°) | 85.54(6) |
We also compare the determined bond distance in the TB O6 octahedron with that obtained with the ionic radii given by Shannon. Assuming a high- or low-spin state of both Mn3+ and Fe3+ one obtains the values 2.045 Å and 1.965 Å, respectively. In our study, we obtained the bond lengths dab (TB –O) and dc (TB –O) (see table 1) giving an averaged value of 2.026 Å that is closer to the value given above for the high-spin states. Interestingly, the Fe3+ ions in ZnFe2O4 carry at the B site a magnetic moment in the ordered state of 3.9 µB [25]. In Mn3O4, the ordered moment at this site is µtot = 3.55 µB [26]. For Zn0.8Cu0.2FeMnO4 no LRO occurs at 1.7 K as shown in the neutron powder diffraction pattern (figure 1), where the magnetic reflection is strongly broadened indicating the presence of a SG state. Using the moment values of ZnFe2O4 and Mn3O4 we can estimate for Zn0.8Cu0.2FeMnO4 a magnetic moment of 3.7 µB at the B site, which refers to a combination of both high- and low-spin states on the octahedral site.
To further confirm the electronic states and probe the elemental stoichiometry in detail, we performed the XPS measurements. The recorded XPS spectra for all the individual elements present in ZCFMO are plotted as a function of binding energy (in eV) as displayed in figure 2. Here the adventitious carbon (C-1s) peak at 284.8 eV was used as a charge reference to standardize the core level spectra of all the individual atoms namely: Cu-2p, Zn-2p, Fe-2p, O-1s and Mn-2p. Figure 2(a) shows the core level spectrum of Zn-2p which exhibits two sharp cusps centered across 1021 eV (2p3/2) and 1044 eV (2p1/2) with no signatures of additional satellite peaks. The energy difference between these two cusps (ΔZn-2p(1/2−3/2) ∼ 23 eV) confirms the divalent character of Zn in ZCFMO [27, 28]. Further, two humps are noticed in the core level XPS spectrum of Mn-2p (figure 2(b)) around 641.2 eV and 653.25 eV, associated with the 2p3/2 and 2p1/2, respectively, confirms the trivalent electronic state of Mn [23]. On the other hand, the XPS spectra of Fe-2p, depicted in figure 2(c), consists of at least four main peaks, which are deconvoluted into six number of peaks situated at 710.75 eV (F1), 712.9 eV (F2), 718.85 eV (F3), 725.1 eV (F4), 714.65 eV (S1) and 733.1 eV (S2). Here S1 and S2 are the satellite peaks corresponding to the shoulders noticed across the maximum intensity peaks of lower binding energies. The peak centered at F1 is associated with the 2p3/2 core level spectra of divalent Fe, while the peak located across F2 belongs to Fe3+ [29, 30]. Additionally, the spin–orbit splitting energy for these maxima are calculated to be Δ(F3 ‒ F1) ∼ 8.1 eV and Δ(F4 ‒ F2) ∼ 12.2 eV, which again confirms the mixed-valent character of Fe present in the ZCFMO system. The main panel data of figure 2(d) possesses a sharp peak across 529.75 eV pertaining to the O-1s spectra of ZCFMO. Whereas, the inset in figure 2(d) represents the XPS spectra of Cu which is comparatively weaker because of their dilute substitution in the spinel lattice. Nonetheless, we notice that the Cu-2p core level spectra has been deconvoluted into total four number of peaks: C1, C2, C3 and C4, in which the main cusps C1 and C2 are located at 933.45 eV and 953.6 eV, respectively, while the other two are satellite peaks situated at C3 ∼ 943.05 eV and C4 ∼ 961.75 eV. The spin-orbit splitting energy (ΔC) between the two main peaks (C1 and C2) is obtained to be 20.15 eV confirms the presence of Cu2+, which is further supported by the broad satellite peak across 943.05 eV [31, 32]. In summary, the results from the analysis of XRD and XPS lead to the chemical formula for Zn0.8Cu0.2FeMnO4 as ( )A
[
)A
[ ]B
O4‒δ
, with δ = 0.2 for reason of charge balance; for brevity, this is listed simply as ZCFMO in the rest of the paper.
]B
O4‒δ
, with δ = 0.2 for reason of charge balance; for brevity, this is listed simply as ZCFMO in the rest of the paper.

Figure 2. X-ray photoelectron spectra of bulk ZCFMO pellets sintered multiple times at 1200 °C for 8 h in air. The main panels of (a)–(c) shows the 2p core level spectra of Zn, Mn, and Fe, respectively, whereas the inset in (d) shows that for Cu. The main panel of (d) represents the XPS spectrum of O-1s.
Download figure:
Standard image High-resolution image3.2. Temperature and frequency dependence of ac susceptibilities
The temperature dependence of ac susceptibilities, χ' and χ'', of ZCFMO were measured at several frequencies f = 0.17–510 Hz with magnitude of ac field hac = 4 Oe and the dc field H = 0. For these measurements, the sample was cooled under H = 0 from 300 K to 4 K, known as the zero field cooled (ZFC) condition, followed by measuring χ' and χ'' with increasing temperature. In figure 3, results for a fixed frequency f = 17.13 Hz are presented which show only a single broad peak near 60 K for χ' vs. T whereas for χ'', there is a sharp peak near 47 K, with associated weaker broader peak near 63 K and a weaker peak near 9 K. In figure 4, temperature dependence of χ' and χ'' at various frequencies shows that with increase in frequency, the peak position of the 47 K peak shifts to higher temperatures.
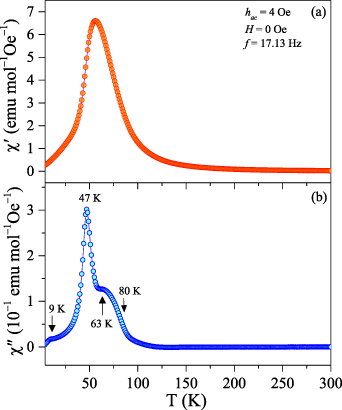
Figure 3. Temperature dependence of the ac susceptibilities χ' in (a) and χ'' in (b) measured at a fixed frequency of 17.13 Hz, hac = 4 Oe, and dc H = 0 Oe. The positions of the peaks observed in (b) are marked with additional discussion on them given in the text.
Download figure:
Standard image High-resolution image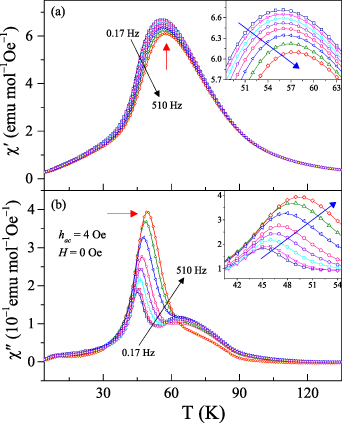
Figure 4. The temperature dependence (4 K ⩽ T ⩽ 135 K) of the ac magnetic susceptibilities χ' and χ'' for ZCFMO are shown in the panels (a) and (b), respectively, measured at several constant frequencies from 0.17 to 510 Hz in the presence of an applied 4 Oe ac magnetic field and zero dc bias. The insets show the zoomed images of the respective main panel data across the peak temperatures.
Download figure:
Standard image High-resolution imageThe temperature dependence of the peak near 9 K covering the temperature range from 4 K to 15 K for eight frequencies between 0.17 Hz and 510 Hz is shown in figure 5. From these results, the peak in the χ'' vs. T data is evident near 9 K, its peak position shifting to higher temperatures with increase in frequency. For the χ' vs. T data, there is a change in slope near 9 K, especially for higher frequencies.
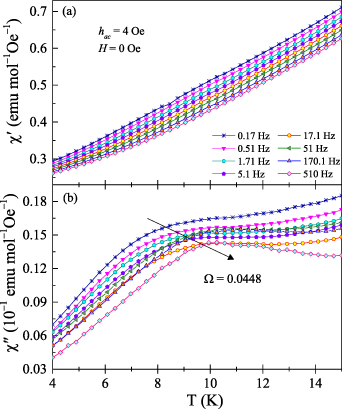
Figure 5. Temperature dependence of (a) χ'(T) and (b) χ''(T) data for ZCFMO measured with smaller temperature intervals in the range 4 K ⩽ T ⩽ 15 K under similar conditions as in figure 4 with the purpose to probe the nature of the anomaly across T = 9 K. The arrow indicates the direction of peak shift with increasing frequency.
Download figure:
Standard image High-resolution imageTo determine the origin of these peaks near 47 K and 9 K, the Mydosh parameter Ω given by [33, 34]

is determined from the χ'' data using f1 = 0.17 Hz and f2 = 510 Hz with Tf being the position of the peak. For the peak near 47 K, this analysis gives Ω = 0.0246, and for the peak near 9 K, similar analysis gives Ω = 0.0448. These magnitudes are considerably larger than Ω = 0.005 observed in canonical SGs but close to the magnitudes for cluster SGs [35–37], especially for the peak near 47 K. So, this peak near 47 K is determined to be due to cluster SG transition. Additional discussion on the nature of the peak near 9 K is presented later.
Another approach to verify the nature of SG transitions is to do scaling analysis using the Vogel–Fulcher law (VFL) given by equation (2) and the power law (PL) given by equation (3) [35],


In these equations, τ =1/(2πf) is determined from the positions of the peaks in the χ'' vs. T at different f, Ea is the activation energy, T0 represents the strength of inter-cluster interaction, TSG is the SG transition and zν is the dynamical critical exponent [38]. From equation (2), plot of Ln τ vs. 1/(Tf − T0) should yield a straight line with intercept Ln τ0 and slope Ea/kB. Similarly, from equation (3), plot of Ln τ vs. Ln [(Tf ‒ TSG)/TSG] should be linear with slope yielding zν. However, the optimum of T0 and TSG for such analysis is still not obvious.
In a recent paper from our group [39], we have presented a procedure to determine optimum magnitudes of T0 and TSG using an adjusted R2 method, noting that adjusted R2 = 1 for optimum values. In figure 6, we show the results of this procedure for the peak near 47 K by plotting adjusted R2 vs. different choices of TSG and T0 and determining the corresponding magnitudes of τ0, zν and Ea/kB. This analysis shows that the optimum TSG = 41.8 K with τ0 = (2.05 ± 0.34) × 10‒11 s and zν = 9.75 ± 0.08 for the fit to the PL and T0 = 36.8 K, τ0 = (6.0 ± 0.9) × 10‒11 s and Ea/kB = (195.1 ± 1.5) K for the fit to the VFL (figure 7). Since kB T0/Ea = 36.8/195.1 ≃ 0.19 is much less than unity, it shows that inter-cluster interaction is weaker than the energy barrier between clusters, leading to the cluster glass state without long range magnetic order. The magnitude of τ0 and zν are characteristic of SGs, although it is now realized that their magnitudes cannot be used to distinguish between cluster and canonical SGs [31, 39]. In summary, the magnitude of Ω = 0.0246, combined with kB T0/Ea ≪ 1 establishes this system as a cluster SG. The reason for the difference of TSG ≃ 41.8 K obtained from this procedure from 47 K is not yet clear. Our attempts to do this analysis using TSG near 47 K were not successful.
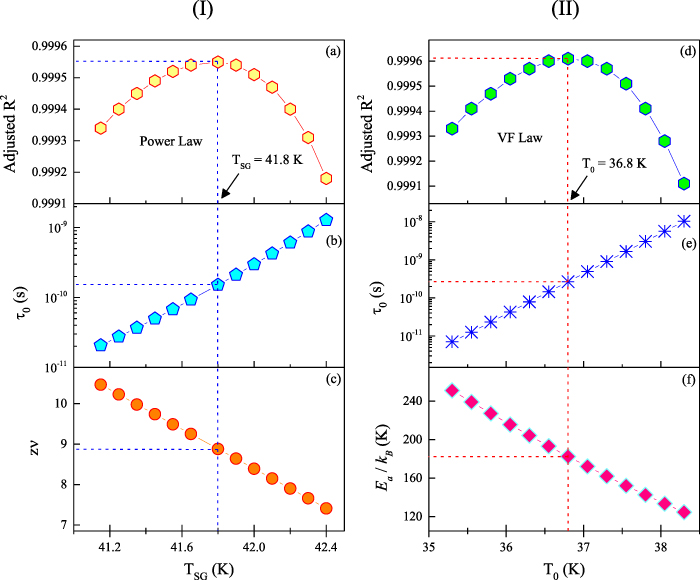
Figure 6. Fitting parameters: (a) adjusted R2, (b) characteristic relaxation time τ0 and (c) the critical exponent zν, obtained for different selections of TSG based on the power law, are given in the panel I. The panel II represents the fitting parameters: (d) adjusted R2, (e) τ0 and (f) activation energy Ea/kB, attained for different values of T0 following the Vogel–Fulcher (VF) law. The dotted lines are visual guides connecting among the sub-panels across the local maxima in the adjusted R2 value.
Download figure:
Standard image High-resolution image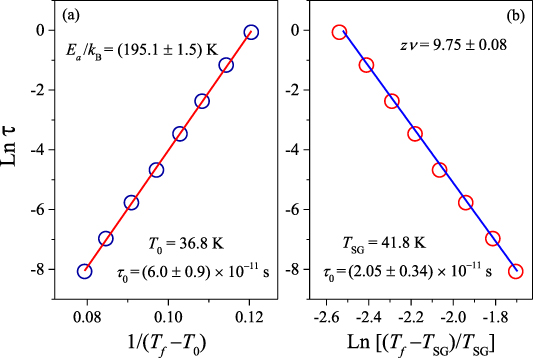
Figure 7. Variations of the relaxation time Ln τ against 1/(Tf − T0) in (a) for the fit to the VFL and against Ln [(Tf − TSG)/TSG] for the fit to PL in (b). The circles represent experimental points for the optimum magnitudes of T0 and TSG determined in figure 6. The solid lines represent the least-squares fit to the data with the magnitudes of the determined parameters listed in the figures.
Download figure:
Standard image High-resolution imageThe shift in the peak position of χ'' at 47 K with applied dc field H = 20, 50, 100, 200, 300 and 800 Oe is shown in figure 8(a). This shift is analyzed with the help of non-mean field theory (de Almeida–Thouless line (AT-line) analysis) described by the equation: ![${T_{{\text{SG}}}}\left( H \right) = {T_{{\text{SG}}}}\left( 0 \right)\left[ {1 - A{H^{2/\phi }}} \right]$](https://content.cld.iop.org/journals/0953-8984/35/37/375802/revision2/cmacdbfaieqn8.gif) where TSG(H) is the position of the peak in χ'' vs. T data in applied dc field H. The exponent φ= 3 for the AT-line pertains to the Ising system. Our fit in figure 8(b) yields φ= 3.37 not too different from the Ising case. In this plot, we have also plotted the shift in TSG(H) vs. H (figure 8(b)) determined from the inflection point in the plot of ∂χ/∂T vs. T where χ (=M/H) is the dc susceptibility measured in presence of different magnetic fields H. The details of these measurements and analysis are presented in the next section. It is noted that the broad peak near 63 K present in low H values in figure 8(a) effectively disappears in larger H values. So, this peak is likely due to some domain structure and no additional discussion is presented on this peak. Another notable point from the variation of TSG
vs. H in figure 8(b) is that for H = 800 Oe, TSG is lowered to about 25 K. Additional discussion on this is presented in the next section on the temperature and magnetic field dependence of magnetization measured under various applied magnetic fields H.
where TSG(H) is the position of the peak in χ'' vs. T data in applied dc field H. The exponent φ= 3 for the AT-line pertains to the Ising system. Our fit in figure 8(b) yields φ= 3.37 not too different from the Ising case. In this plot, we have also plotted the shift in TSG(H) vs. H (figure 8(b)) determined from the inflection point in the plot of ∂χ/∂T vs. T where χ (=M/H) is the dc susceptibility measured in presence of different magnetic fields H. The details of these measurements and analysis are presented in the next section. It is noted that the broad peak near 63 K present in low H values in figure 8(a) effectively disappears in larger H values. So, this peak is likely due to some domain structure and no additional discussion is presented on this peak. Another notable point from the variation of TSG
vs. H in figure 8(b) is that for H = 800 Oe, TSG is lowered to about 25 K. Additional discussion on this is presented in the next section on the temperature and magnetic field dependence of magnetization measured under various applied magnetic fields H.
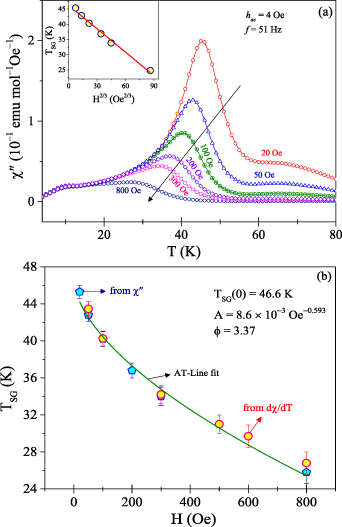
Figure 8. (a) Temperature dependence of χ''(T) measured at different dc applied fields 20 Oe ⩽ H ⩽ 800 Oe superimposed with hac = 4 Oe and a fixed f= 51 Hz. The arrow indicates the shifting of peak position towards lower temperature side with increase in H. (b) The field variation of TSG obtained from the dc magnetic measurements is fit to the equation: TSG (H) = TSG (0) [1 ‒ AH2/φ ] with the magnitudes of the parameters listed in the figure. In the inset of (a), the linear variation of TSG(H) against H2/3 is shown.
Download figure:
Standard image High-resolution image3.3. Temperature and magnetic field dependence of magnetization
The temperature dependence of the measured dc magnetic susceptibility (χ) for H = 500 Oe (up to 300 K) and H = 1 kOe (up to 400 K) is shown in figure 9. For T above ∼125 K, the two measurements coincide but for T < 125 K, χ at H = 1 kOe is noticeably lower than that at H = 500 Oe. Both data show peak near 60 K and a second inflection near 25 K. The χ vs. T data was fit to the modified Curie–Weiss (MCW) law: χ = χ0
+ C/(T ‒ θ), where χ0
= ‒1.14 × 10‒4 emu mol‒1 Oe‒1 was determined as the diamagnetic contribution based on the Hartree–Fock theory [40]. The plot of 1/(χ ‒ χ0) vs. T is shown in figure 10. The data fits the MCW law for T > 250 K quite well with significant deviations observed for T < 250 K. The fit yields C = 3.29 emu K mol‒1 Oe‒1 and θ ≃ 185 K. The positive θ signifies that the dominant exchange interaction in the system is FM. However, the magnitude of 1/(χ ‒ χ0) being higher than the MCW fit for T < 250 K signifies the presence of AFM interaction between the FM clusters. The magnitude of C = 3.29 emu K mol‒1 Oe‒1 is used to determine  yielding µeff = 5.13 µB. Using this value of µeff and the relation µeff/µB
=
g [S(S +1)]1/2, yields effective spin S = 2.11 for g = 2 for this system. This magnitude of µeff can be explained if the B site Fe3+ and Mn3+ ions are in the low spin configuration with µ = 1.73 µB for Fe3+ and µ = 2.828 µB for Mn3+ ions with effective spins S = 1/2 and S = 1, respectively. Fe2+ in the high spin state has S = 2. This yields (µeff/µB)2 = 0.2(1.9)2 + 0.4(4.9)2 + 0.6(1.73)2 + (2.828)2 = 20.12 or (µeff/µB) = 4.49. Here the values of spin-only moments are used, and so this may be the reason that the resultant theoretical moment (µeff≃ 4.5 µB) is slightly smaller than the moment µeff = 5.13 µB obtained from our susceptibility measurement. This also yields the B site moment µ ≃ 4.4 µB compared with µ ≃ 3.7 µB determined from the ND results discussed above.
yielding µeff = 5.13 µB. Using this value of µeff and the relation µeff/µB
=
g [S(S +1)]1/2, yields effective spin S = 2.11 for g = 2 for this system. This magnitude of µeff can be explained if the B site Fe3+ and Mn3+ ions are in the low spin configuration with µ = 1.73 µB for Fe3+ and µ = 2.828 µB for Mn3+ ions with effective spins S = 1/2 and S = 1, respectively. Fe2+ in the high spin state has S = 2. This yields (µeff/µB)2 = 0.2(1.9)2 + 0.4(4.9)2 + 0.6(1.73)2 + (2.828)2 = 20.12 or (µeff/µB) = 4.49. Here the values of spin-only moments are used, and so this may be the reason that the resultant theoretical moment (µeff≃ 4.5 µB) is slightly smaller than the moment µeff = 5.13 µB obtained from our susceptibility measurement. This also yields the B site moment µ ≃ 4.4 µB compared with µ ≃ 3.7 µB determined from the ND results discussed above.
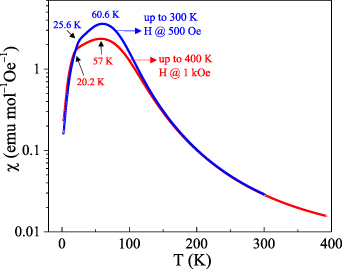
Figure 9. Temperature variation of dc magnetic susceptibility (χ) obtained for ZCFMO at H = 1 kOe (up to 400 K) and at H = 500 Oe (up to 300 K) along with the peak positions are indicated in both the curves.
Download figure:
Standard image High-resolution image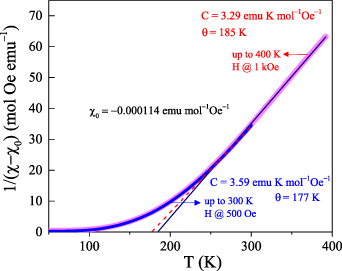
Figure 10. Temperature dependent inverse paramagnetic susceptibility 1/χp = 1/(χ ‒ χ0) plotted between the range of T = 50 K to 400 K at H = 1 kOe and up to 300 K at H = 500 Oe for ZCFMO. The solid and dashed line are the linear fits to the modified Curie–Weiss law: χ = χ0 + C/(T − θ) for the high temperature region with the magnitudes of C and θ listed in the figure.
Download figure:
Standard image High-resolution imageThe second test on the correctness of this ionic arrangement is the measured M vs. H at 2 K, shown in figure 11, and the estimated saturation magnetization MS ≃ 14000 emu mol−1 = 2.55 µB/f.u. The measured moment for each ion is gSZ . We take g = 2.2 for Cu2+ and g = 2 for Mn3+, Fe2+ and Fe3+ ions. This calculation yields µ = 2.78 µB for the arrangement (Cu2+↓)A [Fe2+↑, Fe3+↓, Mn3+↑]B close to the experimental value. Except for low-spin Fe3+, all the other magnetic ions located on the B site interact with dominant FM(↑) coupling, while the dilute Cu2+ on the A site couples antiferromagnetically. For µeff = 5.13 µB, effective S = 2.11 and using g = 2 should yield MS = gSµB = 4.22 µB, if all the moments are aligned parallel to each other. Our experimental value of MS ≃ 2.55 µB/f.u. indicates that all the moments are not aligned parallel to each other. Thus, this system is expected to have high degree of magnetic frustration as in the spinels ZnFe2O4 [8–11] and MgMnO3 [18], which also have magnetic ions only on the B site. The above analysis shows that ferromagnetically aligned spins of Fe2+ and Mn3+ have AFM interaction with the antiferromagnetically aligned spins of Fe3+ on the B site and dilute Cu2+ spins on the A site although the effect of Cu2+ is likely insignificant because of its low concentration. So, this system can be considered to have ferromagnetically aligned spin clusters mediated by antiferromagnetically aligned spins. With this insight, our measurements reported here on the ac and dc magnetic susceptibilities, ND and temperature dependence of the specific heat are interpreted in terms of SRO of FM clusters interacting antiferromagnetically but without the presence of long-range magnetic ordering. These considerations lead to complex magnetic ordering in ZCFMO including SG state near 47 K and SL state at lower temperatures, the latter discussed in more details later.
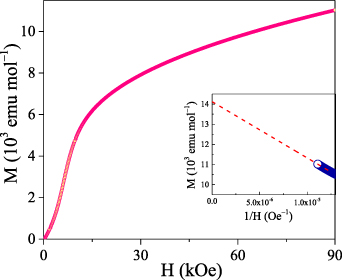
Figure 11. Plot of the measured magnetization M vs. applied field H with H up to 90 kOe at 2 K. The inset shows the high-field linear extrapolation of M to 1/H = 0 to estimate the saturation magnetization MS .
Download figure:
Standard image High-resolution imageThe temperature dependence of χ with H = 500 Oe and under the field cooled (FC) and ZFC protocols is shown in figure 12(a), clearly showing bifurcation of the two plots for T < 24 K along with a maximum across 60 K. It is known that in an antiferromagnet, the peak in χ vs. T does not represent magnetic ordering. Instead, it is the peak in ∂(χT)/∂T vs. T which corresponds to the Néel temperature as confirmed through peak in the specific heat versus temperature data [41, 42]. In ferromagnets, the negative peak in ∂χ/∂T vs. T is usually used as the magnetic ordering temperature [43, 44]. Because of the presence of both FM and AFM couplings in ZCFMO, the plots of both ∂(χT)/∂T vs. T and ∂χ/∂T vs. T are shown in figures 12(b) and (c), respectively. In figure 12(b), the peaks in ∂(χT)/∂T vs. T are observed at 97 K (negative peak), 47 K and 24 K whereas the positions of these peaks in ∂χ/∂T vs. T in figure 12(c) are shifted to lower temperatures by a few degrees. The peak near 97 K is associated with local FM ordering in clusters since its position shifts to higher temperatures with increase in applied H as expected in ferromagnets and ferrimagnets [45, 46]. Though the peak near 47 K coincides with the SG transition TSG observed in ac susceptibilities discussed in detail in section 3.2, the maximum at 60 K in figure 12(a) likely appears due to the crossover dynamics of domains owing to the rotational processes or wall displacements in ferrimagnets/ferromagnets [47, 48]. The peak near 24 K below which there is a bifurcation of χ(FC) and χ(ZFC) plots, is associated with the shift of TSG with applied H = 500 Oe as shown previously in figure 8(b). Interestingly, if we consider the local minima or the inflection point between the peaks 24 K and 47 K as TSG, which is obtained at 31 K based on the ∂χ/∂T vs. T plot, the results perfectly agree with the ac susceptibility results in figure 8(b).
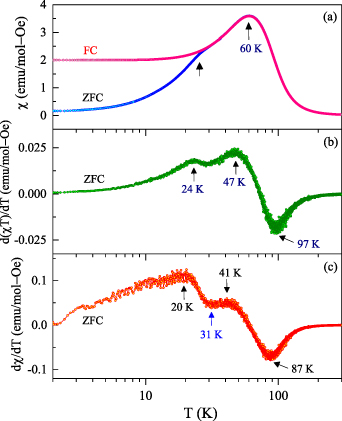
Figure 12. (a) DC magnetic susceptibility χ vs. T (log-scale) for H = 500 Oe under the zero-field-cooled (ZFC) and field-cooled (FC) protocols. (b) Plot of the computed ∂(χT)/∂T vs. T. (c) Plot of ∂χ/∂T vs. T. The positions of the peaks are listed, and their significance is discussed in the text.
Download figure:
Standard image High-resolution imageTo understand the transition near 24 K below which χ (FC) > χ(ZFC) in figure 12(a), we measured the temperature dependence of hysteresis loop parameters. The temperature dependence of the coercivity HC in the inset of figure 13 shows that for T > 24 K, HC goes to zero. This suggests that for T < 24 K, the system develops a partially ordered state in a magnetic field but without signatures of exchange-bias or loop shift like the situation in magnetically diluted system like Cox Mg1‒x O [49].

Figure 13. The M‒H hysteresis loop obtained at T = 2 K for the sample of ZCFMO under ZFC conditions. The inset shows the temperature dependence of the coercivity (HC ) acquired from the M−H loops measured at different temperatures.
Download figure:
Standard image High-resolution image3.4. Exchange constant
As noted earlier, the dominant exchange constant which governs the high temperature χ vs. T variation is FM. To determine this dominant exchange interaction, we followed the high temperature series expansion (HTSE) method, based on fitting the paramagnetic χp vs. T, prescribed for spinel structure following Heisenberg Hamiltonian [31, 50, 51]. This HTSE expression is given below:
Here, kB is the Boltzmann's constant, χp = χ ‒ χ0,
Ci
's are the normalized coefficients calculated up to 6th order as suggested by Schmidt et al using the parameter 'r
=
 ' in which µeff
= 5.13 µB is used as determined previously from the fit to MCW law. The coefficients obtained using this procedure are: C0
= 1, C1
= ‒13.2, C2
= 141.25, C3
= ‒1333.47, C4
= 11872.9, C5
= ‒104854.14, C6
= 934662. The fits of the χ vs. T data to equation (4) along with the fit to the MCW expression is shown in figure 14. The fit to HTSE represent only marginal improvement over the MCW fit and yield FM J/kB = 17 K. It is noted that retaining just the first two terms (C0 and C1) of the series yield the approximate MCW law and J/kB = 14 K using θ = 185 K. The departure of the fit from the experimental values at lower temperatures signifies the presence of AFM exchange interactions among FM clusters which are not considered in the above analysis because of the complexity of such calculations.
' in which µeff
= 5.13 µB is used as determined previously from the fit to MCW law. The coefficients obtained using this procedure are: C0
= 1, C1
= ‒13.2, C2
= 141.25, C3
= ‒1333.47, C4
= 11872.9, C5
= ‒104854.14, C6
= 934662. The fits of the χ vs. T data to equation (4) along with the fit to the MCW expression is shown in figure 14. The fit to HTSE represent only marginal improvement over the MCW fit and yield FM J/kB = 17 K. It is noted that retaining just the first two terms (C0 and C1) of the series yield the approximate MCW law and J/kB = 14 K using θ = 185 K. The departure of the fit from the experimental values at lower temperatures signifies the presence of AFM exchange interactions among FM clusters which are not considered in the above analysis because of the complexity of such calculations.
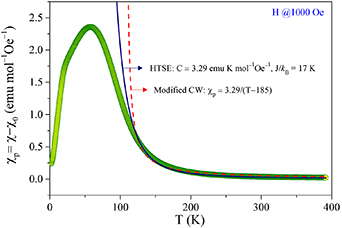
Figure 14. Temperature dependence of the dc paramagnetic susceptibility (χp = χ − χ0) measured under H = 1 kOe fitted to the high temperature series expansion (solid line) and the modified Curie–Weiss (dotted line) expressions. The magnitude of χ0 used here is obtained from the Hartree–Fock theory whereas C = 3.29 emu K mol‒1Oe‒1 and θ = 185 K are determined based on the analysis in figure 10.
Download figure:
Standard image High-resolution image3.5. Temperature dependence of specific heat
To investigate the long-range vs. shortrange magnetic ordering in ZCFMO, the thermal variation of its heat capacity Cp was measured from 2 K to 200 K under ZFC conditions in applied H = 0 and 90 kOe. This variation of Cp vs. T is shown in figure 15 along with the plot of ‒ΔCp = Cp (0) − Cp (90 kOe) vs. T. Although the magnitude of ‒ΔCp is comparatively small, it shows that applied H suppresses Cp with a peak in its magnitudes around 80 K. This variation is likely due to coupling of the FM clusters to the applied H. More importantly, in the Cp (0) vs. T data, a λ-type anomaly characteristic of LRO is not observed as often reported for second order magnetic transitions [39, 52]. However, lattice contribution to Cp must be first subtracted out from the measured Cp before any magnetic contribution to Cp can be ruled out. The Debye model of lattice specific heat CL which usually work quite well at lower temperatures yields the following expression for CL :

Figure 15. (a) Thermal variation of total specific heat (Cp ) measured under the application of constant magnetic fields (H = 0 and 90 kOe) up to T = 200 K. The inset represents the temperature dependence of Cp /T3 up to about 50 K. (b) The difference ‒ΔCp = Cp (0) − Cp (90 kOe) is plotted using same horizontal scale as the upper panel.
Download figure:
Standard image High-resolution imagewhere ΘD is the Debye temperature, usually determined from the fit to the data and R = 8.314 J mol‒1K‒1 is the gas constant. For low temperatures when T ≪ ΘD, so that the limit ΘD/T in the integral in equation (5) can be replaced by infinity, CL = 216 R (T/ΘD)3 is obtained for the lattice contribution. Therefore, in the case of only lattice contribution to Cp, Cp /T3 should yield a constant value at lower temperatures. In the inset of figure 15, the plot of Cp /T3 vs. T up to 45 K shows that below about 25 K, there is indeed some magnetic contribution to Cp, whereas for higher temperatures Cp tends to become constant. This also shows that for T > 45 K, a good fit of the Cp vs. T to equation (5) can be expected for a specific choice of ΘD. This fit of the Cp vs. T data for H = 0 Oe to equation (5) for ΘD = (376.2 ± 0.4) K is shown in figure 16 along with the temperature variation of the evaluated CM = Cp − CL , where CM is the magnetic contribution. The temperature variation of CM has a broad peak around 40 K which coincides with TSG determined from the analysis of the ac susceptibilities. This analysis confirms the presence of short range magnetic order associated with the cluster SG state.
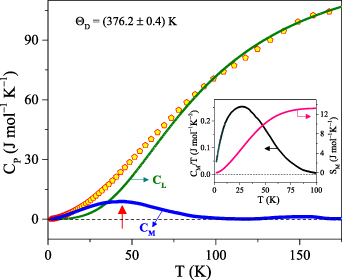
Figure 16. Temperature variation of the measured specific heat Cp for H = 0 Oe together with the temperature dependent contributions from the phonon contribution CL derived based on the Debye model of specific heat and the magnetic contribution CM = Cp − CL . The inset shows the temperature variations of CM /T and computed magnetic entropy (SM ).
Download figure:
Standard image High-resolution imageThe variation of CM vs. T is used to determine the change in temperature dependence of the magnetic entropy:
In the inset of figure 16, the thermal variation of CM /T and computed SM are shown. At 100 K, SM ≃ 13.1 J mol‒1K‒1 which effectively remains constant above 100 K. But with decrease in temperature, SM begins to decrease due to the onset of short-range magnetic ordering and SM approaches zero below 4 K. Using SM = R Ln(2S+ 1) = 13.1 yields effective S = 1.92 to be compared with S = 2.11 determined earlier from the analysis of paramagnetic susceptibility. Our system ZCFMO contains magnetic ions with S = 1/2, 1, and 2. So these composite values of S obtained from the analysis of magnetic susceptibility and specific heat are quite reasonable.
3.6. Spin-glass (SG) vs. spin-liquid (SL) state
The temperature variation of Cp at liquid helium temperatures has been used to distinguish between SG and SL states in magnetically diluted systems. In canonical glasses which contain only a few percent of magnetic ions, Cp is known to vary linearly with temperature [53]. However, in other diluted systems with magnetic frustration such as SrCr8Ga4O19 with Kagomé lattice [54, 55], NiGa2S4 with triangular lattice [56], CuCr0.7V0.3S2 [57], and even in Co based glassy systems Co2TiO4 and Co2SnO4 [58], Cp varying as T2 at low temperatures has been reported. This T2 variation of Cp is considered as a signature of SL state in which magnetic moments fluctuate dynamically at very low temperatures [53–58]. For the ZCFMO system, the variation of Cp = AT n is tested by plotting log Cp vs. log T in figure 17 for the data taken for both H = 0 and H = 90 kOe. For T < 9 K, the data fits straight line with n = 1.83 for H = 0 and n = 1.95 for H = 90 kOe, the slope becoming smaller at higher temperatures. This analysis suggests SG state for T > 9 K changes to SL like state for T < 9 K. The ND studies presented earlier in this paper provide additional support for the dynamical fluctuations of the magnetic moment for T < 9 K. In the ac susceptibility measurements shown earlier in figures 3 and 5, there is a clear peak near 9 K in the plot of χ'' vs. T. These results provide sufficient proof for the transition to different magnetic phase below 9 K which has known signatures of a SL state.
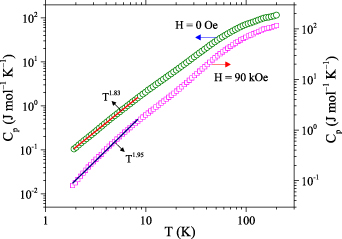
Figure 17. Log–log plot of the temperature dependence of the measured Cp (T) for both H = 0 and H = 90 kOe. The solid lines are linear fits to Cp ∼ ATn below 9 K with n = 1.83 for H = 0 and n = 1.95 for H = 90 kOe.
Download figure:
Standard image High-resolution imageAdditional information on the nature of magnetic ordering can be obtained by evaluating the change in magnetic entropy ΔSM = S(H) − S(0) with change in magnetic field H. Since increase (decrease) in entropy represents increase (decrease) in disorder, ΔSM is negative (and so −ΔSM is positive) in the paramagnetic, FM and ferrimagnetic states as applied H improves spin ordering and hence lowers entropy. The opposite is valid for the AFM and SG states. ΔSM can be determined from the M vs. H isotherms such as the one shown in figure 11 at 2 K using the Maxwell's equation [50]:
M vs. H isotherms were measured at many temperatures between 2 K and 200 K and the plot of ‒(ΔSM ) vs. T determined from these plots using second part of equation (7) is shown in figure 18. This analysis is also used to determine the magnetocaloric effect (MCE) in materials. As seen from figure 18, a crossover from positive (normal MCE) to negative (inverse MCE) value of ‒ΔSM is noticed across TSG, since with increase in H, magnetic disorder decreases in the paramagnetic region but increases in the SG regime. A further drop is observed below the SL transition TSL = 9 K. This analysis provides additional support for the SL state below 9 K.
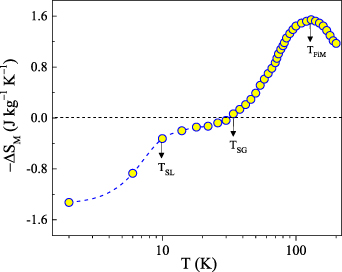
Figure 18. Temperature dependence of change in magnetic entropy i.e. −ΔSM computed from the M−H isotherms measured for the range 0 ⩽ H ⩽ 90 kOe and equation (6). The arrows mark the positions of the ferrimagnetic Néel temperature (TFiM), TSG and TSL discussed in the text.
Download figure:
Standard image High-resolution imageThe time dependent behavior of frustrated systems in the SL region has rarely been reported in the literature. So, a detailed analysis of the thermo-remanent magnetization (TRM) studies on the ZCFMO system in the SL region is provided below, and it is compared with that reported in literature for the SG region. For this purpose, the system was cooled to the required low temperature under H = 50 kOe, H was then set to zero and the magnetization (MTRM) was measured for a time (t) duration of 7600 s. The data is represented in figure 19 for the MTRM vs. T isotherm obtained at T = 5 K. The main panel data is analyzed by employing several typical scaling laws and/or power laws such as [59, 60]:


Figure 19. Relaxation of field-cooled (H = 50 kOe) magnetization of ZCFMO system measured for a duration of t = 7600 s at T = 5 K. The solid olive, navy and violet color lines represent fits of the experimental data to equations (8)–(10), respectively. The inset shows the main panel data in a log-linear (X‒Y axis) scale representation to identify the best fit to equation (10).
Download figure:
Standard image High-resolution imageIn the above expressions, M0 is the initial remanent magnetization, S stands for the magnetic viscosity, Mg denotes the glassy component of magnetization, whereas, τ and τp are the characteristic relaxation time constants. Here, the exponents α, β, and γ are constants out of which the former two are known as the Kohlrausch–Williams–Watt stretched exponents; usually these exponents are used to determine the strength of the dipolar interaction among the magnetic clusters [60–62]. The equations (8)–(10) all appear to fit well with the main panel data in figure 19, although, the best fit to the experimental data till the lowest measured time is obtained with only equation (10), which is confirmed from the logarithmic-time scale representation (inset of figure 19). However, our data does not fit to equation (11) for the expected range of β (0 ⩽ β ⩽ 1). Similar analysis was also performed for the MTRM vs. t isotherms obtained at T = 6 K, 8 K, 9 K, 10 K, 12 K and 15 K, and the extracted parameters (along with the corresponding standard uncertainties) are listed in table 2.
Table 2. List of the scaling laws and corresponding fitted parameters obtained from the thermo-remanent magnetization measurements across TSL.
| Scaling laws | Fitting parameters | T = 5 K | T = 6 K | T = 8 K | T = 9 K | T = 10 K | T = 12 K | T = 15 K |
|---|---|---|---|---|---|---|---|---|
| MTRM = M0 − S Lnt | M0 (emu mol−1) | 2310 ± 5 | 1871 ± 14 | 1802 ± 14 | 1962 ± 15 | 2141 ± 17 | 2283 ± 18 | (58 ± 0.01) × 10−1 |
| S (emu mol−1) | 46.4 ± 0.6 | 43.8 ± 1.7 | 32 ± 1.7 | 25 ± 1.9 | 19.3 ± 2.1 | 12.3 ± 2.2 | (30 ± 0.01) × 10−2 | |
MTRM
=
M0

| γ | (218 ± 0.5) × 10−4 | (259 ± 0.7) × 10−4 | (192 ± 0.3) × 10−4 | (134 ± 0.2) × 10−4 | (93 ± 0.1) × 10−4 | (55 ± 0.07) × 10−4 | (662 ± 0.7) × 10−4 |
MTRM
=
M0 exp[– ] ] | τ (s) | (2.92 ± 0.13) × 108 | (8.43 ± 0.35) × 107 | (9.67 ± 0.66) × 108 | (1.37 ± 0.1) × 1010 | (2.4 ± 0.22) × 1011 | (1.47 ± 0.17) × 1013 | (11.5 ± 0.05) × 104 |
| α | (15.2 ± 0.06) × 10−2 | (15.4 ± 0.06) × 10−2 | (14.8 ± 0.08) × 10−2 | (14.6 ± 0.07) × 10−2 | (14.3 ± 0.08) × 10−2 | (14 ± 0.08) × 10−2 | (17.7 ± 0.02) × 10−2 |
The fitting parameters are plotted against temperature in figure 20 for further analysis. Evidently, the magnitudes of M0 and τ falls drastically for T > 12 K while the exponents α and γ increase. It is noted that the values of all the fitted parameters obtained at 15 K are quite comparable to that observed in other SG systems like Nd5Ge3, PrRhSn3, U2PdSi3 etc in the SG domain [63–65], probably because the system is in the SG state at 15 K. However, for T < 12 K when transition to SL state begins, we notice significant deviation both in the magnitudes and trend followed by these curves. In SG systems, with increase in temperature, α increases (τ decreases) monotonically throughout the SG domain and also beyond TSG [63, 66, 67]. Similar pattern is exhibited by the ZCFMO system above ∼11.4 K, yet opposite trend is noticed below this temperature. According to the observations by Chu et al the slope change in the exponent may occur at a slightly higher temperature than where the change from the weak to strong irreversibility in magnetization takes place [67].

Figure 20. The parameters acquired based on the thermo-remanent magnetization analysis, listed in table 2, are plotted against temperature. The left-hand-scales in (a)–(c) shows the temperature variation of M0, τ and α, and the right-hand-scales of the same show the temperature dependency of S, ∂S/∂T and γ, respectively. The shaded portions separate the spin-liquid region (light pink color) from the spin-glass region (light blue color).
Download figure:
Standard image High-resolution image
The large magnitude of M0 in the SL region is likely due to the presence of FM clusters or uncompensated spins [50]. Usually, for systems with a uniform energy barrier, α = 1 indicates that the system has a single relaxation time constant, whereas α = 0 corresponds to the absence of relaxation. For systems having a distribution of energy barriers, α ranges between 0 and 1. The value of α acquired in our case suggests that the ZCFMO system evolves through several intermediate metastable states, hence the activation occurs against multiple anisotropic energy barriers [35]. Additionally, contrary to SG systems, where increase in the value of the exponent (α or γ) with increasing temperature in the SG region reflects the increase of magnetic inter-cluster interaction, we observe in figure 20 weakening of interaction between the clusters with rise in temperature in the SL region [62]. Typically, in the SG ordered region, the magnetic viscosity S increases with increase in T as a signature of the thermally activated process. However, in ZCFMO, decrease in S with increasing T in figure 20 reveals that the properties in the SL region are not governed by thermal activation [68]. In support of the above results, the differentiation analysis ∂S/∂T vs. T (figure 20(b)) exhibits a sharp minimum across 9 K, as the ZCFMO system undergoes SL to SG magnetic phase transition.
4. Concluding remarks
Main conclusions from the results presented here on the magnetic properties of structurally characterized spinel Zn0.8Cu0.2FeMnO4 = ( )A
[
)A
[ ]B
O4‒δ
are as follows. (i) The fit of the χ vs. T data to the CW law: χ = C/(T ‒ θ) from T = 250 K to 400 K with θ ≃ 185 K and its deviations from the CW law for T < 250 K suggests the presence of ferromagnetically-coupled clusters of spins interacting antiferromagnetically, with the FM exchange constant J/kB = 17 K. (ii) The temperature variation of the ac susceptibilities show SG transition whose position shifts to lower temperatures with the applied field H following the equation:
]B
O4‒δ
are as follows. (i) The fit of the χ vs. T data to the CW law: χ = C/(T ‒ θ) from T = 250 K to 400 K with θ ≃ 185 K and its deviations from the CW law for T < 250 K suggests the presence of ferromagnetically-coupled clusters of spins interacting antiferromagnetically, with the FM exchange constant J/kB = 17 K. (ii) The temperature variation of the ac susceptibilities show SG transition whose position shifts to lower temperatures with the applied field H following the equation: ![${T_{{\text{SG}}}}\left( H \right) = {T_{{\text{SG}}}}\left( 0 \right)\left[ {1 - A{H^{2/\phi }}} \right]$](https://content.cld.iop.org/journals/0953-8984/35/37/375802/revision2/cmacdbfaieqn15.gif) with TSG (0) = 46.6 K, A = 8.6 × 10‒3 Oe‒0.593 and
with TSG (0) = 46.6 K, A = 8.6 × 10‒3 Oe‒0.593 and  = 3.37. (iii) The analysis of the spin relaxation time τ obtained from the temperature and frequency dependence of ac magnetic susceptibilities in terms of the PL and VFL shows the presence of a cluster SG state at TSG. (iv) Measurements of the specific heat of Cp vs. T from 2 K to 200 K in H
= 0 and H
= 90 kOe do not show any peak characteristic of LRO. However, after correcting for the lattice contribution, a broad weak peak typical of SRO centered at ∼40 K becomes evident. (v) The presence of a weak peak in the χ'' vs. T data at TSL = 9 K and Cp
varying as T2 for T< TSL is used to conclude the presence of a SL state for T < TSL. (vi) Comparison of the ND measurements at 1.7 K and 79.4 K shows the absence of LRO but presence of SRO at 1.7 K, confirming the above results of TSG and TSL. (vii) The TRM studies reveal that, unlike the SG ordered region, the magnetic inter-cluster interaction weakens for T < 9 K as the properties do not obey thermal activation process in the SL region. (viii) These results show that in Zn0.8Cu0.2FeMnO4, FM clusters interact antiferromagnetically producing a cluster SG state at TSG followed by SL behavior below 9 K but without long range magnetic order. These interesting magnetic states observed here are a result of the magnetic frustration inherently present in the spinel structure when magnetic ions are located primarily on the octahedral B sites as in Zn0.8Cu0.2FeMnO4.
= 3.37. (iii) The analysis of the spin relaxation time τ obtained from the temperature and frequency dependence of ac magnetic susceptibilities in terms of the PL and VFL shows the presence of a cluster SG state at TSG. (iv) Measurements of the specific heat of Cp vs. T from 2 K to 200 K in H
= 0 and H
= 90 kOe do not show any peak characteristic of LRO. However, after correcting for the lattice contribution, a broad weak peak typical of SRO centered at ∼40 K becomes evident. (v) The presence of a weak peak in the χ'' vs. T data at TSL = 9 K and Cp
varying as T2 for T< TSL is used to conclude the presence of a SL state for T < TSL. (vi) Comparison of the ND measurements at 1.7 K and 79.4 K shows the absence of LRO but presence of SRO at 1.7 K, confirming the above results of TSG and TSL. (vii) The TRM studies reveal that, unlike the SG ordered region, the magnetic inter-cluster interaction weakens for T < 9 K as the properties do not obey thermal activation process in the SL region. (viii) These results show that in Zn0.8Cu0.2FeMnO4, FM clusters interact antiferromagnetically producing a cluster SG state at TSG followed by SL behavior below 9 K but without long range magnetic order. These interesting magnetic states observed here are a result of the magnetic frustration inherently present in the spinel structure when magnetic ions are located primarily on the octahedral B sites as in Zn0.8Cu0.2FeMnO4.
Acknowledgments
S K J acknowledges the FIST program of Department of Science and Technology (DST), India, for partial support of this work (Grant Nos. SR/FST/PSII-020/2009 and SR/FST/PSII-037/2016). S K J and S T acknowledge the Central Instruments Facility (CIF) of the Indian Institute of Technology Guwahati for partial support of this work. S T acknowledges the DST SERB Core Research Grant File No. CRG/2022/006155 for the partial support of this work. T S acknowledges financial support from the Swedish Research Council (VR Grant No. 2021-03675).
Data availability statement
All data that support the findings of this study are included within the article (and any supplementary files).