

Abstract
Na2Ni2TeO6 has a layered hexagonal structure with a honeycomb lattice constituted by Ni2+ and a chiral charge distribution of Na+ that resides between the Ni layers. In the present work, the antiferromagnetic (AFM) transition temperature of Na2Ni2TeO6 is confirmed at TN ≈ 27 K, and further, it is found to be robust up to 8 T magnetic field and 1.2 GPa external pressure; and, without any frequency-dependence. Slight deviations from nominal Na-content (up to 5%) does not seem to influence the magnetic transition temperature, TN. Isothermal magnetization curves remain almost linear up to 13 T. Our analysis of neutron diffraction data shows that the magnetic structure of Na2Ni2TeO6 is faithfully described by a model consisting of two phases described by the commensurate wave vectors  ,
,  and
and  , with an additional short-range order component incorporated in to the latter phase. Consequently, a zig-zag long-range ordered magnetic phase of Ni2+ results in the compound, mixed with a short-range ordered phase, which is supported by our specific heat data. Theoretical computations based on density functional theory predict predominantly in-plane magnetic exchange interactions that conform to a J1–J2–J3 model with a strong J3 term. The computationally predicted parameters lead to a reliable estimate for TN and the experimentally observed zig-zag magnetic structure. A spin wave excitation in Na2Ni2TeO6 at E ≈ 5 meV at T = 5 K is mapped out through inelastic neutron scattering experiments, which is reproduced by linear spin wave theory calculations using the J values from our computations. Our specific heat data and inelastic neutron scattering data strongly indicate the presence of short-range spin correlations, at T > TN, stemming from incipient AFM clusters.
Export citation and abstract BibTeX RIS
1. Introduction
Correlated oxides in which transition metal atoms arrange into honeycomb lattices give rise to novel magnetic ground states owing to the physics of low-dimensionality, frustration and spin–orbit coupling (SOC). Recent interest in honeycomb magnets stem from the connection to Kitaev model [1], where bond-dependent exchange interactions can result in the emergence of fascinating quasiparticles [2–5], possibility of fractional excitations or ultralow thermal conductivity in a spin liquid state [6, 7], to name a few. While the Kitaev model relies on directional exchange, several honeycombs have been studied by incorporating nearest-neighbour or next-nearest-neighbour exchange interactions. The J1–J2–J3 exchange model on a honeycomb lattice is one such with a rich magnetic phase diagram as a function of the J values, where, under suitable conditions, quantum phases can emerge [8]. The J1–J2–J3 model supports a classical spin liquid and is found to apply to several honeycomb magnets [9, 10].
There are a few layered magnets which, in addition to having a frustrated honeycomb lattice, show interesting structural features owing to alkali metal intercalants with high ionic conductivity. One such class is the relatively new honeycomb family of compounds with the general formula  where A = Li, Na, K etc, M = Mn, Fe, Co, Ni, Cu etc, X = Te, Sb, Bi, with alkaline Earth layers in-between the transition metal honeycomb layers [11–13]. Though the magnetic lattice retains its rigidity in these structures, the interlayer alkaline Earth layers are soft and mobile. Strong ionic conductivity of Li or Na is reported in many of these compounds making them suitable for all-solid-state sodium batteries, promising for energy storage [14, 15]. Significant ionic conductivity of Na in layered compounds will find device application as battery cathodes or electrolytes.
Na2Ni2TeO6 is an example of the above-mentioned category of honeycombs, crystallizing in P63/mcm space group, where Na+ ions occupy three different crystallographic positions at 6g (0.35, 0, 0.25), 4c (0.3336, 0.6667, 0.25), and 2a (0, 0, 0.25) forming a chiral structure in the in-between layers of Ni honeycombs [12, 16]. The crystal structure of Na2Ni2TeO6 has a two dimensional network of Ni honeycombs with edge-sharing (Ni/Te)O6 octahedra with a Na monolayer that is sandwiched between them. The Ni2+ honeycomb lattice reportedly orders antiferromagnetically at TN ≈ 27 K [13, 16, 18, 19], however, the magnetic anomaly at 27 K is influenced by the Na content in the compound such that transition temperatures ranging from 22 K to 34 K have been reported [11, 16]. The magnetic structure of Na2Ni2TeO6 is reported to consist of a commensurate and an incommensurate phase, both of which undergo ordering at the same TN [16, 19]. The commensurate magnetic order is characterized by an ordering wavevector  and the incommensurate,
  . The
. The  of Na2Ni2TeO6 is similar to what has been observed in similar compounds like Na2Co2TeO6 [10]. A close connection between Na content and the commensurate/incommensurate magnetic transition has been speculated based on the observation of diminished TN (22 K) in Na2Ni2TeO6 crystals where Na content is 2.16 [16], thus, it can be assumed that oxygen and/or Na off-stoichiometry plays a role in the development of incommensurate phase. The long-range ordered magnetic structure of Na2Ni2TeO6 conforms to a zig-zag structure of ferromagnetic (FM) chains of Ni2+. This was obtained by taking into account the FM interaction between the nearest Ni atoms, antiferromagnetic (AFM) next-nearest neighbours and a weak AFM between the Ni layers. The relevant exchange strengths were estimated as J1 (Ni–O–Ni) = 1.7 K, J2 (Ni–O...O–Ni) = −13.47 K and J3 (interlayer) = −0.87 K [16]. Though the quasi-two dimensional nature of the Ni2+ sublattice in Na2Ni2TeO6 was clear from diffraction studies [16], polarized neutron scattering has brought out clear evidence for the diffuse magnetic component due to the incommensurate magnetic phase [19]. Spin correlations present above the TN were mapped through XYZ polarization analysis and have reinforced their two-dimensional natures.
We present a detailed analysis of the magnetic structure of Na2Ni2TeO6 by combining neutron powder diffraction and density functional theory (DFT) estimates of exchange constants. Our results indicate in-plane exchange constants, with a strong third-nearest-neighbour term which explains the observed structure. The results from our inelastic neutron scattering experiments reveal the magnetic excitations in Na2Ni2TeO6; which are explained based on the DFT results of Ji values (figure 1).
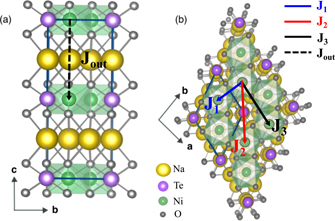
Figure 1. (a) The crystal structure of Na2Ni2TeO6 in hexagonal P63/mcm space group setting (prepared using VESTA [17]). (b) The arrangement of Ni atoms (green spheres) in the ac plane. The (Ni/Te)O6 octahedra are separated by Na (yellow spheres) layers. The exchange interactions are indicated using solid arrows of different colors.
Download figure:
Standard image High-resolution image2. Methods
2.1. Experimental techniques
Na2Ni2TeO6 powder samples for the present study were synthesized using a standard solid state reaction [13, 16]. NaCO3, NiO, TeO2 (4N or higher purity) purchased from Sigma Aldrich 7 were used for the synthesis. The chemical and crystalline quality of the synthesized samples of Na2Ni2TeO6 were estimated by taking powder x-ray diffraction (PXRD) using a PAN'lytical Empyrean diffractometer with Cu Kα radiation (λ = 1.5406 Å). Synchrotron x-ray diffraction experiments were performed at the beamline 11-BM, APS. Rietveld refinements [20] using Fullprof suite of programs [21] were performed for structural and phase analysis. Inductively coupled plasma—mass spectroscopy was performed to obtain average chemical composition of the synthesized samples. Solid samples were dissolved in a 1:1:0.3 mixture of H2O:HNO3:HCl with heating. The resulting solutions were diluted and analyzed on a PerkinElmer NexION 300X ICP-MS. Calibration and internal standards were prepared from high purity standards single- and multi-element stock solutions. Internal standards Be, Sc, In, Tl were used for normalization. DC magnetic susceptibility of the samples were recorded using quantum design physical property measurement system (PPMS) equipped with a vibrating sample magnetometer option. AC and DC magnetic susceptibility of the samples were additionally recorded using quantum MPMS magnetometer. The hydrostatic pressure was applied using the beryllium-copper pressure cell with Daphne 7373 oil as a pressure transmitting medium. The pressure value was determined from the measurement of the superconducting transition temperature of a Pb sensor placed inside the cell. Specific heat was measured using the relaxation time technique in the PPMS from quantum design. The specific heat of Na2Zn2TeO6 was measured to serve as a phonon analogue for Na2Ni2TeO6. Neutron powder diffraction experiments on Na2Ni2TeO6 were performed using the BT-1 diffractometer at the NIST Center for Neutron Research, Gaithersburg using a wavelength λ = 2.0772 Å using 60' collimation and the Ge(311) monochromator. Powder sample of Na2Ni2TeO6 weighing 3.034 g was filled in a vanadium sample canister containing helium exchange gas loaded at room temperature. Neutron powder diffraction patterns were collected at 295 K, 25 K and at 5 K. Diffraction data was analyzed using Fullprof suite of programs. Inelastic neutron scattering experiments were conducted on the triple-axis spectrometer (TRIAX) at University of Missouri Research Reactor. Elastic scattering experiments were performed at λ = 2.36 Å using the TRIAX spectrometer. For the inelastic scattering experiments, the spectrometer was operated in the fixed final energy mode set to Ef = 14.7 meV. Collimation settings of 60'–60'–40'–40' were used to limit the divergence of the beam and higher order contamination was filtered out using a pyrolytic graphite filter in the scattered beam. 6 g of Na2Ni2TeO6 powder was filled in an aluminum can in helium exchange gas environment for the experiment. Elastic and inelastic scans were performed at 5 K, 20 K, 35 K 150 K and 290 K. Data reduction steps were performed through the software DAVE [22]. The spin wave calculations were performed using the SpinW code [23] and the representation analysis of magnetic structures were performed using the software SARAh [24].
2.2. Computational details
The electron calculations are carried out within DFT using the pseudo-atomic orbital based [25] OpenMX code [26]. We employ the Perdew–Burke–Ernzerhof generalized gradient approximation [27] for exchange–correlation functional and the Dudarev's rotationally invariant DFT + U formalism [28, 29] to account for the localized 3d states in Ni. In this approach, the effective on-site Coulomb U and exchange parameters J do not enter separately but only the difference Ueff ≡ U − J is meaningful. The core electrons are replaced with norm-conserving pseudopotential [30, 31] with energy cutoff 300 Ry. The 9 × 9 × 5 k-point mesh was used for BZ integration. The exchange coupling constants Ji were calculated using Green's function method [32] implemented in OpenMX 3.9 [33]. This approach allows the direct calculation of exchange coupling parameter between any pair of magnetic sites for any inter-pair distance.
3. Results and discussion
3.1. Macroscopic properties
Powder samples of Na2Ni2TeO6 and Na2Zn2TeO6 used in the present study were prepared using standard solid state chemistry methods and the phase/chemical purity were confirmed using PXRD at a laboratory source. Our samples presented similar crystal structure parameters as reported by previous research groups [11, 16], viz, P63/mcm space group for Na2Ni2TeO6 and P622 for Na2Zn2TeO6. During the synthesis of the Na2Ni2TeO6 we noticed that the color of powders varied from pale to dark green in different synthesis batches even though the heating protocols were identical. The reported values of TN for this compound seem to be strongly material-dependent, presenting a variation of about 10 K; from 25 K to 34 K [18, 34]. A magnetic phase transition is observed in Na2Ni2TeO6 at TN ≈ 27 K, where a broad peak is present in the magnetic susceptibility, χ(T) [13, 16, 18]. Broad features seen in magnetic susceptibility are often related to quasi-2D magnetic correlations especially when the crystal structure of the compound supports a layered arrangement of magnetic atoms. In Na2Ni2TeO6, initial reports of the magnetic structure supports a low dimensional zig-zag structure [16, 18, 19]. Generally, this allows the application of high temperature series expansion models to the magnetic susceptibility. In the case of Na2Ni2TeO6, such approaches have lead to the estimation of a mean-field exchange parameter, J/k ≈ −10.8 K [18]. Previous theoretical estimates of exchange parameters for Na2Ni2TeO6 suggest FM first-neighbour and AFM next-nearest neighbour exchange which are in-plane, and additionally, a weak interplane AFM coupling [16].
The macroscopic magnetic properties of the present sample of Na2Ni2TeO6 conforms with the existing reports showing a phase transition at TN = 27 K [16, 18]. Figure 2(a) shows the dc magnetic susceptibility χDC(T) of Na2Ni2TeO6 measured at 500 Oe and under the application of ambient pressure and 1.2 GPa external pressure, describing a broad peak centered at around 30 K. χDC(T) measured at 50 kOe under similar conditions did not produce any marked changes. We also have measured the magnetic susceptibility of Na2Ni2TeO6 under the application of up to 80 kOe (top left inset of (a)), however the broad peak at TN is not largely altered. The compound also displays such robustness in external pressure up to 1.2 GPa as can be seen from (a). There is no frequency-dependence of magnetic susceptibility as can be seen from the AC response, χ'(T) in the bottom inset of (a), measured at five different frequencies. These measurements on our sample of Na2Ni2TeO6 confirms the TN and highlights the field- and pressure-robustness without signatures of glassy magnetism. Curie–Weiss fit of the inverse magnetic susceptibility was administered in the temperature range 200 K–300 K. Effective paramagnetic moment, μeff = 2.2(2) μB/Ni2+ and Curie–Weiss temperature, θcw = −10 K are obtained from the fit. The effective moment is comparable to the value reported recently, but the Curie–Weiss temperature shows a slight reduction [18]. The magnetization isotherms at 2 K, 10 K, 25 K and 60 K are plotted in the top right inset of (a). No sign of strong ferromagnetism is seen.
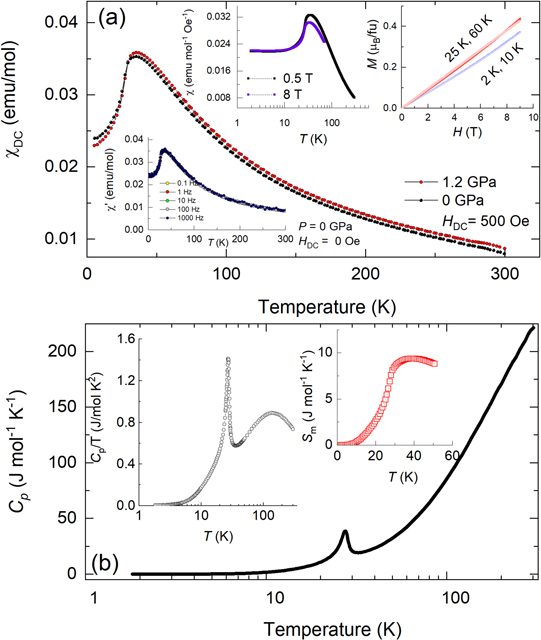
Figure 2. (a) The magnetic susceptibility, χDC of Na2Ni2TeO6 measured under zero and 1.2 GPa external pressure. The bottom inset shows ac susceptibility, χ', at different frequencies, 0.1 Hz to 10 kHz. The top inset on left shows the magnetic susceptibility at 0.5 T and 8 T; and on the right shows the magnetization curves at 2 K, 10 K, 25 K and 60 K. (b) The Cp(T) displaying a sharp peak at TN ≈ 27 K. The left inset shows Cp/T and the right is the magnetic entropy, Sm. The broad feature seen in Cp/T at around 100 K is an indication of short-range order in the system.
Download figure:
Standard image High-resolution imageIn order to characterize the magnetic phase transition reported for Na2Ni2TeO6, we measured the specific heat, Cp(T), figure 2(b). Plotted in the left inset of (b) is Cp/T versus T, highlighting the sharp peak at TN ≈ 27 K confirming the transition temperature. The other prominent feature in the Cp/T plot is the very broad feature at about 100 K. Oxides with some sort of short-range order have been reported to show similar features in specific heat [35–37]. In the case of CuMn spin glasses or Fe2TiO5 [35, 36], the observation of the broad feature in specific heat at high temperature is correlated to the short-range order inherent to the spin glass state. In contrast, in systems like Ca3Co2O6, spin-state crossover leading to a Schottky-like contribution to the total specific heat is cited as the reason [37]. In the case of Na2Ni2TeO6, this is attributed to the short-range ordered magnetic domains due to different ordering wave vectors. The right inset is the magnetic entropy, Sm, obtained by integrating Cdiff/T. The maximum entropy released close to the TN is about 10 J mol−1 K−1 which is diminished compared to the 2R ln(2S + 1) = 18.3 J mol−1 K−1. In general, the observed values are comparable to those found in earlier reports [13, 18]. The magnetic entropy of Na2Ni2TeO6 support a scenario of low-dimensionality and short-range correlations [38].
The effective paramagnetic moment, μeff = 2.23 μB/Ni atom and Curie–Weiss temperature, θp = −9.7(2) K are estimated from Curie–Weiss analysis of χDC(T), where the negative sign for θp suggesting predominant AFM spin correlations. Na2Ni2TeO6 single crystals are reported to have μeff = 3.446 μB/Ni atom, attributing the increased value compared to spin-only moment of Ni, to possible spin–orbit effects [13]. Our powder samples yield a value closer to the magnetic moment of S = 1 Ni2+ (2.82 μB). An independent verification of the TN of the present Na2Ni2TeO6 samples was attained through the temperature dependence of specific heat, Cp(T) (not shown), which confirmed the TN from magnetic susceptibility.
3.2. DFT computations
The magnetic properties of Na2Ni2TeO6, as pointed out in reference [16], are insensitive to the occupancy of sodium atoms for a given concentration. Therefore, in our computations following the convention in reference [16], we focus on the case where only Na2 sites (see table 2) are 100% occupied. Our theoretical results for exchange coupling constants as functions of on-site Coulomb potential Ueff and exchange parameter Ji are summarized in table 1. The data show that, across the whole range of Ueff, Ni favors a weak FM coupling with its first-nearest neighbours (nn) (i.e. a small positive J1), and a strong (weak) AFM coupling with the third-nearest neighbour 3NN (2NN). This suggests that the qualitative behavior and the ground state magnetic ordering are not sensitive to the empirical Ueff value. The dominant term J3, which is missing in the previous work, is particularly crucial in forming stable zigzag AF ordering as it only connects between two adjacent zigzag lines. The J1–J2–J3 configuration has been used previously to stabilize a zigzag AF ordered phase in Na2Co2TeO6 [10]. Figures 3(a) and (b) are respectively the plots of J3, the dominant component, and TN, estimated from table 1 based on mean-field theory, as functions of Ueff. Although both J3 and TN vary with U–J value, TN is generally in a good agreement with the experimental data [16, 18] within a reasonable range of Ueff. The exchange constants for Ueff = 4 eV; J1 (0.025 meV ≡ 0.29 K), J2 (−0.136 meV ≡ 1.57 K), J3 (−2.250 ≡ 26 K) are in a broad range inclusive of the TN and the θcw. Figure 3(c) shows the total energy as a function of the angle (θ) between the spin quantization axis and z-axis in the presence of SOC for Ueff = 6. The simple sin2(θ) dependence that we find is the signature of uniaxial anisotropy and the trend suggests an in-plane easy-axis.
Table 1. Different values of the on-site coulomb potential (Ueff) used to estimate the three relevant in-plane exchange constants and one out-of-plane term. The selected Ueff values converge uniformly to the range of TN reported for Na2Ni2TeO6.
| Ueff (eV) | J1 (meV) | J2 (meV) | J3 (meV) | Jout (meV) | TN(K) |
|---|---|---|---|---|---|
| 4 | 0.025 | −0.136 | −2.250 | −0.146 | −28.2 |
| 5 | 0.050 | −0.110 | −1.950 | −0.135 | −24.3 |
| 6 | 0.090 | −0.100 | −1.700 | −0.127 | −21.1 |
| 8 | 0.210 | −0.060 | −1.300 | −0.120 | −15.7 |

Figure 3. The variation of Ji and TN as a function of Ueff are shown in (a) and (b) respectively. (c) The magnetic anisotropy energy showed a uniaxial behavior where the easy axis lies in-plane. ΔE = E(in-plane) − E(out-of-plane).
Download figure:
Standard image High-resolution image3.3. Neutron scattering
The neutron diffraction pattern of Na2Ni2TeO6 collected at 295 K was refined (see [39]) to obtain the lattice parameters and the atomic coordinates given in table 2. The room temperature crystal structure of Na2 M2TeO6 (M = Ni) is reported in hexagonal P63/mcm (No. 193) space group with lattice parameters a = 5.2042(5) Å and c = 11.1383(5) Å, which is different from the M = Co, Zn, Mg compounds adopting P6322 (No. 182) [12]. Based on Rietveld analysis of the neutron diffraction data on our samples at T = 295 K, the hexagonal P63/mcm structure is confirmed. Comparing the 5 K diffractogram, presented in figures 4(a) and (b), with that at 295 K, major magnetic reflections are identified at ≈13° and 36°. DC and AC magnetic susceptibility of our Na2Ni2TeO6 sample showed a broad anomaly centered at approximately 30 K, while specific heat data showed a sharp peak at close to 27 K thereby suggesting that the TN is ≈27 K. In order to determine the magnetic structure of Na2Ni2TeO6 below the phase transition temperature, we performed diffraction experiments below TN.
Table 2. The fractional atomic coordinates of Na2Ni2TeO6 obtained from Rietveld analysis of neutron diffraction data at T = 295 K (top) and T = 5 K (bottom). Using P63/mcm (No. 193) as the crystal structure model, the refined lattice parameters at T = 295 K are a (Å) = 5.2023(2); c (Å) = 11.1433(9) and 5.1955(6) (Å); 11.1008(5) (Å) at T = 5 K. The Wyckoff label of each atom is given in brackets. The Biso were fixed at values from reference [16]. Values in parentheses indicate one standard deviation.
| T = 295 K | x | y | z | Uiso |
|---|---|---|---|---|
| Na1(6g) | 0.3112(3) | 0.0 | 0.25 | 0.06 |
| Na2(4c) | 0.3336 | 0.6667 | 0.25 | 0.039 |
| Na3(2a) | 0.0 | 0.0 | 0.25 | 0.036 |
| Te(2a) | 0.0 | 0.0 | 0.0 | 0.002 |
| Ni(4d) | 0.6667 | 0.3336 | 0.0 | 0.004 |
| O(12k) | 0.6306(7) | 0.6306(7) | 0.5944(3) | 0.007 |
| Na1(6g) | 0.3700(2) | 0.0 | 0.25 | 0.06 |
| Na2(4c) | 0.3336 | 0.6667 | 0.25 | 0.039 |
| Na3(2a) | 0.0 | 0.0 | 0.25 | 0.036 |
| Te(2a) | 0.0 | 0.0 | 0.0 | 0.002 |
| Ni(4d) | 0.6667 | 0.3336 | 0.0 | 0.004 |
| O(12k) | 0.6852(4) | 0.6852(3) | 0.5943(8) | 0.007 |
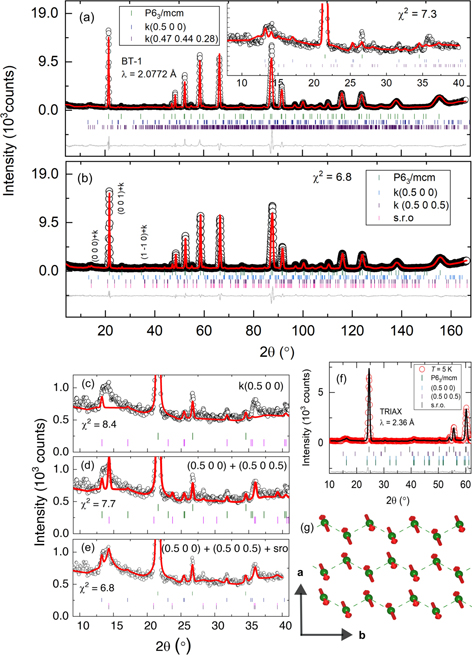
Figure 4. (a) The neutron diffraction pattern of Na2Ni2TeO6 at T = 5 K obtained from BT-1 (λ = 2.0772 Å) is analyzed using a multi-phase model consisting of the nuclear structure in P63/mcm space group, the magnetic phase accounted for by commensurate  and incommensurate
  , propagation vectors (model 1, table 3). The inset provides a magnified view of low-angle region of the pattern. (b) Shows the refinement using two commensurate wave vectors and short-range order component (model 4, table 3). (c)–(e) Show the refinements using three other models described in table 3. (f) Diffraction experiment using longer wavelength neutrons (λ = 2.36 Å) at TRIAX supports the assignment of the magnetic structure using BT-1 data. (g) The magnetic structure corresponding to a zig-zag arrangement of Ni2+ moments in the ab-plane.
Download figure:
Standard image High-resolution imageThe diffraction pattern of Na2Ni2TeO6 at T = 5 K (circles) shown in figures 4(a) and (b) are analyzed using different models in this paper since the previously reported models in literature did not provide a complete description of the observed pattern. Two propagation vectors, commensurate  and incommensurate
  , with the same TN are suggested for Na2Ni2TeO6 [16, 18, 19]. In our analysis, the commensurate wave vector
  was suggested by the k-search utility within Fullprof as well as by the Monte Carlo search within SARAh. Using the above-mentioned commensurate wave-vector, the magnetic structure of Na2Ni2TeO6 is refined using representation analysis methods, which suggests eight irreducible representations, Γmag = Γ1 + Γ2 + Γ3 + Γ4 + Γ5 + Γ6 + Γ7 + Γ8 [18]. The irreducible representation, Γ5 offered the best fit to the experimental data at 5 K. The red solid line in figure 4(a) is the Rietveld fit using a model (model 1, table 3) that combines P63/mcm nuclear structure; and magnetic structure representations Γ5 and Γ1 described by the respective propagation vectors,
  and
and  . The inset of (a) provides an enlarged view of the low-angle region to show the faithfulness of the fits. It can be seen that the diffraction pattern has broad peak shaped around 14° and 36° indicating the short-range ordered magnetic contribution, which is not completely captured by the model-based fit.
Table 3. A description of the different models used for the analysis of the neutron diffraction pattern at T = 5 K. The parameters signifying the quality of fit, Rp, Rwp, RB, Rmag and χ2 are tabulated to provide a quantitative comparison between the models used in the study.
| Model | Phases | Rp | Rwp | RB | Rmag | χ2 |
|---|---|---|---|---|---|---|
| Model 1 |
P63/mcm +  + + 
| 6.3 | 8.4 | 5.6 | 35.6, 23.9 | 7.3 |
| Model 2 |
P63/mcm + 
| 6.5 | 8.9 | 5.5 | 80.5 | 8.4 |
| Model 3 |
P63/mcm +  + + 
| 6.3 | 8.5 | 5.2 | 66.2, 54.3 | 7.7 |
| Model 4 |
P63/mcm +  + +  + s.r.o. + s.r.o. | 6.0 | 8.2 | 4.9 | 42.2, 39.2, 27.4 | 6.8 |
In order to obtain the best magnetic structure description for Na2Ni2TeO6, we performed different model-based Rietveld analysis of the 5 K data. The results are presented in figures 4(c)–(e). In (c), only one magnetic phase corresponding to  was incorporated in addition to the nuclear structure (model 2, table 3). Evidently, the profile fit is not faithful as indicated by a high value of χ2 = 8.4. Adding a second magnetic phase corresponding to
  improves the fit with a reduced χ2 = 7.7, however, the broad features corresponding to the short-range ordered phase are still under-represented, see figure 4(d). This is the model 3 described in table 3. A reasonable representation of the experimental data is obtained by including an additional magnetic phase with Lorentzian peak shape to the model of (d) in order to account for the short-range order. This is represented in figure 4(e) with the corresponding χ2 = 6.8 (model 4, table 3). Though model 4 allows a better fit of the observed peaks at 5 K, it is noted that this model has the shortcoming of the possibility to over-parameterize the fit. However, in section 3.4 we show experimental support for the presence of short-range correlations arising from magnetic clusters, which argues against an over-parameterization of the magnetic structure model. A plot of the Rietveld refinement as per this model in the full-range of 2θ is provided in figure 4(b).
The neutron diffraction pattern at T = 5 K from TRIAX using λ = 2.36 Å is presented in figure 4(f) along with the Rietveld fit using the same multi-phase model described above. Additional magnetic Bragg peaks at high-d region were not observed by using longer wavelength neutrons λ = 2.36 Å and λ = 4.36 Å. A schematic representation of the long-range ordered magnetic structure of Ni2+ in Na2Ni2TeO6 as per the wave vector  is shown in figure 4(g). If we consider a single honeycomb layer formed by the Ni atoms, then the estimated magnetic structure implies that the three nearest magnetic moments are aligned parallel to each other while the other three are aligned opposite resulting in an almost quasi two-dimensional zig-zag arrangement. The magnetic moment of Ni2+ obtained by refining the neutron diffraction pattern at T = 5 K is 1.32(4) μB/fu. The value reported by Kurbakov et al is 1.72(1) μB/Ni, at 1.7 K [18]. 3d8 Ni2+ in an octahedral crystal field environment will give rise to a spin-only magnetic moment corresponding to 2.7 μB/Ni. The short-range ordered magnetic regions in Na2Ni2TeO6 resulting from the incommensurate ordered phase contributes to the reduced value of ordered magnetic moment; along with structural inhomogeneities arising from stacking faults and non-stoichiometric Na regions. Honeycomb magnets similar to Na2Ni2TeO6 have been observed to possess similar commensurate propagation vectors to describe their long-range ordered magnetic structure. For instance, Na2Co2TeO6, although having a different space group, reports a magnetic structure with a commensurate propagation vector of
  [10].
[10].
The magnetic structure of Na2Ni2TeO6 is described using a multi-phase model consisting of a commensurate and an incommensurate phase by one of the initial reports on the magnetic structure of Na2Ni2TeO6 [16], and subsequent reported have supported that picture [18, 19]. According to our analysis, several similar  and their combinations reproduce the commensurate phase described of Na2Ni2TeO6. For example, a model consisting of two commensurate phases
  and
and  can describe the observed diffraction pattern at T = 5 K, see the models described in table 3. We note that a model without including the incommensurate wave vector,
  , offers the best fit as per our detailed analysis. At the same time, our model includes the short-range ordered magnetism which is unequivocally supported by different studies including polarized neutron scattering [16, 18, 19]. The diffuse nature of the short-range magnetic correlations is brought out through the polarized neutron scattering study [19]. For completeness, the refined patterns and the structural parameters obtained using T = 25 K data are given in figure S2 [40] and table S1 [41] respectively.
Figure 5(a) shows the temperature evolution of intensities of the Bragg peaks corresponding to Q = (0.5 0 0.5), (0.5 0 0), (0.5 0 1). The solid lines in the figure corresponds to the curve-fits using power law expression,  . The fit leads to TN = 27.4(3) K, 28.0(2) K and 28.1(4) K and corresponding β values, 0.36(3), 0.37(3) and 0.46(1). These values are comparable to those reported [16]. Figure 5(b) shows the intensity scan at 30 K and 5 K in the 2θ region where the commensurate and incommensurate peaks are reported to be observed [16]. At 30 K, which is above the TN, we do not observe intensities to the Bragg peaks corresponding to Q = (0.5 0 0.5), (0.5 0 0), (0.5 0 1). At 5 K, a rather broad peak is observed very similar to the reported case earlier [16]. Our results thus align with the previous cases where the commensurate and the incommensurate peaks are inferred to have the same TN. The indication of the short-range order we obtained from the specific heat data (inset, figure 2(b)) is not clearly absorbed in the data presented in figure 5. We observe that the broadened peak at (0.5 0 0.5) vanishes at the same temperature as the peak corresponding to the long-range ordered peak. However, short segments of 1D zig-zag magnetic chains would result in a scattering signal that would be too diffuse to detect in our measurements, yet still contribute to the specific heat feature.

Figure 5. (a) Temperature dependence of the intensities of the Bragg peaks at Q = (0.5 0 0.5), (0.5 0 0) and (0.5 0 1). The solid lines are fits to standard power law expression,  . (b) The intensities measured at 30 K and 5 K as a function of 2θ (Qs indicated by arrows). The scans were performed using neutrons of λ = 2.36 Å.
Download figure:
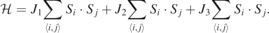
Standard image High-resolution imageWith this background of the magnetic structure, we now turn to the magnetic excitations in Na2Ni2TeO6. The magnetic excitations from the zig-zag ground state of Na2Ni2TeO6 are mapped out using inelastic neutron scattering on powder samples at TRIAX spectrometer. The plot of energy, E (meV), versus momentum transfer, Q (Å−1), at T = 5 K is shown in figure 6(a). The experimental data at 5 K is shown here after subtracting the paramagnetic response at 150 K (see, figure S4 [42]) and after applying a correction of Bose factor. The scattered intensity is shown color coded. Below the TN, a magnetic excitation is observed near 5 meV in the T = 5 K data. The theory of FM or AFMc spin wave excitations in spin systems have been developed for the general case, as well as for specific spin arrangements [43–46]. The calculated spin wave spectra of Na2Ni2TeO6 under the approximation of linear spin wave theory [23] is presented in figure 6(b). The J values obtained through the DFT computations (as per table 1) were used to simulate spin wave spectra using the following Hamiltonian,
Anisotropy or Zeeman terms which can often be accommodated in the spin wave Hamiltonian were not used in the present case. The 'flat-like' excitation band at ≈5 meV is reproduced. Low dimensional magnetic lattices are being studied recently owing to the possibility of realizing flatbands in the magnon spectrum which can then lead to dissipation-less spin transport and associated magnon Hall effect, for example seen in kagome magnets [47]. In other words, one could expect to find a magnon insulator, similar to a topological insulator. Re-investigating simpler magnetic systems in the very recent past has shown motivating results [48].
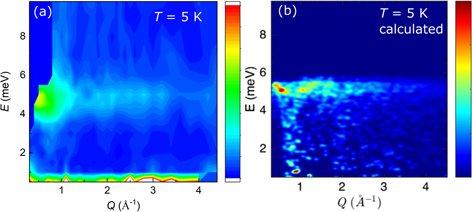
Figure 6. (a) The energy versus momentum transfer maps obtained on powder samples of Na2Ni2TeO6 at T = 5 K showing an excitation at ≈5 meV and (b), the calculated spin wave dispersion using the exchange constant values, Js, obtained from DFT computations. The white area in (a) denotes region of no detector coverage.
Download figure:
Standard image High-resolution imageConstant-Q scans were recorded at different temperatures; as was the temperature dependence of intensity for Q = 0.75 Å−1. The inelastic scans are plotted in figures 7(a)–(d). The E-scan at T = 35 K for the Q-values of 0.75 Å−1, 0.89 Å−1 and 1 Å−1, are presented in figure 7(a). The energy scans at T = 35 K show an almost monotonic decrease in intensity as a function of energy, however, are suggestive of non-zero spin fluctuations at T > TN. A well-defined asymmetric broad peak at ≈4.5 meV is present in the inelastic scattered intensity at 5 K and 20 K as shown in (b) and (c) respectively. The peak shapes are fit to standard profile functions incorporating a Bose term to account for the temperature. An additional Lorentzian term is used in some cases to account for additional features, for example, as seen in the case of Q = 2.09 Å−1 data in (b). At T = 5 K the excitation peak that is present at E = 4.52(6) meV has a full-width-at-half-maximum, FWHM = 1.87(7) meV centered at Q = 0.89 Å−1. With increasing temperature, the FWHM at 20 K broadens to 3.05(7) meV for Q = 0.89 Å−1.

Figure 7. (a) Inelastic intensity at T = 35 K for three different Q-values, 0.75 Å−1, 0.89 Å−1 and 1.0 Å−1. (b) Inelastic scattering at T = 5 K for Q-values, 0.75 Å−1, 0.89 Å−1 and 1.0 Å−1, and 2.09 Å−1. The dashed lines are fits using standard profile functions. (c) Constant-Q (0.75 Å−1) E-scan at 5 K, 20 K and 35 K. (d) Q-dependence of intensity at 5 K for E = 2 meV, 5 meV and 8 meV.
Download figure:
Standard image High-resolution imageThe temperature-dependence of intensity for three different Q's, Q = 0.7 Å−1, 0.75 Å−1 and 0.89 Å−1, was observed to follow a power-law behavior, (1 − T/TN)2β . For the set of three q-values, we obtained values for the exponent β as 0.27 ± 0.04, 0.21 ± 0.02 and 0.24 ± 0.06 respectively, with the corresponding TN determined at 26.4 ± 0.4 K, 27 K and 26 K (not shown). The constant-Q (2.09 Å−1) scan at T = 5 K shows two major peaks, centered at 4.8(3) meV and 8.6(5) meV, as can be seen in panel (b) of figure 7. The intensity observed at three different temperatures, 5 K, 20 K and 35 K at Q = 0.75 Å−1 are plotted together in figure 4(c). The Q-scans at T = 5 K for three different energy values at (5 meV), below (2 meV) and above (8 meV) the magnon excitation as seen in figure 6(b) are shown in (d).
3.4. Short-range order and propagation vector
In the following paragraph we discuss the main results in the context of previous reports on the same compound, in order to highlight the distinctiveness of the present work. The major findings of the present study are (i) that the magnetic order is described purely by commensurate wavevectors, (ii) establishing the existence of static short-range order below TN and—through the convergence of several experimental techniques—fluctuations associated with incipient short-range order extending far above TN, and (iii) first report of the inelastic neutron spectrum that reveals a spin-wave excitation near 5 meV that is well described by our DFT analysis, which points to a strong J3 term in the J1–J2–J3 model. In one of the first detailed scattering studies on this compound, Karna et al [16] reported the magnetic structure of Na2Ni2TeO6 by using a model involving a commensurate (0.5 0 0), and an incommensurate propagation vector (0.47 0.44 0.28). Our analysis shows that a reliable Rietveld fit to the experimental neutron diffraction pattern can be obtained by assuming only commensurate propagation vectors and an additional term to account for the broad features arising from short-range ordering of magnetic clusters. Nuclear magnetic resonance study on Na2Ni2TeO6 pointed to the fact that the broad maximum in magnetic susceptibility (near TN) is due to a low-dimensional short-range correlation developing in the honeycomb lattice [49]. An extreme condition of no long-range magnetic order is realized in the honeycomb antiferromagnet, Bi3Mn4O12(NO3), experimentally verified using magnetic susceptibility and muon spin resonance spectroscopy [50]. The case of Na2Ni2TeO6 may be visualized as an intermediate case where a commensurate magnetic order coexist with short-range magnetism from clusters. Our specific heat data and inverse magnetic susceptibility supports this picture. Korshunov et al, have given experimental validation of diffuse magnetic scattering present in Na2Ni2TeO6 through polarization analysis [19], however the results they presented are at 30 K which is only marginally above the transition temperature, TN = 27 K. Diffraction studies by Kurbakov et al [18] claim a single ordering wavevector of (0.5 0 0); however, we have clearly demonstrated that this does not provide a sufficient description of our new diffraction data obtained both in traditional energy integrated mode (BT-1) as well as energy resolved mode (TRIAX). This points to unsettled composition variation in the study of this material, but we note here that our study is the only one to date that directly address the issue of composition variation via ICP-MS and magnetization characterizations as outlined in section 3.5. Further, we incorporate the short-range order directly and concurrently in our Rietveld refinement, rather than to treat them separately as was done in the Kurbakov study. Our detailed analysis brings out the short-range order combined with two commensurate propagation vectors and establishes the connection with features observed in specific heat. In addition, we report the spin wave excitation at 5 meV in this compound, which is the first to the best of our knowledge. We note that a traditional two-axis diffraction configuration was used in the Korshunov study that does not distinguish static magnetic order from low lying short range correlations as we observe in the current study in the range above TN. In figure 8 the Q–T map at constant E = 1.5 meV is shown in the left panel, which is obtained by subtracting the T = 290 K data from a series of temperature dependent Q-scans. The effect of superparamagnetic ordering from incipient short-range order is observed at Q ≈ (0.5 0 0.5). On the right panel, the integrated intensity as a function of temperature is presented. The vertical solid line in the figure marks the location of the TN. Appreciable intensity is observed at temperatures above the TN which can clearly be attributed to superparamagnetic scattering from incipient AFM clusters. The experimental proof of short-range correlations from magnetic clusters support the magnetic structure model used in the present study, involving only commensurate ordering vectors and a short-range component. An experimental signature of low-dimensionality and short-range spin fluctuations is seen in our specific heat data, see section 3.1.

Figure 8. (a) A Q–T intensity map was generated by measuring a series of Q-scans with incremented temperature at constant E = 1.5 meV. The response at 290 K was subtracted from each temperature in order to remove the influence of ordinary paramagnetic scattering. The effect of superparamagnetic ordering resulting from incipient short range magnetic order is evident in the vicinity of Q ≈ (0.5 0 0.5). (b) This intensity was integrated between Q = 0.6 and 0.9 Å and is plotted as a function of temperature. The signal persists above 100 K, consistent with the specific heat results. The negative values are a result of over-subtraction owing to the loss of paramagnetic scattering in the magnetically ordered state. Excess intensity above the TN is attributed to superparamagnetic scattering of incipient magnetic clusters, consistent with the observations from the specific heat. The vertical solid line marks the TN.
Download figure:
Standard image High-resolution image3.5. Effect of Na content on magnetic transition
Na ions in Na2Ni2TeO6 is reported to adopt a particular chiral ordering [16]. This special ordering of Na between the honeycomb layers of Ni could influence the physical properties of Na2Ni2TeO6. In order to understand if the Na content has any role in the magnetic properties in general, we prepared three different batches of Na2Ni2TeO6 powders: S1 (the batch ofsamples used for most of the measurements reported here) and S2 with the nominal stoichiometry Na2Ni2TeO6 (both prepared under identical conditions) and S4 with a 2% reduction in Na content. We then have carried out compositional, structural and magnetic characterization of these three samples using ICP-MS, synchrotron x-ray diffraction and magnetometry. The ICP-MS results are shown in table 4 indicating no significant departures in the amount of Na in the synthesized samples from the nominal values.
Table 4. The ICP-MS results analyzing the Na-content in different samples of Na2Ni2TeO6. The mass of the sample dissolved in a solvent for the measurement is indicated as m. The mole ratios estimated for Na, Ni by normalizing Te to 1 are shown.
| Na (wt.%) | Ni (wt.%) | Te (wt.%) | m (g) | Na | Ni | Te | |
|---|---|---|---|---|---|---|---|
| S1 | 11.7 | 30.1 | 32.2 | 0.1099 | 2.02 | 2.04 | 1 |
| S2 | 11.8 | 30.1 | 32.7 | 0.1083 | 2.01 | 2.00 | 1 |
| S4 | 11.6 | 30.1 | 32.2 | 0.1078 | 1.99 | 2.03 | 1 |
| Calc | 11.9 | 30.3 | 33.0 |
The samples S1, S2 and S4 were studied using high-resolution synchrotron x-ray diffraction at 11-BM. The diffraction data obtained at 295 K and the analysis results are presented in the supplemental information [51, 52]. The chemical formulae determined from refining the occupancies of metal atoms showed that the nominally stoichiometric samples did not present a large deviation from the starting stoichiometry. However the S4 sample showed a reduced Na content which was as expected. We note that a slight discrepancy in stoichiometry of S4 between the ICP-MS and the diffraction results may be sample dependent.
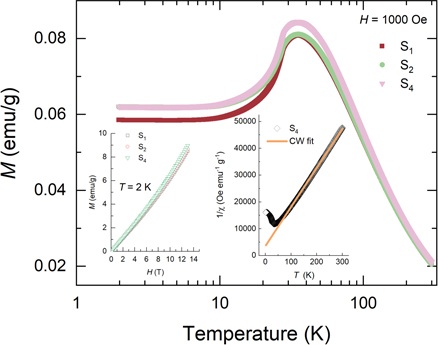
Shown in figure 9 are the magnetic susceptibility curves of S1, S2 and S4 along with a Curie–Weiss fit of S4 (right inset) and the magnetization isotherms (left inset). It is seen that slight variation in Na-content does not influence the transition temperature of Na2Ni2TeO6, which are determined to lie with in 27 ± 1 K for S1, S2 and S4. Curie–Weiss analysis of S1, S2 and S4 yielded a value of 2.3 μB/Ni which is comparable to the value obtained for the Na2Ni2TeO6 sample that was used for neutron diffraction study shown in this work. Increasing the Na-content beyond ±5% leads to the appearance of impurity phases like Ni3TeO6.
Figure 9. The magnetic susceptibility of different samples of Na2Ni2TeO6, S1, S2 or S4, with slightly varying Na-content. The left inset shows the magnetization isotherms which remain linear up to 13 T. Curie–Weiss fit to inverse magnetic susceptibility of S4 is shown in the right inset.
Download figure:
Standard image High-resolution image
4. Conclusions
Our data support that Na2Ni2TeO6 displays zig-zag magnetic order below TN ≈ 27 K, best described by a combination of magnetic propagation vectors  (0.5 0 0), (0.5 0 0.5) and a flat magnon excitation band at 5 K. The magnetic phase transition at TN ≈ 27 K in the layered honeycomb compound Na2Ni2TeO6 is found to be insensitive under externally applied magnetic fields up to 80 kOe and pressure of 1.2 GPa. Slight variations in Na content does not appear to have a major impact on the value of the TN or the nature of magnetic susceptibility and magnetization isotherms, which remain robust and do not saturate up to 13 T. Our detailed neutron diffraction study puts forward multiple solutions to the magnetic structure, with and without an incommensurate phase present, but, taking in to account the presence of short-range magnetism. The magnetic structure described by the commensurate wave vector describes zig-zag arrangement of Ni2+ moments in the ab plane.
The J1–J2–J3 model of magnetism on honeycomb lattice predicts several magnetic structures in the classical and quantum limits [8]. Several honeycomb magnets conform to the phase diagram as per the J1–J2–J3 for a wide range of the nearest-neighbour J values. A classical spin liquid is even proposed to reside in the honeycomb lattice [53] where bond directional and spin–orbit coupled exchanges are known to lead to quantum effects and topological phases [1]. The zig-zag, stripe and other types of magnetic structures predicted by the J1–J2–J3 model has found realization in several compounds, Na2Ir2O3 [54, 55], BaNi2(AsO4)2 [56], Na3 M2SbO6 (M = Co, Ni) [57, 58] and (Li, Na)3Ni2SbO6 [59]. Recent magnetic structure study on Na2Co2TeO6 [10] finds the presence of both long-range and short-range magnetic order, which is attributed to quantum effects or importance of Kitaev-like terms in the Hamiltonian. The J values estimated through DFT computations in the present work marks the position of Na2Ni2TeO6 in the third quadrant of the phase diagram of Fouet et al [8] which locates a zig-zag phase (region IV) in close proximity to a phase boundary that separates it from a non-collinear phase (region V). This explains the propensity of Na2Ni2TeO6 in forming a mixed magnetic phase that consists of a long-range ordered zig-zag structure and a short-range ordered non-collinear one. The specific heat data supports the inference of short-range magnetic order from diffraction studies.
Using the J values estimated through the first-principles DFT computations in a linear spin wave theory model allowed us to reconstruct the experimental spin wave dispersion at 5 meV. The current set of J values for Na2Ni2TeO6 positions this compound in the category of a quasi-2D honeycomb material with the prospect of detailed future experiments to understand the spin dynamics and ion conductivity.
Data availability statement
The data that support the findings of this study are available upon reasonable request from the authors.
Acknowledgement
HSN acknowledges support from Eppley Foundation research award, SPN02233, for "Frustrated spins: Enabling targeted design towards multifunctional quantum materials". NE would like to thank UTEP for Dodson's travel awards to perform the neutron scattering experiments. KW wishes to acknowledge the Meritus fellowship from COURI, UTEP. NP acknowledges support from the INLs LDRD program (18P37-008FP). KG acknowledges support from the US DOE's Early Career Research Program. RAK acknowledges research support from the U.S. Department of Energy, Office of Energy Efficiency and Renewable Energy, Fuel Cell Technologies Office, under Contract No. DE-AC36-08GO28308. P-HC and RRZ acknowledge Department of Energy, DE-SC0018331 and DE-SC0006818 grants. Support for computational time at the Texas Advanced Computing Center through NSF Grant No. TG-DMR090071 is gratefully acknowledged. JMG acknowledges the National Science Foundation for the award BCS-0922374 to the University of Missouri which funded the ICP-MS equipment used in this research.
Footnotes
- 7
Certain commercial equipment, instruments, or materials are identified in this document. Such identification does not imply recommendation or endorsement by the National Institute of Standards and Technology, nor does it imply that the products identified are necessarily the best available for the purpose.