
Abstract
In a combined experimental and theoretical study, we investigated how Fe and Co adlayers on W(110) affect the Dirac-type surface state (DSS). Angle-resolved photoelectron spectroscopy data show an increase in binding energy of 75 meV and 107 meV for Fe and Co, respectively. In order to identify the origin of the energy shift we performed first-principles calculations of the surface electronic structure. The inward surface relaxation of the uncovered W(110) surface is lifted by the adlayers. This structural change is one reason of the energy shift of the DSS. Furthermore, the Fe and Co adlayers change the surface potential, which results in an additional energy shift of the DSS.
Export citation and abstract BibTeX RIS

Original content from this work may be used under the terms of the Creative Commons Attribution 4.0 licence. Any further distribution of this work must maintain attribution to the author(s) and the title of the work, journal citation and DOI.
1. Introduction
The Dirac-type surface state (DSS) of W(110) [1] has attracted great attention among condensed-matter physicists due to its striking properties. A detailed knowledge about the DSS was gained in numerous investigations: its linear  dispersion along the
  and the
  lines of the two-dimensional Brillouin zone and its helical spin structure [2–5] are reminiscent to a surface state of a topological insulator (TI) [6]. The calculation of the topological invariant reveals that the DSS is topologically nontrivial [7]. Furthermore, it exhibits almost exclusively
  orbital symmetry. In contrast to the isotropic shapes of the Dirac cones in TI's, the DSS on W(110) has an anisotropic shape caused by the two-fold symmetry of the surface [8].
This detailed knowledge makes the DSS on W(110) a perfect playground for follow-up investigations. Recently, Honma et al investigated the influence of ferromagnetic Fe layers on W(110) onto the DSS [9]. For a coverage of 0.9 ML Fe/W(110), they report a shift of about 450 meV of the DSS towards lower binding energies (i.e. upwards with respect to EF). For a coverage of 1.2 ML, the opening of an energy gap of 340 meV is reported. While the gap opening is linked to an out-of-plane magnetization which occurs for 1.2 ML Fe on W(110), the large energy shift for a coverage of 0.9 ML remains unexplained.
Theoretical studies of the electronic structure of uncovered W(110) demonstrate that the energy position of the DSS is related to the interlayer distance of the first W layers. The energy position shifts downwards with increasing interlayer distance [2, 10]. Since Fe lifts the naturally occurring inward relaxation of the first W layer, the considerable upward shift of the DSS reported by Honma et al is contrary to the expectation.
This discrepancy between expectation and observation was the motivation for our ARPES (angle-resolved photoelectron spectroscopy) study on how the DSS behaves under the influence of adlayers, in particular in the submonolayer regime. In order to investigate the influence of adlayers more systematically, we have also examined Co/W(110) in addition to Fe/W(110). The analysis of our data is accompanied by first-principles calculations of the surface electronic structure.
2. Experimental details
The ARPES measurements were performed at the BL-1 beamline [11, 12] of the Hiroshima Synchrotron Radiation Center. For control experiments concerning the magnetic order of the adlayers, we used spin-resolved ARPES at beamline BL-9B [13]. For all measurements shown here p-polarized photons with an energy of 43 eV were used. The angle between light incidence and electron detector is 50°. The sample temperature was kept between 20 K and 30 K during the measurements. The energy and angular resolutions are 30 meV and 0.8°, respectively.
The W(110) surface was cleaned by repeated cycles of annealing in an oxygen atmosphere of 10−8 mbar at 1500 K and subsequent flashing at 2500 K. Sharp (1 × 1) diffraction spots from low-energy electron diffraction (LEED) and the absence of carbon- and oxygen-related signals in Auger electron spectroscopy confirm a good surface quality.
Fe and Co were evaporated by e-beam evaporation onto the clean W(110) surface at room temperature. Both Fe and Co grow in monolayer islands for submonolayer coverages. The pseudomorphic structure of the monolayer islands is indicated by the remaining (1 × 1) LEED pattern. The coverage was calibrated by the appearance of satellite diffraction spots observed with LEED at higher coverages. For Fe/W(110), satellite spots appear at a coverage of 1.7 ML along the ![$\left[1\bar{1}0\right]$](https://content.cld.iop.org/journals/0953-8984/33/28/285504/revision4/cmabfdf3ieqn5.gif) direction [14]. For Co/W(110), satellite spots appear along the [001] direction at a coverage of about 1 ML [15, 16]. From this, we estimated the evaporation time for coverages in the pseudomorphic growth regime. In order to improve the film quality, indicated by the sharpness of the diffraction spots in LEED, the Fe film was annealed at 500 K. For the Co film, annealing was not necessary. We chose submonolayer coverages of about 0.5 ML for which the DSS is still visible in ARPES. At this coverage, we have no indication of ferromagnetic order of the adlayers down to 30 K. For Fe/W(110), the appearance of ferromagnetic order is well-studied in the literature (e.g. [17]). It strongly depends on the preparation parameters, e.g., the substrate temperature. Less is known about Co/W(110). Our SARPES data for submonolayer coverages of Co showed no magnetically induced spin polarisation even after magnetising the sample with external fields.
direction [14]. For Co/W(110), satellite spots appear along the [001] direction at a coverage of about 1 ML [15, 16]. From this, we estimated the evaporation time for coverages in the pseudomorphic growth regime. In order to improve the film quality, indicated by the sharpness of the diffraction spots in LEED, the Fe film was annealed at 500 K. For the Co film, annealing was not necessary. We chose submonolayer coverages of about 0.5 ML for which the DSS is still visible in ARPES. At this coverage, we have no indication of ferromagnetic order of the adlayers down to 30 K. For Fe/W(110), the appearance of ferromagnetic order is well-studied in the literature (e.g. [17]). It strongly depends on the preparation parameters, e.g., the substrate temperature. Less is known about Co/W(110). Our SARPES data for submonolayer coverages of Co showed no magnetically induced spin polarisation even after magnetising the sample with external fields.
3. Theoretical aspects
For the electronic-structure calculations, we follow the multi-code first-principles approach that proved successful in previous investigations [7]. Therefore, a few details may suffice.
In the first stage, the relaxations of the topmost layers have been determined for the nonmagnetic case by the Vienna ab initio simulation package (VASP) [18, 19], using a slab geometry. VASP solves the Kohn–Sham equations by augmented plane-waves basis sets [18, 19]. Relativistic effects are accounted for by first-order perturbation in the spin–orbit coupling which requires handling of the core states by projector-augmented-wave pseudopotentials [20, 21]. The Perdew–Burke–Ernzerhof generalized gradient approximation [22, 23] is used for the exchange correlation. To mimic (110) surfaces, we utilized a symmetric slab with 16 layers of W sandwiched by a layer of Fe or Co. Relaxations are allowed on both sides of the slab and in the first six layers including the layer of Fe or Co. The vacuum region is chosen as wide as 28 bulk interlayer distances. The reciprocal space is partitioned using a Monkhorst mesh with 21 × 21 × 1 points for the slab calculations. Plane wave expansions in the valence-band region are cutoff at 520 eV. The interlayer spacings are given in table 1.
Table 1. Interlayer spacings for W(110) and X/W(110) [X = Fe, Co] as obtained from DFT calculations. δdij = (dij − dbulk)/dbulk denotes the relative distance change between W layers i and j with respect to W bulk in percent. δdX1 refers to the adlayer X and the topmost W layer.
| δdX1 | δd12 | δd23 | δd34 | δd45 | δd56 | |
|---|---|---|---|---|---|---|
| W(110) | −3.67 | +0.92 | +0.20 | +0.24 | −0.10 | |
| Fe/W(110) | −13.34 | +1.03 | +0.63 | +0.80 | +0.92 | +0.83 |
| Co/W(110) | −16.50 | +1.31 | +0.86 | +0.80 | +1.17 | +0.96 |
In the second stage, we perform spin-polarized relativistic Korringa–Kohn–Rostoker computations using our 'home-brewed' computer code omni, with the relaxations of the semi-infinite systems taken from the VASP calculations (table 1). By solving the Dirac equation, spin–orbit coupling and magnetism are treated on equal footing. The main outcome are layer-resolved spectral densities

The trace of the Green function  of layer l may be restricted to extract information on orbital composition and spin projection. η is a small offset from the real energy axis, taken here as 0.02 eV.
The first adlayers of Fe and Co on W(110) continue the bcc lattice of W(110) in a pseudomorphic manner [14, 15]. Given the island morphology in the experiment, there is no need to treat incomplete monolayers in theory. We may expect an incoherent superposition of spectral features related to covered and uncovered parts of the surface.
The density-functional theory (DFT) calculations for monolayer coverage yield magnetic adlayers, in agreement with published results (for Fe/W(110) see, e. g., [24]) but at variance with the present experiment for submonolayer coverage and nonzero measuring temperature. Therefore, we have to mimic the nonzero temperature in theory which involves treatment of thermal fluctuations of the local magnetic moments. The latter could be treated within the coherent potential approximation (CPA) in which the directions of the magnetic moments are averaged over all solid angles. The CPA medium has to be computed self-consistently for each energy and wavevector, a very demanding computational effort. The main effects of such calculations are that features in the spectral densities become broadened and that the exchange splitting is quenched. Since broadening is of very little importance for the present study, we quenched the exchange splitting by averaging the spin-dependent potentials obtained from the DFT calculations.
4. Results
The ARPES results for W(110), Fe/W(110), and Co/W(110) are shown in figures 1(a)–(c), respectively. The coverage amounts to approximately half a monolayer for both Fe and Co. For the uncovered W(110) surface, the Dirac point—that is the band crossing at the Brillouin zone center  —appears at ED = −1.25 eV (indicated by the black-dotted line in figure 1), which is in good agreement with previous experimental and theoretical investigations, e. g. [1–5, 7–9]. Furthermore, we observe spectral features related to W bulk bands below the Dirac point as well as a parabolic band above it, labeled W, with a band minimum at about −0.8 eV at
  . In the literature, this band is controversially discussed as surface or bulk related [2, 25–27], in particular, depending on
k
∥. Around
. In the literature, this band is controversially discussed as surface or bulk related [2, 25–27], in particular, depending on
k
∥. Around  , no energy shift was observed upon Li [28] or Fe adsorption [26] in agreement with our adlayer studies for Fe and Co.
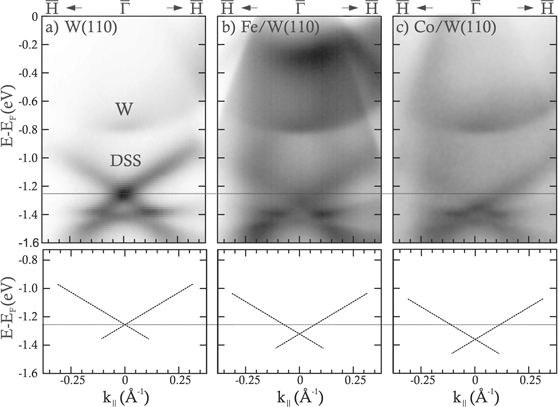
Figure 1. ARPES results for the  line of W(110) (a), Fe/W(110) (b), and Co/W(110) (c) with a coverage of about 0.5 ML each. The experimental intensities are given as linear grey scale (black: high intensity; white: low intensity). The sketches in the bottom row depict dispersion and energy positions of the DSS.
Download figure:
Standard image High-resolution imageThe ARPES data for the partly Fe-covered W(110) surface shows the same features as the bare W(110) surface. Additionally, a broad Fe-related feature appears at about −0.3 eV. A comparison between figures 1(a) and (b) reveals that the DSS shifts downward in energy upon Fe coverage. A fit of the energy distribution curve (EDC) at  yields a shift of ΔED = −75 meV compared with the clean W(110) surface. Furthermore, a broadening of the DSS is clearly visible. It is interesting to note that a former study for 0.5 ML of Fe on W(110) [26] detected also an adlayer-induced downward shift for a surface state. This state was found close to EF for higher parallel wavevector and may be, retrospectively, interpreted as a continuation of the DSS for higher
k
∥ values.
yields a shift of ΔED = −75 meV compared with the clean W(110) surface. Furthermore, a broadening of the DSS is clearly visible. It is interesting to note that a former study for 0.5 ML of Fe on W(110) [26] detected also an adlayer-induced downward shift for a surface state. This state was found close to EF for higher parallel wavevector and may be, retrospectively, interpreted as a continuation of the DSS for higher
k
∥ values.
For Co/W(110), displayed in figure 1(c), a very similar result is observed. The band W is also visible at −0.8 eV. Concerning the DSS, a fit of the EDC yields a shift of ΔED = −107 meV, which is even larger than for the Fe adlayer. In contrast to the case of iron, the broadening is less pronounced.
ARPES measurements for higher Fe and Co coverages reveal that the DSS fades out and is no longer apparent for coverages higher than 0.8 ML (not shown here) similar to a former study on Fe/W(110) [26]. In contrast to [9], no shift towards EF and no gap opening was observed. The same results were obtained by measurements with various photon energies and along the two high-symmetry lines  and
and  . In view of our results, we propose an alternative interpretation of the upper part of the 'DSS gap' reported in [9]. It is the parabolic band W persisting upon adlayer adsorption. As a consequence and in contrast to [9], we do not find evidence for an opening of a DSS gap.
Figure 2 shows calculated spectral densities for the uncovered W(110) surface as well as the adlayer systems 1 ML Fe/W(110) and 1 ML Co/W(110). The spectral density for the uncovered W(110) in figure 2(a) is in good agreement with our and previous experimental results.
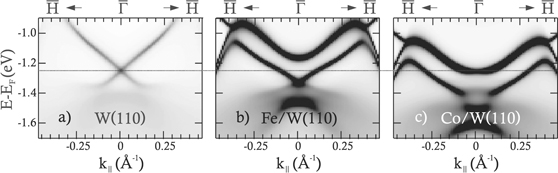
Figure 2. Calculated surface electronic structure of W(110) (a), 1 ML Fe/W(110) (b), and 1 ML Co/W(110) (c). The computed spectral densities of the respective topmost layer are given as linear grey scale (black: high intensity; white: low intensity) along the  high-symmetry line.
Download figure:
Standard image High-resolution imageAs in our experiment, the DSS shifts downward in energy for both Fe/W(110) and Co/W(110) compared with bare W(110). For Fe/W(110) the shift amounts to ΔED = −80 meV (figure 2(b)). The complete adlayer hosts a band that lies about 200 meV above the DSS; this band is not visible in the ARPES measurement, which may be attributed to the partial coverage in the submonolayer range. For Co/W(110) (figure 2(c)) the Dirac point shifts even further down in energy so that it hybridises with the underlying W bulk states. As a result, the Dirac point cannot be uniquely identified. In addition, the dispersion of the DSS changes from almost linear (for bare W(110)) to slightly parabolic, as has been explained in [3] for a scenario in which the Dirac point overlaps with bulk bands.
5. Origin of energy shift
The detected energy shift of the DSS raises the question of its origin. It is theoretically predicted that the energy of the DSS depends on the interlayer spacing between the topmost W layers [2, 10]. Experiments show that the inward relaxation of the topmost W layers [29, 30] is lifted upon Fe deposition [31]. For Co/W(110), a comparable lifting of the relaxation is predicted by theory [32]. These results are in line with our calculated interlayer spacings in table 1.
In order to separate the pure effect of interlayer spacing from the influence of the adsorbate electronic structure, we performed spectral density calculations for a model system of a bare W(110) surface with varied interlayer spacings. We artificially increased the interlayer spacings as to match those calculated for the adlayer systems (table 1). The resulting energy positions of the DSS are sketched in figure 3(b). Hereby, WFe(110) and WCo(110) refer to the model systems of a bare W(110) surface with interlayer distances of the adlayer systems. The DSS shifts by ΔED = −67 meV and −87 meV for WFe(110) and WCo(110), respectively. The larger energy shift for WCo(110) compared with WFe(110) can be explained by the larger interlayer spacing. The numbers are in line with the general trend but slightly less than those observed in experiment.

Figure 3. Sketch of the energy-versus-momentum dispersion of the DSS. (a) ARPES data from figure 1. (b) Model calculation for bare W(110), WFe(110) and WCo(110) (for details see text). (c) Full adlayer calculation taken from figure 2; the blurry area marks the region where the Dirac state overlaps with bulk states.
Download figure:
Standard image High-resolution image
The general trend that the DSS shifts to lower energies with increasing interlayer spacing is not only reproduced by our model calculations but also by the full adlayer calculation, yet with quantitative differences. The smaller shift in the model calculation can be explained by the neglected influence of the electronic structure of the adlayers on the surface potential. From work-function measurements, an influence on the surface potential can be deduced: the work function is reduced upon Fe and Co deposition on W(110) by up to −600 meV [33] and −900 meV [15], respectively. To relate the reduction of the work function to the energy shift of the DSS we adopt, for a qualitative description, the phase accumulation model [34]. This model describes an electron trapped between the surface barrier and the band gap (here: energy gap for states of a certain symmetry). The energy position of the bound state then depends on the gap size, the position within the gap, and the surface potential profile. A decrease of the work function leads to a downward shift of the state energy which is a fraction of the work-function change. Even though this model is designed for free electron-like states, it still provides a qualitative explanation for the downward shift of the DSS.
A comparison between figures 3(a) and (c) shows quantitative differences between experiment and adlayer calculation. We would like to recall that the calculation was performed for a complete monolayer while in the experiment the W(110) surface was only covered by half a monolayer. We therefore attribute the quantitative differences to the different coverages. Since the work function and the layer distances are only locally influenced by the adlayer, we expect different energy positions of the DSS: the energy position related to the clean W(110) surface (−1.25 eV) and the energy position shifted downwards in energy related to the covered areas. Therefore, the energy position of the DSS obtained from our ARPES measurement is influenced by both, i.e., the observed spectral feature is a superposition of the unshifted and the shifted DSS. Furthermore, we can not exclude other details in the calculation that probably affect the quantitative comparison. For example we assume a zero magnetic moment in the relaxations of the layers although a finite moment maybe influences the layer distances. The absence of magnetism in experiment is not a result of zero magnetic moments but of disordered or compensated magnetic moments, such as the spin-spiral state [35], which is not considered in the calculations.
6. Summary
We showed that the DSS of W(110) is shifted downward in energy upon Fe and Co adlayer deposition. The trend of the energy shift observed in our ARPES measurements is described by a model calculation, taking into account only changed interlayer distances, as well as by the first-principles calculations for the full adlayers. Our analysis shows that the energy shift is caused by two effects: the increased interlayer distance induced by the adlayer and the adlayer-induced changes of the surface potential. Our findings render it worth investigating the local coverage-dependent behaviour of the DSS by a combined ARPES and scanning tunneling spectroscopy study.
Acknowledgments
MD, PG, and MH gratefully acknowledge the hospitality of the Hiroshima Synchrotron Radiation Center. The measurements were performed with the approval of the Proposal Assessing Committee of HSRC (Proposal No. 18BG016, 18BG046, 19BG026). DT acknowledges support from the Swedish Research Council (VR) through Grant No. 2019-03666. The computations/data handling were enabled by resources provided by the Swedish National Infrastructure for Computing (SNIC) at the National Supercomputing Center (NSC, Tetralith cluster) and the High Performance Computing Center North (HPC2N, Kebnekaise cluster), partially funded by the Swedish Research Council through Grant Agreement Nos. 2020/21-14 and 2020/5-424.
Data availability statement
All data that support the findings of this study are included within the article (and any supplementary files).