
Abstract
Resonant ultrasound spectroscopy has been used to characterise strain coupling and relaxation behavior associated with magnetic/magnetoelectric phase transitions in GdMnO3, TbMnO3 and TbMn0.98Fe0.02O3 through their influence on elastic/anelastic properties. Acoustic attenuation ahead of the paramagnetic to colinear-sinusoidal incommensurate antiferromagnetic transition at ∼41 K correlates with anomalies in dielectric properties and is interpreted in terms of Debye-like freezing processes. A loss peak at ∼150 K is related to a steep increase in electrical conductivity with a polaron mechanism. The activation energy, Ea, of ≳0.04 eV from a loss peak at ∼80 K is consistent with the existence of a well-defined temperature interval in which the paramagnetic structure is stabilised by local, dynamic correlations of electric and magnetic polarisation that couple with strain and have relaxation times in the vicinity of ∼10−6 s. Comparison with previously published data for Sm0.6Y0.4MnO3 confirms that this pattern may be typical for multiferroic orthorhombic RMnO3 perovskites (R = Gd, Tb, Dy). A frequency-dependent loss peak near 10 K observed for TbMnO3 and TbMn0.98Fe0.02O3, but not for GdMnO3, yielded Ea ⩾ ∼0.002 eV and is interpreted as freezing of some magnetoelastic component of the cycloid structure. Small anomalies in elastic properties associated with the incommensurate and cycloidal magnetic transitions confirm results from thermal expansion data that the magnetic order parameters have weak but significant coupling with strain. Even at strain magnitudes of ∼0.1–1‰, polaron-like strain effects are clearly important in defining the development and evolution of magnetoelectric properties in these materials. Strains associated with the cubic–orthorhombic transition due to the combined Jahn–Teller/octahedral tilting transition in the vicinity of 1500 K are 2–3 orders of magnitude greater. It is inevitable that ferroelastic twin walls due to this transition would have significantly different magnetoelectric properties from homogeneous domains due to magnetoelastic coupling with steep strain gradients.
Export citation and abstract BibTeX RIS

Original content from this work may be used under the terms of the Creative Commons Attribution 4.0 licence. Any further distribution of this work must maintain attribution to the author(s) and the title of the work, journal citation and DOI.
1. Introduction
Rare earth orthomanganites (RMnO3, R = rare earth) are well known for the multiple phase transitions which they display, including cooperative Jahn–Teller distortions, charge ordering, octahedral tilting, magnetism, ferroelectricity and magnetoelectricity. However, only GdMnO3, TbMnO3 and DyMnO3 have Mn–O–Mn bond angles which fall in the narrow range that is required for multiferroic properties where ferroelectricity arises from cycloidal magnetism [1–4]. It is clear that sensitivity to the size of the A-site cation and the lattice distortions which follow are a vital component of the structural and magnetic stability relationships even though strain is not the functional property of primary interest. On the other hand, the role of strain is exploited in the preparation of thin films where choice of substrate material provides a tuning mechanism for the magnetoelectric properties of all three materials (e.g. [5–11]). Strain/order parameter coupling has a fundamental influence on phase transitions, of course, in that it promotes mean field behavior by enhancing the interaction length of the order parameter and provides an indirect mechanism by which multiple order parameters can couple. Strain coupling is important also at ferroelastic domain walls where steep gradients in the primary order parameter(s) interact with equivalently steep gradients in strain, with the result that the walls can have properties which are substantially different from those of the immediately adjacent homogeneous domains. Consideration of domain walls as providing engineered functional properties in their own right has become a new focus for development of nanoscale devices more generally (e.g. [12–16]). Finally, the dynamic response of both thin films and bulk materials to some externally applied magnetic or electric field may be constrained by the dynamics of strain relaxation as the rate limiting step. For example, switching of domains from positive to negative polarity typically requires motion of the domain walls, which may depend on the mobility of polaronic-type strain clouds or unpinning of walls from the strain fields of point defects.
Against this wider view of strain coupling, the primary objective of the present study was to investigate the dynamics of strain relaxation associated specifically with the multiferroic behavior of GdMnO3 and TbMnO3. There are numerous studies of the temperature and frequency dependence of the dielectric responses of both materials to ac electric fields (including [2, 3, 17–28]) and one of the dynamical response to an ac magnetic field [29], but there appear to be no data in the literature for the elastic/anelastic response to ac stress. Significant differences have been observed between acoustic resonance spectra of hexagonal YMnO3 and orthorhombic Sm0.6Y0.4MnO3, however, and these provided evidence of a strain relaxation process that is specific to the multiferroic orthorhombic structure [30, 31]. Both hexagonal YMnO3 and orthorhombic Sm0.6Y0.4MnO3 have spontaneous strains with magnitudes of up to ∼0.0004 associated with antiferromagnetic ordering below ∼70 K and ∼50 K, respectively, and an increase in attenuation above ∼200 K which is most likely related to increasing electrical conductivity. However, Sm0.6Y0.4MnO3 has two additional Debye-like peaks in acoustic attenuation at ∼80 and ∼150 K, preceding the incommensurate and cycloidal magnetic transitions [30].
There is no single technique which provides the mechanical equivalent of dielectric spectroscopy across decades of frequency, but resonant ultrasound spectroscopy (RUS) has proved to be effective for measuring the elastic and anelastic properties of mm-sized samples in the frequency range ∼0.1–2 MHz [32]. Variations of resonance frequencies and peak widths provide, in particular, a measure of the strength and dynamics of strain coupling in perovskites which undergo conventional ferroic phase transitions [33].
Here we show that acoustic loss peaks obtained from analysis of RUS spectra from single crystals of GdMnO3, TbMnO3 and TbMn0.98Fe0.02O3 reveal a temperature interval between ∼40 and ∼200 K in which dynamical strain relaxation occurs on a time scale of ∼10−6 s. A loss peak at ∼80 K complements evidence of local electric dipole motion from dielectric spectroscopy and matches up with anomalies in thermal conductivity and thermal expansion. There appears to be a dynamical precursor structure which has coupling between local electric dipoles, strain and magnetic ordering. Kinetic parameters obtained from fitting of the inverse mechanical quality factor can be accounted for in terms of thermally activated relaxation of polaron-type strain clouds. The static magnetic structures become stable only once these become immobile. There is a further magnetoelastic loss process associated with ordering of moments of Tb3+ in the cycloid structure but not of Gd3+ in the A-type antiferromagnetic structure. Elastic stiffening below ∼41 K due to coupling of the magnetic order parameters with strain, rather than softening, confirms that their relaxation in response to applied stress occurs on a significantly longer time scale than ∼10−6 s in the stability field of the multiferroic phase. Differences in the sequence of magnetic structures between GdMnO3 and TbMnO3 are also seen clearly in the evolution of their elastic properties.
2. Transition sequences
GdMnO3 and TbMnO3 are orthorhombic in space group Pbnm at room temperature. Symmetry reduction from the holosymmetric cubic perovskite structure is due to combined octahedral tilting and cooperative Jahn–Teller distortions. The transition temperature for the cooperative Jahn–Teller transition is in the vicinity of 1500 K [34].
For comparison with the elastic and anelastic properties reported here, the sequences of magnetic transitions which occur in these materials at low temperatures are summarised in figure 1. Both undergo a second order, paramagnetic to colinear-sinusoidal incommensurate antiferromagnetic phase transition at TN1 ≈ 41 K, with [010] as the direction of the temperature-dependent incommensurate repeat [1, 35–39]. The second transition is referred to here as occurring at TN2. It is thermodynamically continuous at ∼28 K in TbMnO3, and leads to a structure with a magnetic cycloid in the (100) plane ('bc-cycloid'). The repeat parallel to [010] locks in to a nearly constant wavelength, and a ferroelectric polarisation develops parallel to [001] [1–4, 17, 36, 37]. More recently, Mufti et al [40] showed a small discontinuity in the development of the electric polarisation at ∼27 K, suggesting weakly first order character for the transition. The second transition in GdMnO3 is to the A-type antiferromagnetic structure, with canting of Mn moments resulting in a net ferromagnetic moment parallel to [001], and is first order in character [1–4, 17, 39, 41, 42]. The measured value of TN2 differs between heating, ∼20–25 K, and cooling, ∼15–20 K [2, 3, 17, 43].

Figure 1. Summary from the literature of transition sequences with falling temperatures in TbMnO3 and GdMnO3, shown here as reference for comparison with complex patterns of elastic and anelastic behavior from RUS measurements. PM = paramagnetic, PE = paraelectric, AFM = antiferromagnetic, WFM = weakly ferromagnetic, FE = ferroelectric. A and B describe two different transition sequences observed in GdMnO3.
Download figure:
Standard image High-resolution imageSome samples of GdMnO3 have an additional first order transition, referred to here as occurring at TN3 (GdMnO3 A in figure 1). In zero magnetic field, TN3 might be ∼10–13 K on heating and ∼5 K on cooling [17, 44] or ∼8 K on heating and ∼5 K on cooling [2, 3]. The transition is associated with the development of electric polarisation parallel to [100] [3, 4, 17, 45] of a commensurate magnetic cycloid in the (001) plane ('ab-cycloid') [45, 46]. The ab-cycloid structure is stabilised by applying a magnetic field parallel to [010] [3, 39]. In the phase diagrams of Arima et al [39] and Baier et al [47] it is shown as being not quite stable in zero field. Goto et al [4] suggested that differences between samples in this regard may be due to slight differences in oxygen stoichiometry.
Ordering of the Gd and Tb moments occurs below a temperature TR which is ∼7 and ∼6 K, respectively, in GdMnO3 and TbMnO3 [1, 2, 35–38, 47–49]. GdMnO3 can retain the ferroelectric polarisation below TR [45], but the phase diagrams of Goto et al [4] and Kimura et al [3] show a stability field for the weakly ferromagnetic, paraelectric structure instead. The phase diagram of Baier et al [47] has a field of phase coexistence. Hemberger et al [41] showed the low temperature structure as being antiferromagnetic with canting of Gd and Mn moments in opposite directions. In contrast, TbMnO3 retains the bc-cycloid structure down to the lowest temperatures. TR is marked by the repeat distance parallel to [010] becoming fixed to a rational value [50] and by a slight increase in the electric polarisation parallel to [001] [2, 3, 36].
3. Sample description
The GdMnO3 single crystal used in the present study came from a boule grown by the floating zone method in air in the laboratory of M Mihalik. It had an irregular shape with maximum dimensions ∼3 × 1 × 1 mm3 and mass 0.0091 g.
The first crystal of TbMnO3 ('crystal 1') was from a boule which had been grown in air by the floating zone technique [40]. Another crystal from the same boule was used in the study of Handayani et al [51]. The crystal used for RUS had mass 0.0084 g, two parallel faces ∼0.75 mm apart and a triangular cross section with dimensions ∼1 × ∼2 mm2. Anomalies in the temperature dependence of electric polarisation, dielectric spectroscopy and lattice parameter data of Mufti et al [40] gave TN2 ≈ 26 K. The value of TN1 was quoted as 42 K and there was a break in slope of the temperature dependence of electric polarisation at ∼8 K.
In order to test for the effects of small variations in oxygen stoichiometry, a second TbMnO3 crystal ('crystal 2') was examined. This came from the same boule as the crystal described by O'Flynn et al [52], which had been grown by the floating zone technique in argon atmosphere at the University of Warwick, and used for studies reported in that paper. On the basis of measurements of dc magnetic susceptibility and heat capacity it had transition temperatures TN1 = 41 K, TN2 = 27 K, TR ≈ 7 K. The shape was approximately that of a rectangular parallelepiped, with dimensions ∼2.9 × 1.9 × 0.9 mm3, and mass 0.0296 g.
Substitution of Mn3+ by Fe3+ has been of interest because it allows, in principle, tuning of the contribution of Jahn–Teller cooperative distortions [53–56]. The two cations have closely similar radii but Fe3+ is not Jahn–Teller active. The single crystal of TbMn0.98Fe0.02O3 used in the present study was a slice with mass 0.1184 g cut from the same boule as described by Mihalik et al [54], which had been grown by the floating zone method in air. It had two parallel faces ∼1.2 mm apart and an irregular shape in the other two directions, with maximum dimensions of ∼3 and ∼6 mm. The transition temperatures reported by Mihalik et al [54]) on the basis of peaks in the heat capacity were TN1 = 38.4(3) K, TN2 = 21.8(3) K, TR ≈ 6.5 K.
Elasticity and anelasticity data from these crystals are compared below with previous results obtained by RUS from a single crystal of Sm0.6Y0.4MnO3 [30] which has a sequence of structures closely similar to that of TbMnO3 [57, 58]. The sinusoidal antiferromagnetic structure developed below TN1 ≈ 50 K, followed by bc-cycloidal ordering and the continuous development of a ferroelectric dipole parallel to [001] below TN2 ≈ 27 K. A broad anomaly in heat capacity at the lowest temperatures was assumed to be due to ordering of Sm moments below TR ≈ 4 K.
4. Experimental methods
The RUS technique has been described in detail by Migliori and Sarrao [32]. In the Cambridge set up, RUS data are collected with a crystal held lightly between two piezoelectric transducers in a head which is attached to a stick lowered into a helium flow cryostat [59] or an Oxford instruments cryogen-free Teslatron [60]. Maximum voltages applied to the driving transducer are 25 and 2 V, respectively. For the present study, spectra were collected in automated cooling and heating sequences with a few mbars of helium gas in the sample chamber to assist thermal equilibration. A settle time of 20 min was allowed at each set point before data collection. Primary spectra contained between 65 000 and 13 000 points in different frequency intervals between 0.1 and 2 MHz.
Separate peaks in an RUS spectrum are due to natural acoustic resonances of the sample and involve predominantly shearing motions. For a single resonance peak with frequency f, values of the corresponding combination of (shear) elastic moduli scale with f2. Assignment of specific combinations of moduli to specific resonances is generally possible only if the shape of the sample is well defined, such as for a rectangular parallelepiped. Line broadening arises as a consequence of acoustic loss, which is expressed in terms of the inverse mechanical quality factor, Q−1. In an RUS experiment it is convenient to take Q−1 as being equal to Δf/f, where Δf is the peak width at half maximum height. Absolute values of f2 and Q−1 for resonances of a single crystal will display different temperature dependences through a phase transition, depending primarily on the manner in which different shear strains are coupled with the order parameter and with defects responsible for the loss processes. For the present study, resonance peaks which could be followed through wide intervals of temperature were fit with an asymmetric Lorentzian function in the software package Igor (Wavemetrics) to obtain the peak frequency, f, and width at half maximum height, Δf.
An example of how resonances evolve with temperature is given in figure 2 for a heating sequence using the GdMnO3 single crystal. The pattern shown by the single peak is of increasing resonance frequency with decreasing temperature and small but distinct breaks in trend at ∼41 and ∼17 K, corresponding to the expected transition temperatures, TN1 and TN2. Marked peak broadening, corresponding to a peak in Q−1 values, is evident between ∼200 and ∼50 K.
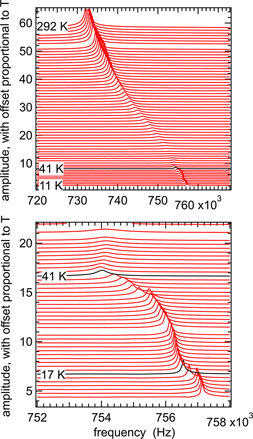
Figure 2. Segments of the RUS spectra from the single crystal of GdMnO3 collected during heating from 11 to 292 K in the helium flow cryostat. The spectra are offset up the y-axis in proportion to the temperature at which they were collected. They show the temperature dependence of a single resonance peak with frequency near 730 kHz at room temperature.
Download figure:
Standard image High-resolution image5. Results
5.1. GdMnO3 crystal
Figure 3 shows results for f2 and Q−1 from fitting of resonance peaks in spectra from the single crystal of GdMnO3 collected in a heating sequence using the helium flow cryostat. The automated sequence involved cooling in 30 K steps from 280 K down to 10 K followed by heating from 10 to 50 K in 1 K steps, from 50 to 70 K in 2 K steps and from 70 to 295 K in 5 K steps. Data for f2 from seven resonance peaks have been scaled along the y-axis in an arbitrary manner in figure 3(a) so as to allow easy comparison of their temperature dependences. The clear overall trend is of increasing steepness of elastic stiffening with falling temperature, without the leveling off toward zero slope as T → 0 K expected for a normal crystalline material. Anomalies seen in the primary spectra (lower half of figure 2) are a small dip in f2 at TN1 and a small increase at TN2. The different combinations of elastic moduli represented by f2 for the different resonances vary by up to ∼10%, with a dip of ∼0.4% at TN1 and a small increase at TN2.
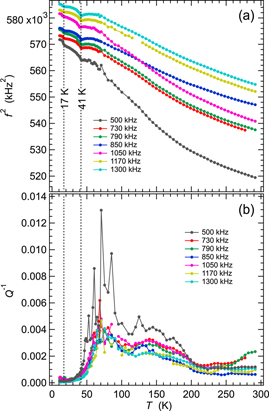
Figure 3. Variation of f2 (a) and Q−1 (b) for the single crystal of GdMnO3 from fitting of seven resonance peaks in RUS spectra collected during heating in the helium flow cryostat. Absolute values of f2 have been scaled arbitrarily along the y-axis to allow for easy comparison of the trends which they each display. Listed frequencies refer to the approximate frequency of each resonance at room temperature. Scatter of the values of Q−1 for the resonance peak with frequency near 500 kHz is due to noise in the original spectra.
Download figure:
Standard image High-resolution imageThe steepening trend of f2 with falling temperature is accompanied by two broad peaks in Q−1, centred at ∼80 and ∼150 K (figure 3(b)), as is typical of Debye-like freezing processes. Resonance modes with the largest values of Q−1 (f ∼ 500 and 1050 kHz at room temperature) also have the largest changes in f2, consistent with this interpretation. Q−1 drops to low values as TN1 is approached from above and there is no obvious anomaly at TN2. This pattern of acoustic loss is essentially the same for all resonances, from which it is concluded that all the single crystal moduli are affected in more or less the same way. This, in turn, implies that the loss mechanisms do not have a strong dependence on the orientation of the shear strain that applies in each resonance mode.
Data collected separately in the Teslatron cryostat extended to lower temperatures, as illustrated in figure 4 for a sequence of cooling followed by heating in small steps through the magnetic transitions. At this level of detail, the transition at TN1 is fully reversible and occurs close to where Q−1 drops to its lowest values. There is then a hysteretic transition in the expected region of TN2, with a break in slope of f2 occurring at ∼16 K during cooling and ∼19 K during heating. This is followed by a second additional hysteretic transition at ∼8 K during cooling and ∼12 K during heating, below which the resonance frequencies all revert back to the trend established above TN2. The second hysteretic transition correlates with TN3 in the pattern shown for GdMnO3 A in figure 1. On this basis, the A-type AFM structure stable between TN2 and TN3 is slightly stiffer than both the colinear-sinusoidal incommensurate structure (above TN2) and the ab-cycloid structure (below TN3).

Figure 4. Variation of f2 (a) and Q−1 (b) at low temperatures from fitting of five resonance peaks in RUS spectra collected from the single crystal of GdMnO3 during cooling (open circles), followed by heating (filled circles) in the Teslatron cryostat. Absolute values of f2 have been scaled arbitrarily along the y-axis to allow for easy comparison of the trends which they each display. Listed frequencies refer to the approximate frequency of each resonance at room temperature.
Download figure:
Standard image High-resolution imageFinally, there is a small reversible break in slope of the temperature dependences of f2 at ∼5 K. On the basis of studies in the literature, as summarised in figure 1, this appears to correspond to TR. Goto et al [4] and Kimura et al [3] showed a stability field for the weakly ferromagnetic, paraelectric structure below TR, i.e. that there is a transition from the ab-cycloid structure back to the canted antiferromagnetic structure with falling temperature. This would be consistent, in particular, with the data shown in figure 14 of Kimura et al [3] which show ferroelectric polarisation parallel to [100] only between ∼8 and ∼5 K. However, the RUS data in figure 4 do not show a return to the stiffer trend of the A-type AFM structure below TR, so the small anomaly may be due only to the development of long-range ordering of the magnetic moments of Gd3+.
5.2. TbMnO3 crystal 1
Figure 5 shows results for f2 and Q−1 from fitting of resonance peaks in spectra from TbMnO3, crystal 1, collected in a heating sequence using the helium flow cryostat. The full sequence involved cooling in 30 K steps at nominal temperatures from 280 K down to 10 K followed by heating from 10 to 60 K in 2 K steps and from 60 to 295 K in 5 K steps. In a second run, spectra were collected during heating from 120 to 210 K in 2 K steps. The data in figure 5(a) for f2 from 8 resonance peaks have again been scaled along the y-axis in an arbitrary manner to allow easy comparison of their temperature dependences.
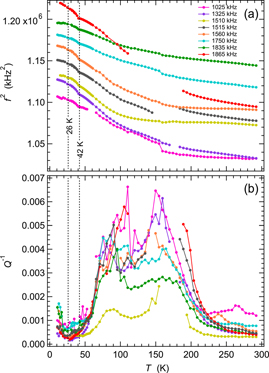
Figure 5. Variation of f2 (a) and Q−1 (b) during heating, from fitting of eight resonance peaks in RUS spectra collected in the helium flow cryostat from the first single crystal of TbMnO3 (crystal 1). Absolute values of f2 have been scaled arbitrarily along the y-axis to allow for easy comparison of the trends which they each display. Listed frequencies refer to the approximate frequency of each resonance at room temperature. The values of TN1 and TN2 shown are from Mufti et al [40]. Gaps and irregularities in the temperature dependence of both f2 and Q−1, particularly near 160 K, occur where peaks in the primary spectra became too weak and broad to allow them to be fit with any confidence.
Download figure:
Standard image High-resolution imageAs in the case of GdMnO3, the evolution of f2 for each peak follows a steepening trend with falling temperature. However, the two resonances with frequencies near 1510 and 1560 kHz at room temperature have a flat variation between 300 and ∼150 K, which almost becomes a slight softening. The most obvious anomaly in the evolution of f2 is a small dip at 41 K, consistent with the value of TN1 ≈ 42 given by Mufti et al [40]. There is perhaps a further small change in the temperature dependence of f2 at the expected value of TN2 = 26 K, but this is only at the level of noise. Overall, the elastic moduli vary by up to ∼10%, and by a very small fraction of this at the transition temperatures. Small breaks in slope of f2 near 160 K may or may not be real as they occurred in the interval where the peaks were broadest and hardest to follow.
There are again two broad peaks in Q−1, centred at ∼80 and ∼150 K (figure 5(b)), consistent with Debye-like freezing processes. The resonance modes with the largest values of Q−1, i.e. those with frequencies near 1025, 1325 and 1865 kHz at room temperature, also have the largest changes in f2, while the resonance with frequency near 1510 kHz shows the lowest values of Q−1 and the smallest overall change in f2. These differences imply that there is some slight dependence of the loss mechanism on the orientation of induced strains but no obviously systematic dependence on frequency. Q−1 drops to low values as TN1 is approached from above and does not display any obvious anomaly at TN2.
Data collected separately in the Teslatron cryostat extended to lower temperatures, as illustrated in figure 6 for a sequence of cooling followed by heating in small steps through the magnetic transitions. At this level of detail, the transition at TN1 is reversible and again occurs essentially where Q−1 drops to its lowest values. There is a very slight dip discernible in the evolution of f2 at ∼26 K, corresponding to the expected position of TN2. As in the case of GdMnO3, there are no overt anomalies in Q−1 associated with either of these two transitions. In contrast with GdMnO3, however, Q−1 values extracted from all resonance peaks show a broad peak centred at ∼13 K. This is above the value of TR ≈6 K reported in the literature and the temperature of ∼8 K where Mufti et al [40] observed a break in slope of the electric polarisation parallel to [001].
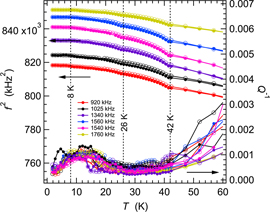
Figure 6. Variation of f2 and Q−1 at low temperatures from fitting of six resonance peaks in RUS spectra collected from TbMnO3 crystal 1 during cooling (open circles), followed by heating (filled circles) in the Teslatron cryostat. Absolute values of f2 have been scaled arbitrarily along the y-axis to allow for easy comparison of the trends which they each display. Listed frequencies refer to the approximate frequency of each resonance at room temperature. The values of TN1 and TN2 shown are from Mufti et al [40], who also reported a break in slope of electric polarisation at 8 K. Values of TR from the literature are ∼6 K (figure 1, section 2).
Download figure:
Standard image High-resolution image5.3. TbMnO3 crystal 2
Figure 7 contains f2 and Q−1 data for a representative set of resonance peaks collected from the second TbMnO3 crystal (crystal 2) in the Teslatron cryostat. Spectra were collected in a sequence of cooling followed by heating through the temperature interval 2–295 K. The pattern of variations of f2 is closely similar to that of crystal 1 (figure 5), and is also fully reversible between cooling and heating. The pattern of variations of Q−1 is different, however. Firstly, the peak in Q−1 at ∼80 K of crystal 1 is still present but is not as obvious for all resonances from crystal 2. Secondly, the peak at ∼150 K from crystal 1 is either absent in the data from crystal 2 or is hidden by the steep rise of Q−1. Finally, Q−1 returned to low values above ∼200 K for crystal 1 but continued to increase for crystal 2. There is perhaps a peak centred at ∼260 K in figure 7(b). In addition, the maximum value of Q−1 near 90 K varies more substantially between resonances, implying that the loss process is more sensitive to the orientation of the strain induced in each resonance mode. The resonance with frequency near 1290 kHz actually softens with falling temperature down to ∼100 K and has the lowest values of Q−1. All the resonance peaks displayed essentially the same peak in Q−1 centred at ∼10 K, a few degrees above the expected value of TR.

Figure 7. Variation of f2 (a) and Q−1 (b) from fitting of seven resonance peaks in RUS spectra collected during cooling (open circles) followed by heating (filled circles) in the Teslatron cryostat from the second single crystal of TbMnO3 (crystal 2). Absolute values of f2 have been scaled arbitrarily along the y-axis to allow for easy comparison of the trends which they each display. Open circles in (a) indicate the cooling sequence and filled circles represent the heating sequence. Only data from the heating sequence are shown in (b). The data are indistinguishable between cooling and heating. Listed frequencies refer to the approximate frequency of each resonance at room temperature. Values shown for TN1, TN2 and TR are from O'Flynn et al [52].
Download figure:
Standard image High-resolution imageAt the level of detail shown in figure 8 for the same data up to 60 K, the transition at TN1 is reversible and, as before, occurs essentially where Q−1 drops to its lowest values. There is a very slight dip discernible in the evolution of f2 at ∼27 K, corresponding to the expected position of TN2. There are, again, no overt anomalies in Q−1 associated with either of these transitions. The peak in Q−1 values at ∼10 K is observed for all resonances and there is a small softening step in f2 values with falling temperature below ∼8 K.
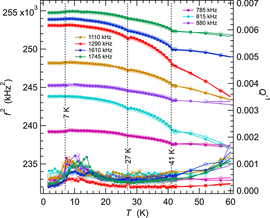
Figure 8. Enhanced view of variations of f2 (a) and Q−1 (b) data from figure 6 up to 60 K. Absolute values of f2 have been scaled arbitrarily along the y-axis to allow for easy comparison of the trends which they each display.
Download figure:
Standard image High-resolution image5.4. TbMn0.98Fe0.02O3 crystal
RUS spectra collected from the TbMn0.98Fe0.02O3 single crystal in an automated sequence involved cooling in 30 K steps at nominal temperatures from 280 K down to 10 K followed by heating from 10 to 70 K in 2 K steps and from 70 to 295 K in 5 K steps. Figure 9 shows results for f2 and Q−1 from fitting of eleven resonance peaks. The overall pattern for some modes is of significant elastic softening with decreasing temperature followed by stiffening. The others show more uniform stiffening. The total variation is by up to ∼7%, with a small dip at TN1 ≈ 38 K and an even smaller change in slope at TN2 ≈ 22 K. There is a broad asymmetric peak in Q−1 at ∼150 K. Differences in the maximum values between different resonances imply that the loss process involves coupling with some specific orientation of induced strain. Subsequent measurements in the Teslatron cryostat showed that f2 variations were fully reversible between cooling and heating.
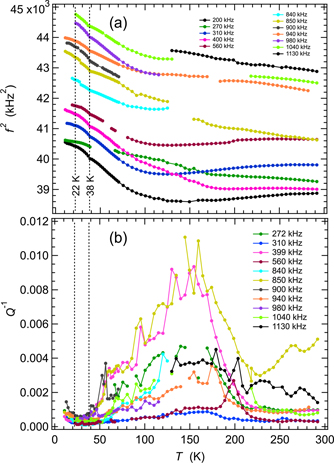
Figure 9. Variation of f2 (a) and Q−1 (b) during heating, from fitting of eleven resonance peaks in RUS spectra collected in the helium flow cryostat from the single crystal of TbMn0.98Fe0.02O3. Absolute values of f2 have been scaled arbitrarily along the y-axis to allow for easy comparison of the trends which they each display. Listed frequencies refer to the approximate frequency of each resonance at room temperature. Values shown for TN1 and TN2 are from Mihalik et al [54]. Gaps and irregularities in the temperature dependence of both f2 and Q−1, particularly near 160 K, occur where peaks in the primary spectra became too weak and broad to allow them to be fit with any confidence.
Download figure:
Standard image High-resolution imageData collected separately in the Teslatron cryostat extended to lower temperatures, as illustrated in figure 10 for a sequence of cooling followed by heating in small steps through the magnetic transitions. As for all the other samples, the transition at TN1 is reversible. There is a very slight, rounded dip discernible in the evolution of f2 for the lowest frequency peak (∼270 kHz) at ∼22 K, corresponding to the expected position of TN2. In contrast with the other samples, there is a frequency dependent increase in Q−1 starting at ∼30 K for the 1130 kHz peak and at ∼22 K for the 270 kHz peak. There is also an asymmetric peak in Q−1 values with a maximum at ∼7–10 K, which correlates with smooth but slight increases in f2. There is no obvious anomaly in the evolution of f2 at the expected value of TR ∼ 6.5 K.

Figure 10. Variation of f2 (a) and Q−1 (b) at low temperatures from fitting of eight resonance peaks in RUS spectra collected from TbMn0.98Fe0.02O3 during cooling (open circles), followed by heating (filled circles) in the Teslatron cryostat. Absolute values of f2 have been scaled arbitrarily along the y-axis to allow for easy comparison of the trends which they each display. Listed frequencies refer to the approximate frequency of each resonance at room temperature. Values shown for TN1, TN2 and TR are from Mihalik et al [54].
Download figure:
Standard image High-resolution image6. Analysis
6.1. Debye loss peaks
A thermally activated Debye freezing process observed in measurements made as a function of temperature at constant frequency can be described by (following [33, 61, 62])

The temperature, Tm, at which Q−1 has its maximum value, Qm, is determined by the condition ωτ = 1, where τ is the relaxation time for the loss mechanism and ω is the angular frequency (=2πf) at which the measurement is made. Ea is an activation energy, R is the gas constant and r2(β) is a width parameter which defines a spread of relaxation times for the dissipation process.
Raw data for Q−1 from four of the samples described above show evidence of overlapping peaks which, in lowest order, can be represented in terms of a single loss process with Tm in the vicinity of 10 K and two loss processes with Tm in the vicinities of 80 and 150 K, respectively. Fits of equation (1) to the higher temperature data for selected resonances from the four samples investigated in the present study and from the single crystal of Sm0.6Y0.4MnO3 described elsewhere [30] are shown in figures 11(a)–(e). Reasonable fits to the separate peaks were generally obtained, though it was necessary to constrain some of the parameters due to overlaps and noise. The overall result is that a plausible description of the variations of Q−1 for all five samples in the higher temperature range is in terms of two peaks with Ea/r2(β) ≈ 0.03–0.05 and 0.08–0.1 eV. By somewhat arbitrarily combining data for the different samples in a single Arrhenius plot (figure 11(f)), values of Tm for the loss peak near 80 K can be represented by  , with τo = 2.5 × 10⁻¹⁰ s, Ea = 0.044 ± 0.007 eV. In combination, the two fits would constrain r2(β) to be ∼1 for the 80 K loss peak, implying that the relaxation mechanism involves a single relaxation time. Values of Tm from fits of equation (1) in the vicinity of 150 K do not produce the same quality of correlation and are therefore not shown. This is not surprizing given that the data indicate more than one loss process in different samples.
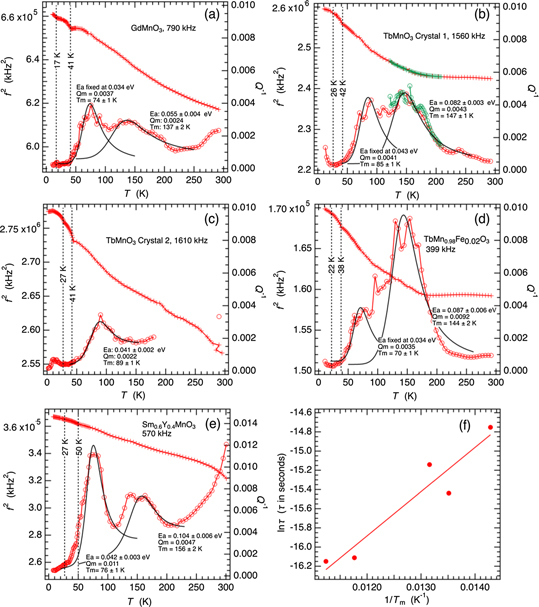
Figure 11. Comparison of the variations of f2 and Q−1 for representative resonances from the four samples described in the present study (a)–(d) and from Sm0.6Y0.4MnO3 [30] (e). Black curves are solutions of equation (1) showing that the data for Q−1 can be represented in terms of two loss peaks with Tm ∼ 80, ∼150 K and Ea/r2(β) ∼ 0.04, ∼0.09 eV, respectively. Constant baselines were assumed in the fitting procedure for (a)–(c) and linear, temperature dependent baselines were assumed for (d) and (e). (f) Is an Arrhenius plot of data for peaks with Tm ∼ 70–90 K from the fits in (a)–(e). The slope of the straight line fit to the data is 510 ± 86 K and the intercept is −22.1 ± 1.1.
Download figure:
Standard image High-resolution imageThe steep increase in Q−1 with increasing temperature above ∼250 K is present only in the data from TbMnO3 crystal 2 and Sm0.6Y0.4MnO3 which were grown under argon rather than in air. The loss mechanisms in this temperature interval are evidently sensitive to the oxygen content of the sample.
Figure 12(a) contains fits of equation (1) to representative peaks in Q−1 which have Tm near 10 K. In reality there are probably two frequency dependent peaks in the vicinity of 8 and 15 K but the latter is not readily resolved in data from many of the other resonances. Average values of Ea/r2(β) are ∼0.003 eV for TbMnO3 crystal 1 and TbMn0.98Fe0.02O3, and ∼0.004 eV for TbMnO3 crystal 2. Figure 12(b) is an Arrhenius plot of results from fits to different resonance peaks of TbMnO3 crystal 2 and TbMn0.98Fe0.02O3. The straight lines fit to the data give values for Ea of 0.0017 ± 0.0003 and 0.0021 ± 0.0007 eV respectively. Corresponding values of τo are 1.4 × 10⁻⁸ s and 1.1 × 10⁻⁸ s. From the evidence of overlapping peaks in Q−1 it is likely that there are two loss mechanisms with each having Ea in the vicinity of 0.002 eV.
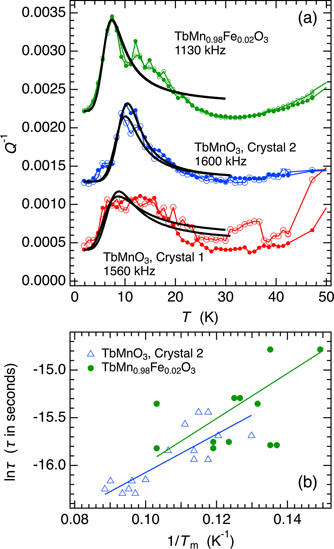
Figure 12. Analysis of loss peaks in the vicinity of 10 K. (a) Fits of equation (1) to Q−1 data from representative resonances of the primary RUS spectra. Although a single peak has been fit, there are clearly two loss peaks in the data from TbMnO3 crystal 1 and TbMn0.98Fe0.02O3. Open circles = cooling sequence; filled circles = heating sequence. (b) Arrhenius plot of data for Tm from fits of equation (1) to Q−1 variations from numerous resonances. The two straight lines fit to the data (more scattered for TbMn0.98Fe0.02O3) are the same within experimental uncertainty and are consistent with an activation energy of ∼0.002 eV for the loss process. Tm values for TbMnO3 crystal 1 are not shown because of scatter due to the overlap of two peaks evident in (a).
Download figure:
Standard image High-resolution image6.2. Comparison with dielectric relaxation
Figure 13 presents a comparison of representative acoustic loss data, Q−1, for GdMnO3 and TbMn0.98Fe0.02O3 from this study with dielectric loss, tan δ (GdMnO3 data from Vilarinho et al [25], for a ceramic sample; TbMn0.98Fe0.02O3 unpublished data of A Maia, measured parallel to [001] of a single crystal from the same boule as the crystal used for RUS). The most prominent feature of the tan δ data shown for GdMnO3 (figure 13(a)), a frequency-dependent peak in the temperature interval ∼200–250 K, does not appear to correlate with any of the data for Q−1. Arrhenius treatment of the temperature at which ωτ = 1 gave an activation energy of 0.28 ± 0.03 eV. The pattern is similar for TbMn0.98Fe0.02O3, though the peaks are shifted to higher temperatures (figure 13(b)). On the other hand, there is close correlation between Q−1 variations and a very much weaker peak in tan δ at ∼60–70 K (figures 13(c) and (d)). Arrhenius treatment using the condition ωτ = 1 for this peak at 500 kHz and 1 MHz gave Ea = 0.019, τo = 7 × 10⁻⁹ s and 0.026 eV, 3 × 10⁻⁹ s, respectively for GdMnO3 and TbMn0.98Fe0.02O3. Ferreira et al [21] obtained Ea = 0.018 eV from their more comprehensive data set for GdMnO3.

Figure 13. Dielectric spectroscopy data (a) for a ceramic sample of GdMnO3 [25] and (b) for a single crystal of TbMn0.98Fe0.02O3, measured parallel to [001] (previously unpublished data of A Maia, MSc Thesis, University of Porto, 2019). The frequency dependent peak in tan δ at ∼200–300 K does not obviously correlate with any features in the data for Q−1 from this study. (c) and (d) Comparison of Q−1 and tan δ: a much weaker peak in tan δ in the temperature interval ∼50–100 K correlates closely with peaks in Q−1. Vertical broken lines mark TN1 (41, 38 K) and TN2 (17, 22 K).
Download figure:
Standard image High-resolution imageFitting the results for tan δ collected as a function of temperature at 500 kHz with the equivalent expression to equation (1) gave Ea/r2(β) ∼ 0.016 and 0.019 eV, consistent with r2(β) being close to 1. The value of Ea/r2(β) from fitting of the peak in Q−1 near 80 K is ∼0.04 eV. Although the acoustic data are too noisy to resolve a frequency dependence of the loss peak, this is at least permissive of it being due to a loss mechanism which involves freezing of local electric dipole motion coupled with strain. Values of both Q−1 and tan δ reduce steeply as T → TN1 for both samples represented in figure 13. There are anomalies in tan δ at TN2, but their form is quite different for GdMnO3 and TbMn0.98Fe0.02O3 (figures 13(c) and (d)), implying that the dielectric relaxation mechanism involves only very weak coupling with strain in this case.
The dielectric constant of TbMnO3 shows the same steep frequency-dependent increase with increasing temperature above ∼120–150 K [18, 19, 26]. Cui et al [18] reported activation energies of 0.15 and 0.31 eV for peaks in tan δ at T < 160 K, and T > 170 K, respectively, for their polycrystalline sample. The latter is most likely to be due to the same loss process as accounts for the peak in tan δ at ∼200–250 K in GdMnO3. The former is perhaps due to the same loss mechanism as would account for the acoustic loss peak seen at ∼150 K in all four samples.
6.3. Spontaneous strain
A formal analysis of spontaneous strains associated with phase transitions in these multiferroic perovskites, based on lattice parameter and high resolution thermal expansion data from the literature, is presented in the appendix
Table A1. Spontaneous strains at room temperature determined from lattice parameters given by Cardona Vasquez et al [93] for GdMnO3, by Alonso et al [94] for TbMnO3 and by O'Flynn et al [58] for Sm0.6Y0.4MnO3. Room temperature values for the same parameters of LaMnO3 are from Carpenter and Howard [63]. etx and e4 for CaTiO3 are for pure tilting transitions [92]. Values for GdAlO3 and TbAlO3 were calculated from lattice parameters of Mahana et al [74] and Vasylechko et al [95], respectively. e1, e2 and e3 are linear strains calculated for a reference system with axes parallel to the crystallographic a-, b- and c-dimensions, respectively, of the Pbnm cell calculated using the same sets of lattice parameters for the Gd-, Tb- and Sm/Y-manganites.
| e4 (cubic reference axes) | etx (cubic reference axes) | e1 (orthorhombic reference axes) | e2 (orthorhombic reference axes) | e3 (orthorhombic reference axes) | |
|---|---|---|---|---|---|
| GdMnO3 | 0.095 | −0.066 | −0.027 | 0.067 | −0.037 |
| TbMnO3 | 0.10 | −0.070 | −0.029 | 0.072 | −0.039 |
| Sm0.6Y0.4MnO3 | 0.095 | −0.068 | −0.027 | 0.068 | −0.038 |
| LaMnO3 | 0.034 | −0.038 | |||
| GdAlO3 | 0.009 | −0.003 | |||
| TbAlO3 | 0.015 | −0.006 | |||
| CaTiO3 | 0.012 | −0.002 |
Calculating linear strains with respect to the crystallographic axes of the Pbnm structure (table A1) shows that the preferred orientation of magnetic moments in the colinear-sinusoidal antiferromagnetic structure and the propagation direction of both the ab- and bc-cycloidal magnetic structures ([010]), is parallel to the direction in which the Jahn–Teller distortions produce elongation by ∼7% with respect to the reference cubic structure. Linear strains in the other two directions, e1 and e3, are both negative (contraction).
High resolution thermal expansion data of Meier [64] (see also [47, 65, 66]), show that spontaneous strains arising from coupling with the magnetic order parameters in GdMnO3 and TbMnO3 are about two orders of magnitude smaller than those due to the combination of tilting and Jahn–Teller distortions. They vary in the range ±∼0.0002 and, in combination, give a volume strain, Vs, of up to ∼−0.0004 (figure A2(b)). Linear strains occur ahead of TN1 in both GdMnO3 and TbMnO3 and, although the temperature of onset and the magnitudes are not well constrained by the data owing to the need to define baselines for the reference structure (figures A2 and A3), these correlate with a well-defined change in trend of the temperature dependence of phonon-frequencies below ∼100 K [21, 67].
The sign and trend of each of the linear strains GdMnO3 and TbMnO3 (figures A3(b) and (d)) is similar above and below TN1, suggesting that the local structural and magnetic changes responsible for the precursor effects are closely related to the static colinear-sinusoidal incommensurate magnetic structure. Linear strains coupled to the magnetic order parameter(s) then display differences between the two materials, reflecting differences in details of the evolution of the magnetic structures at lower temperatures. Any additional anomalies in linear strain variations through and below TN2 are barely detectable in TbMnO3 (figures A3(e)–(g)). In GdMnO3, which has a different orientation of cycloid plane, there is a reversal of the trends of e1 and e2 with falling temperature (figure A3(b)). The final small adjustments below TR, accompanying ordering on both the Tb and Gd sublattices, are positive for e3 and negative for e1 and e2, (figures A3(b), (e)–(g)).
Volume strains are, in effect, an integration of the contribution of all ordering of moments irrespective of the actual ordering scheme and are essentially indistinguishable between GdMnO3 and TbMnO3 (figure A2).
Variations of spontaneous strains due to magnetic ordering in NdMnO3 are shown for comparison in the appendix
6.4. Strain/order parameter coupling
The fact that changes in resonance frequencies at TN1 and TN2 described above confirms that coupling of the magnetic order parameters with strain is weak. Lowest order coupling terms of linear strains, e1, e2, e3, with the driving order parameter, M, for magnetic transitions in an orthorhombic crystal will have the form λeM2. These would be expected to give rise to the classic pattern of elastic softening below a second order transition shown first for the displacive transition in SrTiO3 [70]. However, such softening requires that the order parameter can relax on the same time scale as the variations of strain in the acoustic resonance modes. This is seen at the antiferromagnetic ordering transition in CoF2, for example, where the magnitude of the coupled strains is also less than ∼0.001 [71]. Accompanying the elastic anomaly in CoF2 is a classic peak in Q−1 due to critical slowing down as the transition point is approached from above and below. The absence of both effects through the magnetic transitions in any of the crystals investigated here implies that relaxation of the magnetic order parameter in response to an induced strain is slower than ∼10−6 s. Evidence of the Debye and dielectric loss peaks at ∼80 K is that switching of local electric dipoles is already reduced to less than this timescale before the transition temperatures are reached. If there is coupling between local magnetic and electric dipole moments, the relaxation time of electric dipoles would provide the rate limiting step for relaxation of the magnetic order parameter.
Coupling of the form λe2 M2 is always allowed and does not require dynamical relaxation. It will give stiffening or softening in proportion to M2, depending on the sign and magnitude of the coupling coefficient, λ, (as set out in detail in [72], for example). The variation of f2 at TN1 suggests slight stiffening (λ positive). Any anomaly at TN2 is barely detectable in TbMnO3 (figures A3(d)–(g)), consistent with the colinear-sinusoidal to cycloidal magnetic transition being accompanied by changes in the magnitudes of the strain coupling coefficients that are negligibly small. Anomalies in f2 at TN2 and TN3 in GdMnO3 indicate that there are small differences in the strength of coupling with the magnetic order parameters of the colinear-sinusoidal incommensurate, antiferromagnetic and cycloidal structures.
6.5. Strain relaxation in the vicinity of TR
Given that there are small changes in e1, e2 and e3 near TR for both GdMnO3 and TbMnO3 (figures A3(b)–(g)), ordering of Gd3+ and Tb3+ moments might to be expected to give rise to closely similar changes of elastic properties. Rounding of the peak in heat capacity (e.g. [42, 45, 52, 55, 73, 74] for GdMnO3) is indicative of ordering in a field created by the ordered Mn3+ moments rather than at a discrete phase transition, but there are indeed small anomalies in the temperature dependence of f2 close to the expected values of TR (figures 4 and 8). However, there is a distinct Debye-like peak in Q−1 ahead of TR in the three crystals containing Tb but not in data from the crystal containing Gd. It appears, therefore, that there is a defect pinning or freezing process which is unique to the cycloid structure.
An increase in the imaginary part of the ac magnetic susceptibility of TbMnO3, measured at frequencies of 0.5–3 kHz, has also been observed below ∼10 K [29]. The form of this is consistent with there being a peak in magnetic loss below the lowest temperature data point of 5 K. Extrapolation to a measuring frequency of 3 kHz of the straight line fit to the acoustic loss data for crystal 2 in figure 12(b) would give ωτ = 1 at ∼3 K. In other words the data are indicative of a magnetoelastic relaxation mechanism, with dynamics constrained by an activation energy of ∼0.002 eV. The loss mechanism is, as yet, undefined.
Two separate loss peaks in figure 12(a) imply two separate processes with slightly different relaxation times. One possibility for the loss mechanisms relates to freezing of dynamical motion(s) of Tb3+ moments which have some alignment with Mn3+ moments at 15 K in TbMnO3 [38], i.e. ahead of TR. A second possibility is suggested by low temperature dielectric spectroscopy data between 5 and 16 K for DyMnO3 which were interpreted as being due to motion of boundaries between ab- and bc-cycloid domains on a timescale of ∼10−7 s [75]. However, there should not be any shear strain contrast across domain walls of the bc-cycloid so that an externally applied shear stress would not be expected to cause them to move. The significant point is that the activation energy barrier is substantially smaller than for the loss process at ∼80 K which is interpreted as being due to coupling of local electric dipoles with polaron-like strain clouds.
7. Discussion
An indicative feature of proper ferroelectric, improper ferroelastic transitions arising by ordered displacements of the B-site cation in perovskites is steep softening of the elastic moduli as the transition point is approached from above, as has been observed at RUS frequencies in BaTiO3, PbSc0.5Ta0.5O3, PZN-PT and PIN-PMN-PT, for example [76–79]. The softening is indicative of fluctuations which may be related to a soft mode [33]. Crystals containing Tb certainly have some resonance modes which show slight softening (figures 5, 7 and 9) while the crystal of GdMnO3 (figure 3) does not, but the amount of softening is small in comparison. There also appears to be no evidence for a soft mode which might be indicative of an incipient ferroelectric transition. As proposed by Schrettle et al [20], relaxational effects therefore appear to be the dominant feature of the structural dynamics as the low temperature instabilities are approached.
7.1. Weak coupling of strain with magnetic order parameters in systems with large shear strain due to cooperative Jahn–Teller distortions
Strain coupling is evidently a significant component of the overall structural and thermodynamic evolution of these systems. The most obvious effect is seen in the relationship between the preferred direction of incommensurate modulations and the orientation of the large strains due to Jahn–Teller distortions and octahedral tilting. The sinusoidal and cycloidal modulations have their propagation directions parallel to [010], the direction in which strain coupled to the Jahn Teller/tilt order parameters is positive (e2 in table A1). In the other two orthogonal directions, the strains are negative, representing lattice contraction.
Linear strains accompanying the low temperature transitions are very much smaller. They do not have such an obvious orientation relationship with the magnetic structures, but they are clearly dependent on subtle differences in the evolution of the order parameters. On the other hand, the volume strain is essentially an integration of volume reductions associated with ordering of moments at each Mn3+ ion, irrespective of which long-range ordering scheme is adopted. The evolution of Vs is essentially the same for TbMnO3 and GdMnO3 and has the same form as in NdMnO3 (figures A2(b) and A4(b)). In NdMnO3 the main transition occurs at ∼85 K and is from a paramagnetic structure to an A-type antiferromagnetic structure (e.g. [1, 2, 68, 69]). It is notable, in particular, that the onset of volume strains in TbMnO3 and GdMnO3 can be detected from ∼90 K (figure A2(b)), indicating that short-range magnetic ordering develops well above TN1 in a temperature range that is not dissimilar from that of the long-range ordering in NdMnO3. There are small volume strains associated with ordering of the moments of Gd3+, Tb3+ and Nd3+, but these are an order of magnitude smaller.
The pattern of volume strains correlates with the pattern of phonon frequencies in the sense that selected modes of NdMnO3, TbMnO3 and GdMnO3 all show an onset of softening through a similar temperature interval [2, 67, 80].
7.2. Dynamical precursor state
Precursor short-range ordering ahead of TN1 is seen also in other properties. The dc magnetic susceptibility of both polycrystalline and single crystal samples of GdMnO3 has been found to follow the Curie–Weiss law only down to ∼80 K [29, 41, 74]. In TbMnO3 the onset of deviations from Curie–Weiss evolution of the inverse magnetic susceptibility is between ∼80 K, measured parallel to [100], and ∼200 K, measured parallel to [001] [52]. O'Flynn et al [52] already interpreted this, together with the magnetic field dependence of the heat capacity at 60 K and a significant precursor effect in the heat capacity (seen also in Sm0.6Y0.4MnO3 [58]), in terms of short-range correlations of magnetic moments within the stability field of the paramagnetic structure ahead of TN1. A similar conclusion was reached for GdMnO3 by Ferreira et al [21] and Vilarinho et al [80] on the basis of their observation of changes in phonon frequencies below ∼100 K, again well ahead of the low temperature phase transitions. By way of contrast, the inverse magnetic susceptibility of GdAlO3, which has magnetism arising only from Gd3+, remains linear right down to the Néel point of ∼4 K.
The overall implication is that freezing of local ferroelectric dipoles in these manganites is accompanied by the development of a well-developed precursor state involving coupling between local strain and static or dynamical short-range magnetic order. TbMnO3 also has an anomaly in thermal conductivity which starts to develop below ∼150 K [66].
7.3. Loss mechanisms within the precursor state
Acoustic attenuation near 150 K is most likely related to the increase in electrical conductivity with increasing temperature in all the samples, which accounts also for the steep increase in dielectric loss. In GdMnO3, the activation energy for ac conductivity through the interval ∼125–175 K was reported by Pal and Murugavel [81] to be ∼0.13 eV and the conductivity mechanism was attributed to small polaron hopping. Analysis of a peak in pyrocurrent at ∼120 K by Zhang et al [82] yielded an activation energy of ∼0.11 eV and was also attributed to dipole reorientation or release of charge from localised states. This compares with Ea/r2(β) values also close to ∼0.1 eV from fitting of the peak in Q−1 (figure 11). The pattern of loss in this temperature range is also sensitive to the oxygen content of the sample, as seen by the difference between Q−1 data above ∼120 K for TbMnO3 crystal 1 (figure 5(b)), which was grown in air, and crystal 2 (figure 7(b)), which was grown under argon.
The loss peak near 80 K appears to be unique to orthorhombic manganite perovskites, as it was not observed in RUS measurements of Pbnm oxide perovskites that do not display magnetism, ferroelectricity or cooperative Jahn–Teller distortions, such CaTiO3 [83] and BaCeO3 [84]. It was also not observed in the multiferroic hexagonal manganite YMnO3 [31] which has an antiferromagnetic ordering transition at ∼75 K. In view of the close relationship between the acoustic and dielectric properties shown in figure 13, there is little doubt that the loss mechanism involves freezing of electric dipoles with local strain coupling. The loss parameters from fitting the data in terms of a thermally activated process in figure 11(f), τo ∼ 10−10 s, Ea ∼ 0.04 eV, provide a measure of the dynamics of this mechanism.
Activation energies of ∼0.07 eV appear to be characteristic of polaronic relaxation in perovskites more generally [85]. This view is reinforced by comparison with the dielectric loss patterns in ferroelectric or incipient ferroelectrics which do not have magnetic transitions. For example, the incipient ferroelectric KTaO3 remains cubic down to the lowest measuring temperatures but has an acoustic loss peak at ∼60 K with Ea ⩾ ∼0.09 eV, from a resonance with frequency near 740 kHz [86]. There is also a frequency dependent dielectric loss peak in the temperature interval ∼40–60 K with Ea ∼ 0.04 eV [87], which presumably has the same origin.
Precursor strains which occur in the same temperature interval as these Debye-like freezing processes have the same sign as the strains which continue to develop below TN1 in GdMnO3 and TbMnO3 and below TN2 in TbMnO3 (figures A3(b) and (d)). On this basis, it appears that the local dynamical structural state is likely to be related to the configuration of long-range magnetic ordering in the colinear-sinusoidal and cycloidal structures. It should be noted, however, that Pal et al [27] reported activation energies of ∼0.03–0.04 eV obtained by analysis of a broad pyrocurrent signal at ∼50 K and a dielectric loss peak in GdMnO3, which they suggested could be extrinsic due to defect dipoles associated with oxygen nonstoichiometry and mixed valence of Mn.
7.4. Frustration
The importance of frustration effects, arising from ferromagnetic nearest-neighbour and antiferromagnetic next-nearest-neighbour interactions, in promoting the stability of magnetoelectric structures in RMnO3 perovskites was emphasised from the start by Kimura et al [1]. Competition between different static magnetic ordering schemes results in progressive suppression of the A-type antiferromagnetic structure in the sequence La-, Pr-, Nd-, Sm-, Eu-, Gd-, TbMnO3 associated with increasing lattice distortions that arise from the reductions in ionic radius. It now appears that suppression of long-range ordering in GdMnO3 and TbMnO3 is mitigated by local dynamical ordering which enhances the stability of the paramagnetic structure below ∼80–100 K. The more complex incommensurate and cycloidal structures only develop once the thermally activated fluctuations revealed by the patterns of acoustic and dielectric loss have frozen out. These dynamical effects involve electric dipoles which have a relative strong coupling with strain. In addition, however, there must be contributions from weaker coupling of magnetic moments with strain which freeze out within the stability field of the cycloidal structure. Evidence of these is provided by the acoustic loss peaks near 10 K in the RUS data from TbMnO3 (figure 12).
Frustration effects could be modified by competing strain fields in doped crystals. Replacing 2% of Mn3+ by Fe3+ is not likely to affect the magnetic ordering but, by comparison with La substitution in PrAlO3 [88], corresponds almost exactly with the substitution limit at which strain fields around one dopant cation would start to overlap with the strain fields around nearby dopant cations and thereby modify the properties of the whole crystal. f2 for several resonance modes from TbMn0.98Fe0.02O3 (figure 9) show slight softening with falling temperature but there is no evidence of any of the steep softening which would be expected if there was any marked tendency to stabilise a more typical ferroelectric structure, such as in BaTiO3 for example. The origin of the softening therefore is more likely to be a slight adjustment to the coupling of small strains with the magnetic order parameter(s).
7.5. Implications for thin films and multiferroic domain walls
Coupling between strain and magnetic or electric dipoles is extensively exploited in thin film applications since the substrate allows the functional properties to be manipulated through the choice of imposed strain fields. Of particular interest in the present context is the fact that thin films of TbMnO3 and GdMnO3 contain abundant self-organised twin domains (e.g. [9, 10, 15, 89, 90]). While it might not be possible to switch these domains by any external field because of their attachment to the substrate, they are in effect ferroelastic twins due to lowering of symmetry from cubic or tetragonal to orthorhombic. Because the tilt, Jahn–Teller and magnetic order parameters all couple with strain, it is inevitable that steep strain gradients through ferroelastic twin walls will cause the magnetic and ferroelectric properties of the twin walls to differ from those of the twin domains. For example, Daumont et al [90] have proposed that a high density of twin walls in a thin film of TbMnO3 on SrTiO3 might contribute to ferromagnetism which is not seen in bulk samples.
There do not appear to be reports of ferroelastic twinning in single crystals but if it was possible to grow crystals containing multiple ferroelastic domains walls, such as have been observed in LaMnO3 for example (see figure 1(a) of Dechamps et al [91]), they would be expected to display quite different magnetoelectric properties and should lead to new possibilities for engineering of functional nanostructures. The mobility of ferroelastic and multiferroic domain walls in such crystals will be constrained significantly by the polaronic freezing effects identified here but, if they are sufficiently broadened by the influence of their magnetic component, they might become able to ride over the strain fields of local pinning points. In DyMnO3, for example, domain walls between ab- and bc-cycloid domains appear to be mobile on a timescale of less than ∼10−6 s down to at least 5 K [75].
8. Conclusion
Measurements of elastic and anelastic properties have revealed a well-defined temperature interval ahead of the magnetoelectric phase transitions in GdMnO3 and TbMnO3 where local, dynamic correlations of electric and magnetic polarisation couple with strain on a time scale of ∼10−6 s. Relaxation times reduce with falling temperature in a manner that is consistent with a rate determining step which depends on the mobility of polaron-type strain clouds, such that the magnetically ordered structures become stable only after these have become effectively immobile. Stabilisation of the paramagnetic structure by dynamical, short-range ordering local magnetic and ferroelectric moments, at the expense of the homogeneous A-type antiferromagnetic structure, is likely to be a significant factor in determining the form of the phase diagram in which the transition temperature of the first magnetic transition reduces from La through to Gd and then increases from Dy to Ho. Magnetoelastic loss peaks at lower temperatures demonstrate, also, that aspects of the magnetoelectric structure remain mobile down to at least ∼5 K.
Acknowledgments
We thank Professor T Lorenz, University of Cologne, for constructive criticisms of the manuscript. This work was funded by EPSRC Grant No. EP/P024904/1 (UK), and Projects Nos. NORTE-01-0145-FEDER-022096, UID/NAN/50024/2019, SK-PT-2015-0030 and VEGA No. 2/0137/19 (Slovakia). RUS facilities were established through Grants from the Natural Environment Research Council (Grants Nos. NE/B505738/1 and NE/F017081/1) and the Engineering and Physical Sciences Research Council (Grant No. EP/I036079/1) to MAC. The work at the University of Warwick was supported by EPSRC, UK through Grant No. EP/T005963/1. Funding through the NTNU Onsager Fellowship programme is also acknowledged.
Appendix A.: Strain analysis
Figure A1 shows the reference system used to calculate values of shear strains etx and e4 from lattice parameter data at room temperature. These symmetry-adapted strains correspond to a tetragonal shear strain with its unique axis parallel to [001] in the Pbnm setting, and a shear strain in the ab-plane. etx is given by (1/√3)(2e1 − e2 − e3), where e1 is the strain parallel to X, e2 is the strain parallel to Y and e3 is the strain parallel to Z, as defined with respect to a cubic reference structure. Values of the lattice parameter for the reference cubic structure, ao, have been taken to be (aPbnm .bPbnm .cPbnm /4)1/3. The full set of equations is given in Carpenter et al [92]. Room temperature data for e4 and etx in GdMnO3, TbMnO3 and Sm0.6Y0.4MnO3, calculated using lattice parameter taken from the literature, are listed in table A1. Data for LaMnO3, GdAlO3, TbAlO3 and CaTiO3 are included for comparison. For strains determined with respect to an orthorhombic reference structure: e1 = ((aPbnm /√2) − ao)/ao, e2 = ((bPbnm /√2) − ao)/ao, e3 = ((cPbnm /2) − ao)/ao.

Figure A1. Reference system used to calculate values of shear strains etx and e4. In both TbMnO3 and GdMnO3 magnetic moments of the colinear-sinusoidal incommensurate antiferromagnetic structure are parallel and antiparallel to bPbnm . The repeat direction of the cycloidal structure is also parallel to bPbnm . In TbMnO3 the cycloid is within the bc-plane and the electric polarisation is parallel to cPbnm . In GdMnO3 the cycloid is within the ab-plane, the electric polarisation is parallel to aPbnm and the weak ferromagnetic moment arising from canting is parallel to cPbnm .
Download figure:
Standard image High-resolution imageLinear thermal expansion data from Meier [64] (and see also [47, 65, 66]) are reproduced in figures A2 and A3 in order to illustrate the form and magnitude of spontaneous strains which arise by coupling with the driving order parameters at the low temperature transitions in GdMnO3 (TN1 ≈ 41 K, TN2 ≈ 23 K, TR ≈ 6 K) and TbMnO3 (TN1 ≈ 41.5 K, TN2 ≈ 28 K, TR ≈ 7 K). The raw data are given in the form Δa/a, Δb/b, Δc/c where Δa, Δb and Δc are changes in linear dimensions of a single crystal measured parallel to the crystallographic x-, y- and z-axes of space group Pbnm, and a, b, c are the lattice parameters at the lowest temperature at which measurements were made. The change in volume, ΔV/V is given by Δa/a + Δb/b + Δc/c. In this form, the three linear spontaneous strains, e1, e2, e3, and volume strain, Vs, are given by the difference between observed values and values of a baseline extrapolated from fits to data above the transition temperatures. A convenient expression to represent the baselines, taking account of the requirement that they have zero slope as T → 0 K, is

where Ao and A1 are constants, T is temperature and Θs is a saturation temperature (following [96–100]). Fitting this expression to the unit cell volume data of Agostinho Moreira et al [101] over a wider temperature interval up to 250 K and excluding the influence of the phase transitions gave Θs ≈150 K, which is typical of values in the range ∼100–150 K obtained for the evolution of thermal expansion in other perovskites as T → 0 K (e.g. [102–104]).
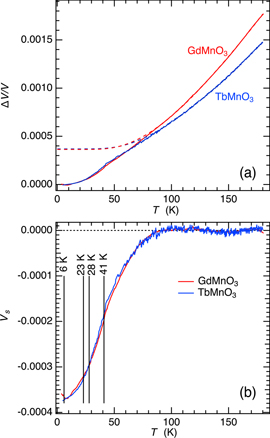
Figure A2. (a) High resolution volume expansion for GdMnO3 and TbMnO3 obtained by summation of data for the three linear expansion directions reported in Meier [64]. Dashed lines are baselines, representing volume expansion of the high symmetry structure, obtained by fitting equation (A1) to data in the temperature interval 85–181 K. (b) Variations of volume strain, Vs, given by the difference between the measured values and baseline values of ΔV/V shown in (a).
Download figure:
Standard image High-resolution image
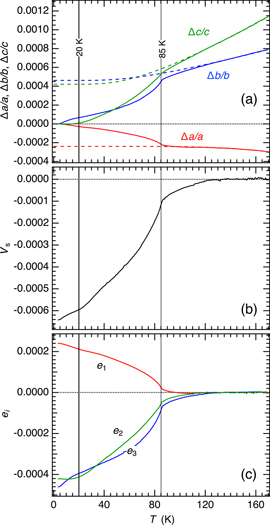
Figure A3. (a) and (c) High resolution linear thermal expansion data for GdMnO3 and TbMnO3 reported in Meier [64]. Dashed lines are baselines, representing linear expansion of the high symmetry structure, obtained by fitting equation (A1) to data in the temperature interval 149–181 K with Θs fixed at 137 K for GdMnO3 and 135 K for TbMnO3. (b) and ( d) Variations of the spontaneous strains, e1, e2, e3 given by the difference between measured values and baseline values of Δa/a, Δb/b, Δc/c. (e)–(g) Expanded views of the linear strains for TbMnO3 at the lowest temperatures.
Download figure:
Standard image High-resolution imageFitting equation (A1) to the volume expansion data in the temperature interval 85–181 K gave Θs = 137 K for GdMnO3 and Θs = 135 K for TbMnO3. These baselines are shown as dashed lines in figure A2(a) and are similar to equivalent extrapolations of Raman mode frequencies reported for TbMnO3 by Mansouri et al [67] and for GdMnO3 by Vilarinho et al [80]. Volume strains, Vs, given by the difference between baseline values and observed values are shown in figure A2(b). Vs variations associated with the low temperature transitions are indistinguishable for both materials and appear to consist of two parts. A precursor effect amounts to ∼−0.0002 below ∼80 K and a further change of ∼−0.0001 occurs below TN1. There is no obvious anomaly at TN2 or TR. The negative sign of Vs is consistent with positive values of dTN/dP for all three transitions in TbMnO3 [105].
Repeating the baseline fitting procedure for each of Δa/a, Δb/b, Δc/c in the temperature interval 149–181 K, keeping the value of Θs fixed at 137 K for GdMnO3 and 135 K for TbMnO3, gave the dashed lines in figures A3(a) and (c). Values of linear strains e1, e2 and e3 due to coupling with the order parameters were then obtained as the difference between the measured and baseline values. There are again precursor effects but variations below ∼41 K amount to only up to ±∼0.0002. The magnitude of the precursor effects is highly sensitive to the choice of baseline, but the trend is the same in both GdMnO3 and TbMnO3. There is a difference in magnitude by a factor of 10 between GdMnO3 and TbMnO3, but e1 and e2 are positive and negative, respectively. e3 values remain much smaller, indicating that the principal strain is shearing in the ab-plane.
All three linear strains maintain the same trend through TN1, implying that the dynamical magnetostructural effects above TN1 are closely related to the static magnetisation of the incommensurate magnetic structure down to TN2. This has magnetic moments aligned parallel to [010] in the Pbnm setting. The same trends continue below TN2 in TbMnO3 (figures A3(d)–(g)) but show small reversals in GdMnO3 (figure A3(b)). The difference is presumably due to coupling of strains with the cycloidal magnetic ordering in the ab-plane of GdMnO3 as opposed to the bc-plane of TbMnO3. Electric polarisation is along [100] in the ab-cycloid and along [001] in the bc-cycloid. There are additional very small changes in linear strains below the temperatures, TR, at which magnetic ordering on Tb and Gd contributes to the overall magnetically ordered structure.
These patterns of strain evolution may be contrasted with the strains which accompany magnetic ordering in NdMnO3. The transition in this case occurs at ∼85 K and is from a paramagnetic structure to an A-type antiferromagnetic structure (e.g. [1, 2, 68, 69]). Canting of the moments results in weak ferromagnetism with a net moment aligned parallel to [001] [69, 106], though Chatterji et al [68] had proposed that the canting only starts at lower temperatures. Ordering of the moments at Nd occurs below ∼20 K [68, 69]. The net ferromagnetic moment due to Nd3+ ordering in the low temperature structure is aligned in the opposite z-direction from the moment due to the prior canting of Mn3+ and causes the Mn-canting angle to rotate so that the direction of both becomes the same [69].
Figure A4 contains results from analysis of high resolution linear thermal expansion data for NdMnO3 from Meier [64] (and see also [66]). The primary data are reproduced in figure A4(a). Dashed lines represent baselines from fitting equation (A1) to data above TN1, in order to estimate the values for e1, e2, e3 and Vs (calculated here as Vs = e1 + e2 + e3) shown in figures A4(b) and (c). Notwithstanding uncertainties arising from the choice of baselines, maximum values of the strains are closely similar to those obtained for TbMnO3 and GdMnO3. However, in contrast with the large contribution of precursor strains below ∼100–150 K and the small breaks in slope at TN1 seen for TbMnO3 and GdMnO3, the antiferromagnetic ordering transition in NdMnO3 is marked by a clear break in slope and only small precursor effects. The smoother variations for TbMnO3 are evident also in lattice parameter data reported by Blasco et al [107] for the temperature interval ∼2–320 K. The more classical pattern of non-symmetry breaking strains accompanying a co-elastic phase transition (no symmetry breaking shear strain, coupling of the form λeM2 giving e ∝ M2) shown by NdMnO3 is confirmed by the lattice parameter data of Chatterji et al [68]. There is a further break in slope of the strains in figure 4 at ∼21 K, particularly in Vs, consistent with the temperature reported by Chatterji et al [68] for ordering of moments of Nd.
Figure A4. (a) High resolution linear thermal expansion data for NdMnO3 reported in Meier [64] and Berggold et al [66]. Dashed lines are baselines, representing linear expansion of the high symmetry structure, obtained by first fitting equation (A1) to data in the temperature interval 123–190 K for Δc/c which gave Θs = 104.7 K. This value of Θs was fixed when fitting to the data for Δb/b in the same temperature interval. The baseline for Δa/a was fit to data in the temperature interval 120–170 K and had Θs = 369 K.
Download figure:
Standard image High-resolution image
In summary, spontaneous strains arising by coupling with the magnetic order parameters are very much smaller than those which would typically arise by coupling with tilt or Jahn–Teller order parameters. The predominant effects in TbMnO3 and GdMnO3, both with respect to linear strains and the combined volume strain, are the precursor contributions ahead of TN1 and the small changes of slope associated with the magnetic transition at TN1. Subsequent changes due to the development of the cycloid and associated electric polarisation are even smaller, by comparison. The sign and evolution of each of the linear strains are similar to those below TN1, consistent with the precursor effects being due to coupling with a dynamically ordered structure which is locally similar to the long-range incommensurate magnetic structure. An important contrast with NdMnO3 is that the latter shows classical variations in strain associated with the discrete antiferromagnetic ordering transition, i.e. a small precursor effect followed by a significant break in slope at the transition point.