
Abstract
In this report, we present results of high-pressure experiments probing the melt line of zirconium (Zr) up to 37 GPa. This investigation has determined that temperature versus laser power curves provide an accurate method to determine melt temperatures. When this information is combined with the onset of diffuse scattering, which is associated with the melt process, we demonstrate the ability to accurately determine the melt boundary. This presents a reliable method for rapid determination of melt boundary and agrees well with other established techniques for such measurements, as reported in previous works on Zr.
Export citation and abstract BibTeX RIS
1. Introduction
Due to its resistance to corrosion and low thermal neutron cross-section, zirconium (Zr) metal and alloys are used in harsh chemical environments and cladding in nuclear reactors. However, Zr undergoes a series of solid–solid phase transitions that can hamper high-pressure (P), high-temperature (T) engineering applications. At room-temperature and with increasing pressure, zirconium transitions from the hexagonal close-packed (hcp) (α) phase to an open hexagonal (ω) phase and then to the body-centered cubic (bcc) (β) phase. The solid–solid phase transitions in zirconium have been studied extensively using techniques such as the diamond-anvil cell (DAC) and large-volume press compression coupled with x-ray diffraction (XRD) or x-ray absorption spectroscopy [1–9]. The static compression work has been complemented by shock compression, ramp compression [10], and first-principles calculations [11]. There has been much less work on the high-temperature behavior, in particular investigations of melting of Zr at high pressure, with only one experimental study covering a pressure range of ∼29–80 GPa [12] in addition to atomistic simulations below 12 GPa [13].
Experimental melting curves of materials are not only important to engineering applications but melting data are also critical to modeling and interpreting phenomena related to planetary interiors and impacts, as well as providing data for testing fundamental physics-based models of melting. Simply, the melt line is defined by the conditions when the Gibbs free energy of the solid and liquid phases are equal [14]. The slope of the melt line on a P–T plot is then given by the Clausius–Clapeyron equation,

where Tm is the melting temperature, ΔVm and ΔSm are the changes in molar volume and entropy upon melting, respectively [14]. However, because the molar volume of the liquid and entropy change are difficult to measure, two semi-empirical equations are often used to fit experimental melting curve data [14]. First, the Kraut–Kennedy equation,

expresses the melting temperature as a function of the volume compression of the solid and can be derived from the Lindemann law of melting [15, 16]. The Lindemann law predicts that melting occurs when the vibrational amplitudes of the solid lattice become so large that it is less stable than the liquid phase [17]. The subscripted 0 in equation (2) refers to ambient pressure. In this case, C in equation (2) is written as

and γ is the Grüneisen parameter [14, 16] defined as

α is the coefficient of volumetric thermal expansion, KT is the isothermal bulk modulus, ρ is the density, and CV is the constant-volume specific heat. The Kraut–Kennedy equation is generally more applicable to lower pressures where the Grüneisen parameter does not vary much with compression [14] because in equation (4) the numerator, the product αKT, can be approximated as constant. At higher pressures, this assumption does not apply because the bulk modulus increases more with pressure compared to the decrease in thermal expansion [18]. Second, the Simon–Glatzel equation,

where a and b are empirical fit parameters, is a combination of the Murnaghan equation of state and the Lindemann law of melting [14]. The Simon–Glatzel equation has been shown to work particularly well for a variety of materials (e.g., molecular solids, oxides, and silicates). The Simon equation has also been shown to fit experimental melting data for many metals over a large range of high pressures [12, 19–22] and is typically used in laser-heated diamond-anvil cell (LHDAC) studies of melting.
The laser-heated diamond-anvil cell can subject materials to P > 100 GPa with simultaneous temperatures above 3000 K. Melting can be determined in the LHDAC using plateaus in temperature versus laser-power curves as a result of latent heat of melting [23] along with onset of diffuse scattering from the liquid as observed through in situ XRD [24]. The laser-speckle method [25] identifies melting based on changes in the interference pattern from an argon laser shined on the surface of the sample. Theoretically, melting curves of metals have been determined using first-principles calculations [26], atomistic simulations using empirical potentials [13], or a combination of the two methods [27]. Some of the earlier melting curves measured in the LHDAC significantly disagree with those measured by shock compression or calculated using theoretical approaches. However, the recent improvement of synchrotron-based XRD as a melting diagnostic in LHDAC studies has greatly improved the situation and explanations have been provided for the older studies with lower melting temperatures at high pressure relative to shock compression and simulations. Specifically, the lower melting temperatures for molybdenum (Mo) determined by the laser-speckle method [28] and diffuse x-ray scattering [29] have been attributed to carbon (C) contamination and changes in the subsolidus microstructure [20]. In a more recent XRD study of tantalum melting which is more consistent with theory and shock data [24], the previous, lower melting temperatures from XRD [30] and from laser-speckle [28] were proposed to be a result of melting of the pressure-transmitting medium and carbon contamination. Finally, more recent experiments on iron (Fe) which detected melt using fast x-ray diffraction is in agreement with shock and ab initio calculations and up to 1000 K greater than the melting temperature of iron from the laser-speckle method which may have been detecting fast recrystallization rather than melting [19]. Considering that even older XRD studies of melting have been dramatically revised, using multiple diagnostics to determine melting is a more prudent approach. Thus, this study uses two independent diagnostics, one optical and one x-ray, to determine the melting temperature of Zr in the pressure range 10 < P < 40 GPa: (i) plateaus in temperature versus laser-power curves and, (ii) the observation of diffuse scattering in XRD. Because melting an impure solid results in melting-point depression due to the larger change in entropy relative to the pure solid, we used higher purity zirconium compared to existing data [12] and expected to measure higher melting points.
2. Experimental methods and analysis
We conducted five melting experiments in the pressure range of 10(1)–37(2) GPa. The numbers in parentheses represent the uncertainty in the last digit. All errors are reported at the 1σ confidence level unless otherwise noted. We used well-characterized zirconium from Los Alamos National Laboratory stock. The zirconium that we used is the same as the high-purity sample in Rigg et al [10] and contains 35 parts per million by weight (wt ppm) of hafnium, <50 wt ppm Fe, <20 wt ppm aluminum, <50 wt ppm vanadium, <50 wt ppm oxygen <20 wt ppm nitrogen, and 22 wt ppm C. In order to provide a suitable sample for laser heating, Zr was confined in between layers of potassium bromide (KBr) or potassium chloride (KCl) in order to thermally insulate the sample from the surrounding diamond anvils and the rhenium or stainless-steel gaskets used in our experiments. In addition to providing insulation, the alkali halides also served as an internal pressure marker. The measured lattice volume of KBr and KCl from XRD along with temperature measured independently as described below can be used to determine pressure based on previously determined thermal equation of state data [31]. In all experiments, DACs with diamonds having 300 μm or 600 μm culets were used. The sample chamber was prepared by laser drilling [32] a 100 μm or 250 μm hole into the pre-indented metal (rhenium or stainless-steel) gasket.
Compression and heating were performed in steps, first, by compressing the sample to the desired pressure, and then followed by laser heating up to and above the solid-melt transition. To minimize temperature gradients along the x-ray and compression axis, the Zr samples were heated from both sides using two 100 W ytterbium fiber infrared lasers (wavelength, λ = 1064 nm) [33]. In situ XRD measurements were performed simultaneously as the samples were heated using the online laser system and x-ray setup at the High Pressure Collaborative Access Team beamline (HPCAT) 16-ID-B of the Advanced Photon Source. The experimental setup at HPCAT, which provides a large (∼30–70 μm full width at half maximum) laser spot and coupled with a small (∼4 μm vertical x ∼6 μm horizontal) x-ray beam helps minimize the effects associated with radial temperature gradients. During heating, temperature was measured with spectroradiometry both upstream and downstream relative to the x-ray using a 50 μm diameter pinhole which, when magnified, collects light from a 4 μm diameter region on the surface of the sample. The intensity of the radiation as a function of wavelength from 600 nm to 800 nm was fit to the Planck radiation function assuming wavelength-independent emissivity. The measured temperature of the Zr sample in Kelvins, TZr, is taken to be the average of the upstream and downstream measured temperatures, Tup and Tdown. We assume an uncertainty on the zirconium temperature that includes the following components: (1) half the spread of the upstream and downstream temperature measurements which differed by <∼100 K; (2) 50 K predominantly for wavelength-dependent emissivity [34] but inclusive of system response calibration, chromatic aberration, and Planck fit errors; (3) small misalignments of the x-ray, temperature measurement pinhole, heating lasers, and sample that can occur during the course of a heating cycle [35] resulting in an additional 1.5% error primarily from radial temperature gradients. Thus, the zirconium temperature is
We ensured that the x-ray was actually probing the zirconium at the measured temperature by visually aligning the x-ray beam with an image of the temperature measurement pinhole before heating. The location of the x-ray beam was verified after temperature quenching. The x-ray beam was visualized from the x-ray induced fluorescence of the KBr or KCl.
Two-dimensional (2D) XRD patterns collected on a Pilatus 1M detector were integrated using the DIOPTAS software [36]. We determined the unit-cell volumes of the KBr or KCl by least-squares fitting of the d-spacings corresponding to the (110), (111), and (210) planes for KBr and (110), (200), (211), and (220) planes for KCl. We chose these peaks because they did not overlap with zirconium peaks. Total pressure of the sample at high temperature was determined from XRD (λ = 0.4066 Å) based on the thermal equation of state of KBr or KCl [31]. We assume that the average temperature of the insulation media in Kelvins, Tins, is between the temperature at the diamond-anvil surface (T = 300 K) and the peak measured temperature of the sample [37, 38] with an error (2σ) that spans that entire range plus the error on the measured temperature so that

The 1σ uncertainty in Tins was propagated through the total pressure calculation. We determined the melting temperature at high pressure by the qualitative, visual observation of plateaus or discontinuities in temperature versus laser-power curves due to latent heat combined with the qualitative determination of the onset of diffuse scattering in the XRD. The total pressure of the sample was calculated based on the first XRD pattern in the temperature plateau. The samples were observed using either 2D x-ray transmission scans or optical microscopy, before and after the heating in order to investigate possible changes in the sample morphology due to melting. We fit the zirconium melting temperatures as a function of pressure to the Simon–Glatzel melting equation (5).
3. Results and discussion
Similar to Lord et al [23], we observe three different types of temperature versus laser-power plateaus: (i) a smooth increase in temperature with increasing laser power then a constant-temperature plateau (figure 1(a)), (ii) a plateau in temperature followed by an increase in temperature with increasing laser power (figure 1(b)), and (iii) jumps or large fluctuations in temperature at constant laser-power after a plateau in temperature (figure 1(c)). We take the onset of melting to coincide with the onset of the temperature plateaus which can be identified qualitatively. The melting temperature at a given pressure is then based on the quantitative average of the temperature measurements within the plateau region where it is assumed that the laser power is providing the latent heat of melting [23]. Differences in heating duration or heating rate may explain the three different types of plateaus that we observe. For two different heating cycles, the time and rate of heating to reach the melting temperature for type (i) was 36 min and 40 min at 33 K min−1 and 19 K min−1, respectively. For two experiments that resulted in type (ii) heating profiles, the timescales were 4 min and 20 min at ∼303 K min−1 and ∼51 K min−1. Finally, the type (iii) temperature discontinuities were produced by heating cycles that lasted 3 min, 5 min and 8 min. The heating rates for observations of type (iii) temperature versus laser power behavior were 365 K min−1, 197 K min−1, and 140 K min−1. Broadly, it seems that slower heating over a longer period of time results in more traditional temperature versus laser power plateaus while short, rapid heating results in temperature instabilities or the ability to push beyond an initial plateau. In this study, we used all of the different heating rates to determine the melting temperature. The melting temperatures at pressures of 10 GPa, 17 GPa, 23 GPa, and 37 GPa were determined from one heating cycle each, which displayed plateaus of types (i), (iii), (iii) and (ii), respectively. The melting temperature at 16 GPa is based on the average of three heating cycles that each resulted in melting and displayed one of all three types of plateaus. Future studies could minimize the effect of heating rate by employing pulsed laser-heating [20]. Although it is assumed that plateaus in temperature versus laser power are due to the laser power providing the latent heat of melting [23], other possible explanations may account for this behavior. Large increases in the thermal conductivity of the KBr or KCl insulation layers at high temperature or changes in the reflectivity of the Zr metal at high temperature may also account for the temperature versus laser-power behavior that we observe [39]. Phenomena related to thermal conductivity or reflectivity have been postulated to explain the differences between temperature plateaus and XRD diffuse scattering in previous Zr melting studies [12]. Anomalies in the reflectivity of Zr are plausible based on the other anomalous behavior such as fast self-diffusion and grain growth in zirconium and other bcc metals [1, 6, 40–42]. However, we also observe an onset of diffuse scattering in XRD that is consistent with the plateaus in temperature versus laser power similar to the behavior of nickel [43], vanadium [44], and tin [45] but different than previous studies of Zr [12] and titanium (Ti) [26]. Previous zirconium [12] and titanium [26] melting curve studies were performed, by two different groups, almost entirely at higher pressures and temperatures (P > 30 GPa and T > 2600 K) than our experiments. Except for the experiment at P = 10 GPa which started as a mixture of ω-Zr and hcp α-Zr before heating, the XRD in our experiments showed that Zr was in the hexagonal ω-phase and transformed to the bcc β-phase at the lowest temperature we measured (T = ∼1100 K) consistent with the phase diagram of Zr [2, 7]. We observe recrystallization before melting similar to previous studies [12, 26]. During this rapid recrystallization, single spots of bcc-Zr corresponding to different diffraction planes appear and disappear over intervals of less than 3 min with each increasing temperature and sequential diffraction pattern (figure 2). Eventually, an increase in background was observed around the bcc-Zr (110) peak at 2θ = ∼9–10° (figure 3) if the patterns are offset such that their backgrounds are equivalent at 2θ = 8° and 11°, consistent with previous observations of melting in Ti and Zr. We assume that the increase in background is from the initiation of melting but this assumption could lead to an overestimate of the melting temperature if there is not sufficient melt initially to be detected by XRD. The evidence for melting from temperature plateaus and XRD is consistent with visual observation of changes in sample morphology after heating using either 2D x-ray transmission scans or optical microscopy where we see the sample coalescing into a ball (figure 4) or spreading outward due to melt migration (figure 5). B2-KBr and β-Zr both have a body-centered cubic structure and the d-spacings differ by less than ∼3% over the pressure and temperature ranges of this study. The peaks associated with the (110) planes for both phases are the most intense and clearly distinguishable from one another, and is thus the only location where diffuse scattering is clearly observed. However, the melting temperatures of the insulation layers [46] are ∼350–700 K above our measured Zr melting temperatures and it may be safe to assume that the diffuse scattering originates from the Zr. We observe significant formation of zirconium carbide in the experiment at P = 23 GPa, and as such we cannot rule out C from the diamonds being incorporated into the bcc-Zr structure. If carbon diffusion into bcc-Zr occurs, then due to melting point depression, our melting curve would represent the lower bound. Melting determined using faster (i.e., μs-scale) time-resolved next-generation x-ray measurements, for example using x-ray free electron lasers (FELs), may help reduce or eliminate the effect of chemical reactions compared to slower continuous laser-heating experiments such as those presented here where the sample is heated on the order of minutes.

Figure 1. Temperature versus percent of maximum laser power output for Zr compressed in a LHDAC to P = (a) 10 GPa, (b) 23 GPa and (c) 16 GPa. The red dashed lines show the average temperature in the plateaus which was located by visual inspection.
Download figure:
Standard image High-resolution image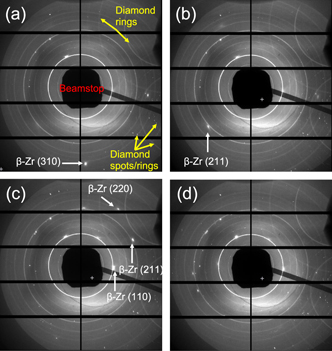
Figure 2. X-ray diffraction patterns of zirconium and KBr at P = 16 GPa and T = (a) 1790 K, (b) 2000 K, (c) 2400 K, (d) 2400 K showing the recrystallization of β-Zr before melting. The recrystallization is exhibited as the appearance and disappearance of Zr diffraction spots (labeled) with increasing temperature and time. The solid rings are diffraction from the KBr powder. Spots and rings from internal reflections and diffraction from the diamond anvils as well as the x-ray beamstop which protects the detector from the direct beam are also labeled in (a).
Download figure:
Standard image High-resolution image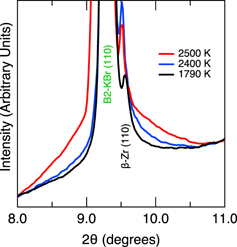
Figure 3. Integrated x-ray diffraction patterns showing liquid diffuse scattering from Zr melting during laser-heating at P = 16 GPa. The T = 1790 K and T = 2400 K patterns are integrated versions of the 2D patterns in figures 2(a) and (c). The diffraction peak from the KBr insulation and pressure standard is labeled. Here, the d-spacing corresponding to the (110) peak for Zr differs by only by ∼3% from the (110) peak of KBr. This degree of peak separation is typical of all of the observed reflections for both phases.
Download figure:
Standard image High-resolution image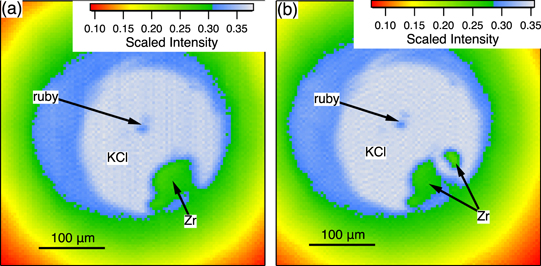
Figure 4. Two-dimensional x-ray transmission scans of a Zr sample with KCl insulation (a) before and (b) after the heating cycle at P = 10 GPa in figure 1(a). The resolution of the scans was 400 μm × 400 μm in 4 μm steps. The two roughly spherical grains near the middle of the sample chamber are ruby.
Download figure:
Standard image High-resolution image
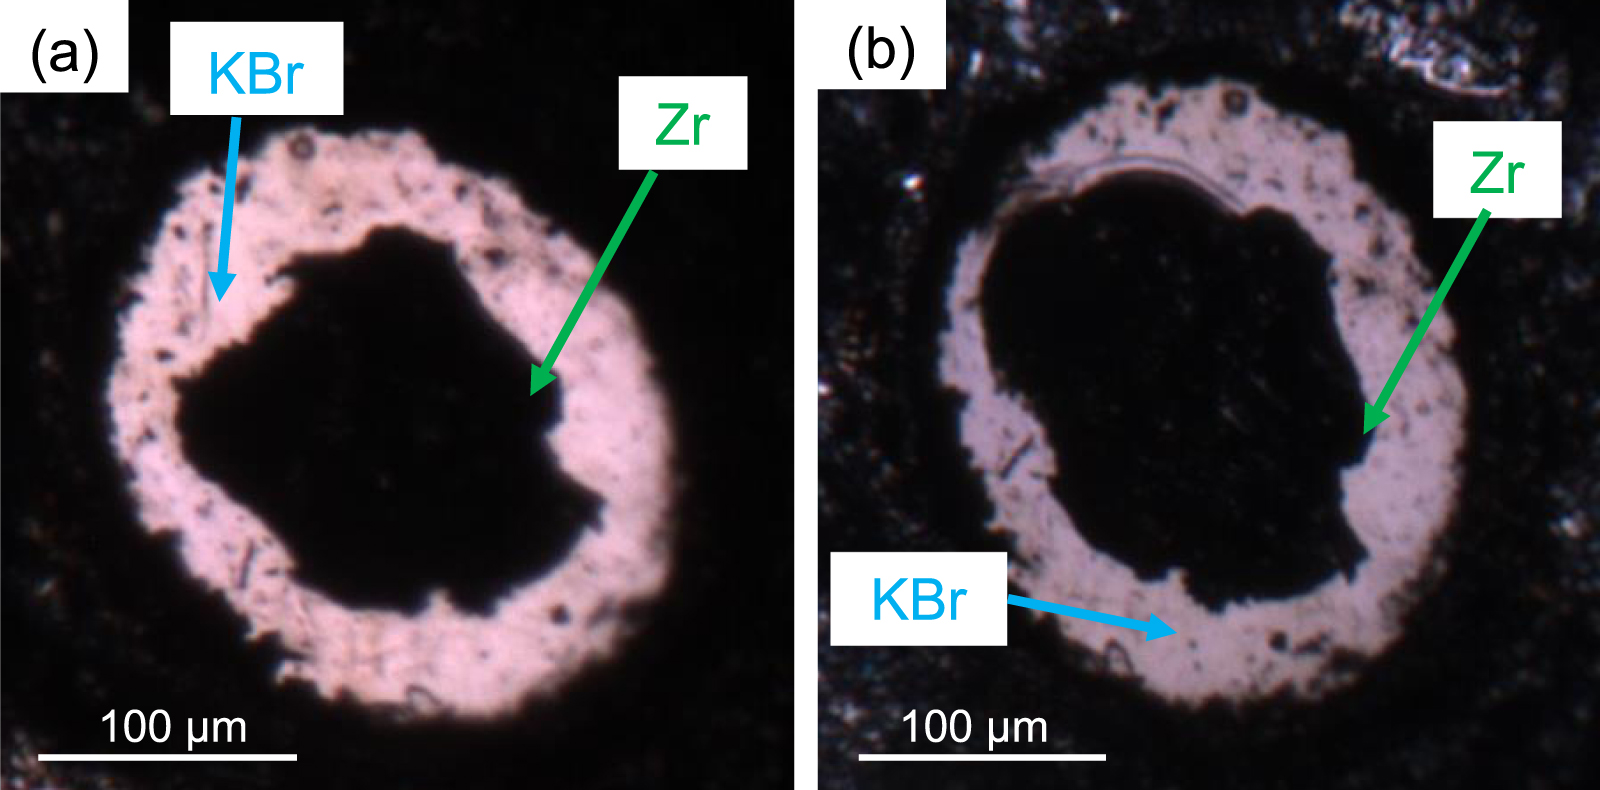
Figure 5. Optical micrographs of a Zr sample, as viewed through the cylinder diamond, (a) before and (b) after melting at P = 17 GPa.
Download figure:
Standard image High-resolution imageWe measured Zr melting over the ranges Pm = 10(1)–37(2) GPa and Tm = 2300(200)–2800(300) (figure 6). The reported melting temperatures are those determined from the temperature versus laser power curves. We assume an uncertainty in the melting temperature of 10% which accounts for errors in the temperature measurements (typically ∼5%–8%), standard deviation of the plateau averages (typically ⩽∼4%), and locating the plateau. The errors in melting pressure include the propagated errors in the KBr or KCl pressure standard volumes (<1%), uncertainty in the temperature of pressure medium (∼50%). Due to their low thermal expansion coefficients at high pressure [31], the large errors in the temperature of the KBr or KCl only translate to errors in the total pressure at high temperature of ∼5%–6%. Errors in the pressure standard equation of state parameters were not reported [31] and therefore not considered in our error analysis. Our melting temperature, Tm = 2800(300) K, at P = 37 GPa is within uncertainty of the Parisiades et al [12] experimental data (Tm = ∼3000 K at P = 38 GPa) where they used less pure zirconium (99.2% purity). Therefore, it appears that initial sample purity does not have a resolvable effect on the melting temperature as determined by laser-heated diamond-anvil methods. At P = 10 GPa, our melting temperature is 2300(200) K which is identical, considering mutual uncertainties, to the Tm = ∼2260 K calculated using EAM potentials [13]. Fitting our experimental data, the EAM data of Smirnova et al [13] and the LHDAC data of Parisiades et al [12] as a combined dataset to equation (5), the Simon–Glatzel melting equation, with Tmo = 2127 K, yields a = 68(3) GPa, and b = 0.76(4).

Figure 6. Melt line of zirconium (red). Data from our LHDAC experiments are combined with results from the higher pressure LHDAC experiments from Parisiades et al [12] and the lower pressure atomistic simulations from Smirnova et al [13] using the embedded-atom method. The stability fields of the solid phases of zirconium (α-hcp, β-bcc, and ω-hexagonal) are shown with the boundaries calculated from Greeff [11].
Download figure:
Standard image High-resolution imageAt 0 GPa, the Clapeyron slope of titanium, dTm/dP = 37 K GPa−1, is greater than Zr where dTm/dP = 24 K GPa−1 (figure 7). With increasing pressure, the Ti melting curve becomes shallower than the Zr melting curve such that at 80 GPa, dTm/dP = 4 K GPa−1 while Zr remains at dTm/dP = 20 K GPa−1. The shape of the slope of the zirconium melting curve from atomistic simulations [13] is remarkably similar to that of the experimental melting curve for titanium [26] (figure 7). The EAM data predict an initially steep melting curve for Zr (dTm/dP = 64 K GPa−1 at P = 0 GPa) and quickly flattens out such that at P = ∼9 GPa, dTm/dP = 6 K GPa−1. The similarities between the theoretical melting curve of Zr [13] and experimental melting curve of titanium [26] may be a reflection of the similarities in the phase diagrams below ∼30 GPa between the two group IVB transition metals [11, 47]. However, it should be noted that the EAM calculations (figure 6) predict an overturn in the melting curve which is unusual for a pure elemental metal and lacks a physical explanation. Our LHDAC experiments and the LHDAC experiments of Parisiades et al [12] do not predict a flattening of the melting curve of zirconium which is different than the titanium melting curve [26] also produced by the LHDAC using similar criteria for melting. A decrease in the thermodynamic stability of the crystalline phase with pressure has been proposed as a physical explanation for the flattening of the melting curve in tin [45]. Also, changes in the subsolidus microstructure and carbon contamination in LHDAC experiments have been shown to affect the Clapeyron slope of metals such Mo [20, 28, 29, 48, 49].

Figure 7. Slopes of the zirconium and titanium melting curves as a function of pressure. The zirconium curves from our new experiments (blue, solid line) and Parisiades et al [12] (blue, dotted line) are based on laser-heated diamond-anvil cell experiments. The curve from Smirnova et al [13] (blue, dashed line) is from calculations using embedded-atom method empirical potentials. The aggregate curve (red, solid line) from this study is based on the melt line produced from fitting the combined data from our experiments, Parisiades et al [12] and Smirnova et al [13] in figure 6. The titanium curve is from LHDAC experiments [26].
Download figure:
Standard image High-resolution image
4. Conclusions
We measured the melting curve of zirconium from P = 10 GPa to P = 37 GPa using two melting criteria, plateaus in temperature as a function of laser power and observation of diffuse scattering using in situ x-ray diffraction, that agree with each other. This work provides the first experimental measurements of the melting curve of zirconium at P < 29 GPa. The melting curve that we measured is in agreement with previous embedded-atom method simulations [13]. Furthermore, we also see agreement with laser-heated diamond-anvil cell experiments [12] that used lower purity Zr. We do not observe an expected melting point depression when comparing the two experimental studies. Further systematic studies probing the effect of impurities using faster techniques such as x-ray heating via FELs or pulsed-laser heating are needed and may provide better resolution. The complexities in the melting curves of two similar transition metals, zirconium and titanium, warrant further experimental investigations and theoretical explanations. The melting curve of zirconium presented here, based on multiple independent diagnostics, provides more confidence for modelers studying zirconium under the extreme pressure-temperature conditions of shock loading as well as nuclear engineers who use Zr as cladding material.
Acknowledgments
JSP acknowledges support as an Agnew National Security Postdoc Fellow. This work was supported by the US Department of Energy (DOE) through the Los Alamos National Laboratory. Los Alamos National Laboratory is operated by Triad National Security, LLC, for the National Nuclear Security Administration of U.S. Department of Energy (Contract No. 89233218CNA000001). This work was performed at HPCAT (Sector 16), Advanced Photon Source, Argonne National Laboratory. HPCAT operations are supported by DOE-NNSA's Office of Experimental Sciences. The Advanced Photon Source is a U.S. DOE Office of Science User Facility operated for the DOE Office of Science by Argonne National Laboratory under Contract No. DE-AC02-06CH11357. Finally, we would like to thank two anonymous reviewers for their feedback that improved the manuscript.