
Abstract
With the intense and coherent x-ray pulses available from free-electron lasers, the possibility to transfer non-linear spectroscopic methods from the laser lab to the x-ray world arises. Advantages especially regarding selectivity and thus information content as well as an improvement of signal levels are expected. The use of coherences is especially fruitful and the example of coherent x-ray/optical sum-frequency generation is discussed. However, many non-linear x-ray methods still await discovery, partially due to the necessity for extremely adaptable and versatile instrumentation that can be brought to free-electron lasers for the analysis of the spectral content emitted from the sample into a continuous range of emission angles. Such an instrument (called MUSIX) is being developed and employed at FLASH, the free-electron laser in Hamburg and is described in this contribution together with first results.
Export citation and abstract BibTeX RIS

Original content from this work may be used under the terms of the Creative Commons Attribution 3.0 licence. Any further distribution of this work must maintain attribution to the author(s) and the title of the work, journal citation and DOI.
1. Introduction
Non-linear soft x-ray spectroscopies promise a unique access to functional materials. Early results have shown orders of magnitude signal enhancements for the highly informative x-ray fluorescence spectroscopies [1–4] with many details of the processes yet to be understood. In order to realise and explore novel techniques adequately, very flexible instrumentation is needed that allows us to freely choose the relative angles between the sample, incoming and outgoing x-ray and optical laser beams. While the optical beams can easily be transmitted through large optical windows, all soft x-ray beam paths need to be realised in an ultra-high vacuum environment. Spectral analysis of the outgoing beam is necessary for spectroscopic information. With the new MUSIX (multi-dimensional spectroscopy and inelastic x-ray scattering) endstation, we fulfil all these requirements and enable such studies.
In the following, we will discuss the scientific motivation for building an appropriately complex and flexible instrument. We present x-ray/optical sum-frequency generation (SFG) as a potential candidate to yield similar information as the more traditional synchrotron spectroscopy resonant inelastic x-ray scattering (RIXS), which is very successful in the study of functional materials but suffers from low signal levels [5]. SFG though can deliver much higher signal levels than RIXS and opens the door for even more evolved higher-order wave-mixing x-ray spectroscopies, which supply novel information. The realisation of an x-ray SFG experiment requires the geometry to fulfil phase matching conditions, which necessitate the large flexibility in angular arrangements.
The MUSIX instrument was designed as an appropriate mobile setup to implement such experiments, while its flexibility enables it to be used as a platform for various other studies. We discuss design choices and how we implemented the required degrees of freedom as well as the design of the spectrometer.
On the way towards the realisation of the SFG experiment, we recorded fluorescence spectra of test samples to demonstrate the spectroscopic capabilities of the instrument and present the results in this publication.
2. Scientific motivation
2.1. Potential for non-linear soft x-ray spectroscopies
The excitation spectrum of materials encodes their functionality: for materials with a metal–insulator transition, it is the opening of an excitation-less electronic band gap that is the microscopic quantity, which characterises the phase transition. In superconductors, the gap in the excitation spectrum of the superconducting condensate is responsible for enabling the lossless transport of electrical current.
To understand materials' functionality and ultimately tailor materials to our needs, it is necessary to experimentally determine the excitation spectrum in great detail. Using methods in the (soft) x-ray region, the information can be enhanced, e.g. with selectivity to positions in crystal momentum space. Furthermore, one can use the element specificity of x-ray resonances and their shifts in the energy spectrum depending on the chemical environment to gain chemical information. RIXS measures x-ray fluorescence spectra for excitation energies across elemental resonances and allows to directly extract the fundamental excitation spectra with high selectivity and information content [5].
Especially in combination with the intense femtosecond x-ray pulses from free-electron lasers (FELs), soft x-ray RIXS is applied in addition for time-resolved measurements, typically studying the response of a system after excitation with an ultrashort laser pulse [6]. Applications of this methodology range from fundamental studies of processes in matter [7] to (photo-) chemical problems [8–12], as well as questions in materials science [13].
Unfortunately, many of the applications of RIXS suffer from limited signal levels. This has two main reasons: on one hand, for relevant elements in the soft x-ray region, typical fluorescence yields are smaller than 1%, i.e. less than one incident photon out of one hundred are converted into a fluorescence photon to be detected in RIXS [14]. On the other hand, optics in the soft x-ray region rely on very shallow incidence angles and are limited in size. While RIXS signals are emitted rather isotropically, typical spectrometers can only accept fractions on the order of  –
– of the full emission angle [15–17]. New methods to improve signal levels in RIXS while keeping similar information content are thus desirable.
In the optical regime, non-resonant Raman scattering also gives access to the excitation spectra of materials, but without the element selectivity of RIXS. Signal levels are similarly low. For optical wavelength though, a whole suite of non-linear spectroscopies is established in order to increase the signal levels or even to gain enhanced information. With the electric field strength nowadays available at FELs, the development of a non-linear x-ray toolbox of spectroscopic techniques is possible. For example, using stimulated processes in combination with RIXS allows to suppress Auger decays, thereby enhancing the fluorescence yield. Additionally, the radiation gets focussed, ideally towards a small grating spectrometer, rendering the limited acceptance angle irrelevant. Such a technique enhances the signal levels in RIXS by orders of magnitude [1–4].
The benefits of non-linear optical techniques do not cease at stimulated processes though. A whole suite of wave-mixing techniques is available, all of which are subject to special selection rules and probe different features of the interrogated systems, as follows from an analysis of the underlying sequence of microscopic transitions between different states [18, 19].
Typically, non-linear optical processes can be separated into parametric and non-parametric processes. Parametric processes do not alter the quantum state of the material, while non-parametric processes often include some absorption of energy. A set of non-parametric processes has been demonstrated in the x-ray regime [1–4, 20–26]. However, we also realised that the desired process oftentimes gets shielded or even inhibited by undesired concurrent decays due to the absorptive nature of the non-parametric processes [27].
In contrast to the optical regime, x-ray excited state life times are often around 1 fs [28], whereas available pulses are typically longer. Thus, only part of the incident radiation interacts with the excited state, while a large part of the radiation interacts with the system after it has decayed via other channels: in the soft x-ray range, Auger decays are dominant and followed by a cascade of electronic excitations strongly altering the electronic distribution in the sample.
Parametric processes can define a pathway out of this dilemma [29, 30]. Since no energy is absorbed in the process, the method can be tuned to be unaffected by Auger cascades and x-ray induced ultrafast sample damage. However, the scaling of cross-sections [3, 31] surely requires resonant x-ray excitation in order to observe sizeable effects, which in turn may unavoidably lead to undesired concurrent and potentially damaging processes.
A large part of the signal gain in those novel x-ray spectroscopies is enabled through a coherent interaction of many atoms with the x-ray field, which can only be realised for well-defined phase relationships, i.e. when certain phase matching conditions are met. Phase matching conditions fix the relative angles between incoming and outgoing beams. Demonstrating such non-linear processes requires the observation of a specific angular as well as spectral dependence [29], thus creating the need for specialised instrumentation. For the soft x-ray range, we put the MUSIX instrument into operation which serves as a platform for demonstrating and using non-linear soft x-ray methods on solids.
2.2. X-ray/optical sum-frequency generation
In the following, we will describe in more detail one of the most promising non-linear soft x-ray methods and how x-ray/optical sum-frequency generation (SFG) can deliver similar information as normal RIXS spectroscopy. Due to its directional nature, the signal can be enhanced by the coherent interaction of many scatterers. It also becomes nearly background-free, thus facilitating detection with small acceptance devices. As a parametric process, SFG leaves the system in the ground state and thus allows to circumvent issues with sample damage. Furthermore, the signal strength depends only linearly on the x-ray fluence and the experiment can be conducted at comparably low x-ray intensities, which again avoids damaging processes, e.g. due to concurrent x-ray absorption at energetically lower lying states that do not take part in the desired process.
In the following discussion, we assume that the sample under consideration is non-centrosymmetric such that dipole selection rules do not strictly apply, making SFG possible. In reality, the applicability of this assumption in the soft x-ray region still has to be quantified: the electronic transition selection rules typically apply more strictly in the x-ray regime than for optical processes. This is due to the well-defined symmetry and local nature of the x-ray addressed core states, whereas optical processes target valence transitions, often involving strongly hybridised states with mixed character. Nevertheless, x-ray excitation is a rather strong distortion of the system and subsequent vibrational coupling enables dipole forbidden electronic transitions [32, 33].
In the original practice of RIXS spectroscopy, a resonant incident energy is selected in order to excite a system into an unoccupied core excited state with a photon of energy  . The system then spontaneously decays into a low energy excited state (with excitation energies
  sometimes in the optical energy range) through the emission of a photon at red-shifted lower energy
  , with
  (see figure 1). Since this decay is spontaneous, it is incoherent and the direction of emission is largely isotropic. In some cases, the low energy excited state will decay back to the ground state via optical fluorescence, spontaneously emitting a photon of energy
  .
.
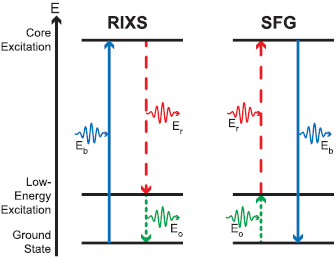
Figure 1. Comparison of the processes in RIXS and SFG: in RIXS (left), a photon with energy  creates a core excitation, which decays spontaneously by emitting a photon of lower energy
  , leaving a low-energy excited state behind, that eventually can decay by emission of another photon of energy
  . In x-ray/optical SFG (right), the sequence is turned around but driven coherently: two photons with energies
  and
and  interact with the sample, yielding the emission of a sum-frequency photon with energy
  . The information content is essentially the same as in RIXS.
Download figure:
Standard image High-resolution imageX-ray/optical SFG essentially turns this sequence around (see figure 1): the system is simultaneously excited by an optical photon with energy  and an x-ray photon with energy
  and emits the sum-frequency photon
  . If all these photons are at resonant energies (as they naturally are when choosing the RIXS energies), the SFG cross-section is largely enhanced, since the total cross-section is proportional to the product of three individual resonant processes for each of the three involved photons [34].
A traditional RIXS spectrum is recorded at fixed  and displays emission intensities for a set of
  or respectively
  photon energies. In a full RIXS map, one then displays intensities for a set of
  (or
(or  ) photon energies for various different
  photon energies. In SFG, one relies on the tunability of the sources: the equivalent of a RIXS spectrum is recorded by measuring the emitted intensity at
  when simultaneously tuning
  and
and  such that their sum
  remains constant. The RIXS map is studied by independently tuning
  and
and  and recording the emitted intensity
  as a function of both.
In the SFG experiment though, the interaction between the photons and atoms can become coherent between different scatterers, such that the signal intensity grows with the squared number of interacting atoms, largely enhancing the signal. For this purpose, a phase matching condition has to be fulfilled, i.e. the vector sum of the incident wave vectors has to match the outgoing wave vector. Since the length of the outgoing wave vector is defined by its energy, this condition can only be strictly fulfilled for exactly one combination of angles. If the incoming beams have the correct angle with respect to each other, an outgoing SFG beam is formed towards the phase matching condition [34].
One important step towards the application of SFG in the soft x-ray region is to establish how strong this phase matching condition actually is: how broad is the angular spread of the outgoing beam and how much angular mismatch between the incoming beams can be accepted without substantial signal loss? Obeying the phase matching condition essentially limits the phase mismatch along the interaction path of the beams, i.e. when the radiation propagates through the sample. Since absorption lengths in the soft x-ray range are very short (often on the order of 20–100 nm [35]), the interaction length is limited and small angular deviations will only have a small effect on the signal.
If the penetration depth into the sample is very small, one can use a thin grating approximation and the interaction follows an alternative picture: the optical laser sets up a coherent superposition between ground and optically excited states with a spatially varying phase given by the spatially varying phase of the laser field. The x-ray beams then scatter off this grating. Fulfilling the phase matching condition is then equivalent to fulfilling the grating equation for the different beams of different wavelengths.
Despite these prospects to use x-ray/optical SFG as a complementary probe to RIXS, it is currently unclear how the transfer of crystal momentum (which is often studied with RIXS [5]) can be transferred to SFG, since the optical beam does not carry enough momentum to excite states with large crystal momenta. Potentially, higher order non-linear processes may present a solution and will require even more sophisticated experimental setups. Thus, the experimental approaches towards non-linear x-ray spectroscopies have been rather limited so far.
2.3. Need for a versatile instrument
The goal to observe and take advantage of non-linear x-ray phenomena has guided the design of the MUSIX instrument for multi-dimensional spectroscopy and inelastic x-ray scattering.
To realise experiments with beams from various directions and under various relative angles, this flexible ultra-high vacuum (UHV) instrument has been developed, allowing for a free choice of incoming and outgoing beam directions, a flexible environment for solid state samples, a state-of-the-art x-ray spectrometer for various different optical elements and a suite of ports for additional incoming beams, detectors or optomechanical devices. The applications of such a flexible instrument are of course not limited to the quest for non-linear wave-mixing x-ray spectroscopy, but also allow for conducting more traditional x-ray spectroscopy and diffraction experiments. The MUSIX instrument is a platform for hosting many different experiments at various free-electron laser or synchrotron beam lines. The instrument will be introduced and discussed in the following.
3. Experimental setup
3.1. Chamber and sample environment
The MUSIX setup implements a UHV diffractometer with a vertical rotation axis and three independent, though coupled, concentric rotations: respectively of the sample, the chamber lid with small detectors or optical elements and the spectrometer by means of rotating the whole chamber. This flexibility is required in order to generally be able to satisfy phase matching conditions for different target materials. Especially, the angle between beam line and spectrometer needs to be continuously adjustable. In combination with the requirement to achieve ultra-high vacuum conditions for soft x-ray spectroscopy, this presents a significant design challenge.
Some large scale RIXS spectrometers around the world already implement solutions, although generally only applicable to stationary instruments typically about 10 m in size. Freely tuneable spectrometer angles are often achieved with a non-concentric combination of three differentially pumped rotary feedthroughs. Implementations vary from distributing these feedthroughs only between sample and spectrometer [36] or using one at the beam line connection, accepting a moving sample chamber [37, 38]. An alternative is implemented at the European Synchrotron Radiation Facility (ESRF) with a differentially pumped sliding seal [17].
For MUSIX, those continuously variable spectrometer angle solutions turned out to be too heavy, bulky and expensive. In order to be transportable and to fit the experimental area at different beam lines, we had to limit the maximum distance from the interaction point to about 1.5 m.
We settled on a design with seven flanges in the horizontal plane at specifically chosen relative angles (see figure 2). By attaching beam line and spectrometer to different flanges, every relative angle from 45° to 180° can be achieved in discrete steps of 15° with often more than one possible combination. This limits the necessity to change the connections for every different angle, although sometimes disconnecting and reconnecting the beam line connection and the spectrometer cannot be avoided.

Figure 2. Top view of the UHV chamber, showing a cut at beam height with the sample to be placed in the center: the specific pattern of flanges connecting to either the beam line or the spectrometer becomes visible, which enables relative angles between the two between 45° and 180° in discrete steps of 15°. The chamber itself is cylindrical with a diameter of 500 mm.
Download figure:
Standard image High-resolution imageTo continuously cover the remaining 15°, the chamber has been designed with CF160 flanges at minimal chamber diameter to limit the angular range blocked by the vacuum hardware. At the chosen chamber radius of 250 mm (flange surfaces at 279 mm from the chamber center), a straight beam can reach the center of the chamber through the entrance flange even when the chamber is rotated by 
 around its center. Following this concept, a special beam line connection with guided vacuum bellows was designed allowing for about
 of rotation without breaking vacuum. Rigid guiding with a modified parallelogram was implemented to limit the strain on the beam line end upon rotating the chamber (figure 3).

Figure 3. Top view of the beam line connection assembly: a set of bellows with increasing diameter from the beam line side to the chamber side is welded to a set of guiding rings. The last bellows to the beam line are left unguided to allow for small chamber movements for alignment. The remaining guiding rings are rigidly connected to a motorised parallelogram, that moves together with the rotation of the MUSIX chamber (not shown). The top sketch depicts the situation with the beam entering normal to a flange of the MUSIX end station. Below, the chamber is rotated by 10° and the beam line connection is moved accordingly.
Download figure:
Standard image High-resolution imageThese continuous 20° of motion, together with the discrete steps of 15°, thus allow to reach every scattering angle between 35° and 180°. This solution is cheaper, much more compact, robust and lightweight than the alternatives described above, while accepting the necessity to break vacuum for large changes in scattering angle. From our experience, most experiments only need some continuous fine-tuning to reach the phase matching condition. The coarse choice of flanges for the beam line connection and RIXS spectrometer can easily be determined before the start of the experiment.
The flexibility of the instrument includes also the forward scattering direction, which allows analysing the beam transmitted through thin samples and thus enables transient absorption measurements with a broadband incident x-ray beam dispersed downstream of the sample.
The chamber itself is implemented as a two-circle diffractometer, with the sample manipulator rotating around the vertical in the central symmetry axis of the cylindrical chamber (angle  ). The
  detector circle was implemented to be moved independently of the spectrometer. The flat lid of the chamber is freely rotatable around the vertical and hosts various ports to introduce detectors or optics to the beam height from above. This continuous rotation diffractometer is thus independent of the spectrometer and additionally enables reflectivity or diffraction experiments, following a design by Dr Christian Schüßler-Langeheine implemented at the University of Köln and presently in user operation at the BESSY-II storage ring in Berlin, Germany [39].
The sample environment was designed to enable typical solid state diffraction experiments on quantum materials: samples can be mounted on cylindrical sample discs made out of copper with an integrated vernier scale to allow for in situ azimuth rotation with a hand operated vacuum screwdriver. Temperatures between 25 K and 400 K can be reached at the sample. This temperature range can potentially be extended with small modifications.
3.2. Spectrometer features
The spectrometer is designed around a single optical element with five degrees of freedom inside a separate grating chamber, which is attached to the main experimental chamber. The detector is housed in yet another chamber that can be moved independently with respect to the optical element (figure 4).
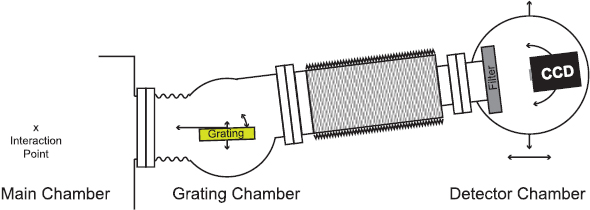
Figure 4. Side view of the spectrometer setup: short bellows ease mounting the grating chamber rigidly to the main chamber. The long bellows flexibly connects the detector chamber. Some degrees of freedom of the grating, CCD and the detector chamber are labelled.
Download figure:
Standard image High-resolution imageSome modern soft x-ray spectrometers are built around a single spherical diffraction grating with varied line spacing (VLS) [16], others include additional collecting optics (e.g. [17, 36, 40, 41]). For a portable experiment, the optical alignment needs to be quick. Therefore, we did not consider collecting mirrors for MUSIX. A spherical VLS diffraction grating guided the optical design and determined the required range of motion. For the purpose of exploring non-linear spectroscopies, a spherical grating has the additional advantage that, in the non-dispersive direction, the detector mostly shows the exit angle of radiation from the sample. This allows to study the phase matching condition and optimise the outgoing angle without the need for separate scans.
Alternative optical elements like off-axis transmission [42] or reflection zone plates (RZP) [43], which have recently been demonstrated for spectroscopy, can also be mounted and make use of the alignment capabilities of the grating holder. Those optical elements have imaging capabilities so that the non-dispersive direction can be used to image the sample with many useful applications [42]. In order to keep the instrument flexible, those optics can also be adapted; some early results from using a RZP are shown in this publication (see figure 6).
Another guiding principle for the design of MUSIX was to be able to remove the grating from the horizontal scattering beam path and move the detector into the horizontal scattering plane. This turned out to be very helpful for alignment while opening up the possibility to perform high angular resolution diffraction or small-angle scattering experiments, especially since the detector can be placed into the forward scattering direction.
As detector, we chose to implement an in-vacuum CCD mounted on a rotary feedthrough with the center of the CCD chip in the center of rotation, allowing for a continuously variable angle of incidence on the detector. The detector is manufactured by the company greateyes and provides 2048 by 2048 square pixels of 13.5 μm size. The entrance to the detector chamber is equipped with a light-tight filter holder, which can host a thin metal film filter to block optical light.
3.3. Grating parameters
The element determining the required range of motion for the grating holder is the VLS grating. The VLS parameters  ,
,  and
and  for the local line density at distance
  from the grating center
  were optimised using analytical formulae as discussed in [44, 45]. Using raytracing, the parameter
  was optimised later on to maximise resolving power. The grating was designed to cover a large range of photon energies in first order, starting with the 3d transition metal
  -edges (50–80 eV), the
  -edges of carbon (around 280 eV), nitrogen (around 400 eV) and oxygen (around 530 eV), potentially reaching early transition metal
  -edges in first order, while the full range can be covered in the second grating order. The resolution was maximised under the given constraints by source size and detector spatial resolution as well as the limited total length of the spectrometer. In order to increase throughput, a blazed grating structure was chosen.
The applied optimisation procedure was subject to the following input parameters: the total length of the spectrometer was restricted to 1.25 m and a source size of 10 μm and detector pixel resolution of 30 μm were used with an intermediate incidence angle on the detector of 70° off normal. The average line density  was chosen to be 1200 lines mm−1 as a compromise between high resolution, high efficiency and proven fabrication quality. The remaining grating parameters were analytically optimised for a set of energies in the middle of the anticipated working range (here 300–450 eV) and grating incidence angles known for high efficiency (87°–88.5°). This procedure yielded the grating radius, VLS parameters
  and
and  and the distances between source and grating as well as grating and detector.
In a next step, the grating parameters (VLS coefficients and radius) were fixed and the energy range that could be covered in first grating order was tested by changing the distances and angles. Constraints were put to fix the input arm length (distance between source and grating) between 300 and 500 mm and the total spectrometer length between 1130 and 1350 mm, while keeping the incidence angle on the detector smaller than 80° to the normal to increase detection efficiency.
This procedure showed that a grating originally optimised for an energy of 375 eV and an incidence angle of 87.7° should be able to cover an energy range from 50–650 eV in first order at a fixed incidence angle of 87.9° across the whole energy range. Resolving power calculations based on the analytical formulae from [44] (neglecting slope errors), yield theoretical values of more than 5000 for low energies and about 2000 at the high energy end of the grating range.
The chosen grating parameters are given in table 1. With the help of ray tracing calculations using RAY-UI [46, 47], the grating efficiency was estimated for different blaze angles; an angle of 1.8° was chosen as a compromise.
Table 1. Parameters of the VLS grating as derived with the described optimisation procedure.
| Radius | 139 32.7 mm |
|---|---|
 |
1200 lines mm−1 |
 |
1.674 lines mm−2 |
 |
1.85  lines mm−3 lines mm−3 |
 |
6.5  lines mm−4 lines mm−4 |
| Blaze angle | 1.8° |
From this grating optimisation procedure resulted the definitions of the required range of motion for the grating holder (input arm length, moved through a long-travel motorised stage inside the vacuum chamber) and the detector (distance and diffraction angle, moved out-of-vacuum) as shown in figure 5.

Figure 5. Required adjustment ranges to cover the whole energy range: from the interaction point at (0,0), the horizontal beam impinges on the grating center at a distance between about 300 and 420 mm. The detector then needs to be adjusted to the focal curve as shown for the highest and lowest energy in the graph.
Download figure:
Standard image High-resolution imageThe angle of incidence on the grating is the most sensitive parameter influencing the achievable resolution and can be adjusted with a high resolution in-vacuum motor. A translation parallel to the grating grooves as well as a rotation around the vertical axis are not crucial for the operation of a spherical grating spectrometer, but are important for the alignment of reflection zone plates and are implemented with vacuum motors. With an out-of-vacuum elevation table, the grating assembly can be removed from the beam path.
4. First results
After the instrument was assembled, several steps on the way towards realising the SFG experiment are necessary: as a first step, the performance of the spectrometer was checked and results using a reflection zone plate are presented below. The next step is to measure the performance of the diffractometer and establish accuracy and reproducibility of all degrees of freedom in a diffraction experiment; finally, we will add optical laser beams and perform novel experiments.
The first experiments with the MUSIX instrument were performed at the FL24 beam line at FLASH2 at DESY in Hamburg. The beam line can make full use of the fast tunability of FLASH2 through variable gap undulators and rather shallow incidence angles on the mirrors to increase the transmission for higher harmonics. It further allows to variably focus the beam down to several μm by means of bendable Kirkpatrick-Baez mirrors [48].
The high transmission of the beam line at short wavelengths allowed us to study the performance and capabilities of the MUSIX instrument at the nitrogen  -edge. As the dispersive element we used a reflection zone plate, specially designed to study nitrogen
  -edge emission with medium resolution and high throughput. The zone plate was designed such that a total of six different structures are found on the surface: three of them are optimised for photon energies around 395 eV (nitrogen
  -edge) and separated by a gap from the next three structures that are optimised for titanium
  -edge emission (around 460 eV, not used in this experiment). We used the parallel shift motion of the grating holder to place the nitrogen structures in the line of sight of the detector.
Nitrogen RIXS signals were excited by the third harmonic of FLASH2 with the machine operating at a fundamental wavelength around 9.2 nm (134 eV). Radiation from the fundamental, which does not contribute to the signal, was partially blocked by solid aluminum thin film filters (400 nm nominal thickness) to limit beam induced sample damage. We used the full bandwidth of FLASH2 without monochromatisation, so that an energy bandwidth on the order of 4 eV was excited in parallel. This allowed us to record RIXS spectra for a set of central excitation energies in comparably short time (about 15 minutes per spectrum), using bursts of 100 pulses repeated with 10 Hz (1000 pulses per second). For this spectroscopic study, we set the detector to read out at 10 Hz, intrinsically averaging the 100 pulses in each burst. As test samples we used bulk pieces of aluminum nitride, boron nitride and silicon nitride, which showed distinct differences in the absorption as well as the emission spectra as displayed in figure 6.

Figure 6. RIXS maps of boron nitride, silicon nitride and aluminum nitride across the nitrogen K absorption edge. The excitation energy was changed by moving the FLASH2 undulator gap. No further monochromatisation was used such that the excitation bandwidth is on the order of several eV. At the bottom, representative RIXS spectra are shown for each compound at an excitation energy around the absorption peak for the respective material. The emission energy axis is adjusted to match published spectra [49–52].
Download figure:
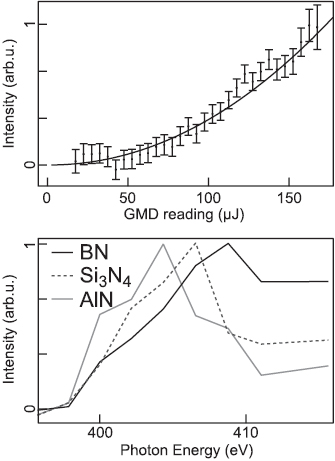
Standard image High-resolution imageAbsorption data were obtained by integrating over the fluorescence signals as recorded on the detector (partial fluorescence yield) for different central excitation wavelengths [53]. Using the intrinsic bandwidth of the FEL without monochromatisation only allows for rather coarse energy resolution in the absorption spectra. Since absorption signals are proportional to the incoming flux, the strong shot-to-shot fluctuations in the photon number at an FEL operating with the SASE principle (self-amplified spontaneous emission) [54] pose a challenge to an accurate normalisation of the data. Since our signal is only excited by the third harmonic content of the beam, we cannot directly normalise by the signal from the facility provided gas monitor detector (GMD) [55] which is dominated by the pulse energy of the fundamental emission.
We thus used the setup at a fixed wavelength to study the harmonic content of the FEL radiation as a function of the total pulse energy (dominated by the fundamental emission). FLASH2 was set to produce only single pulses at 10 Hz repetition rate. The acquired fluorescence spectrum from our CCD detector could now be correlated to the total pulse energy, measured by the facility provided GMD for each shot. Results are displayed in figure 7 and show a quadratic dependence of the third harmonic signal on the fundamental pulse energy. Accordingly, we used the square of the GMD reading to normalise our absorption data.
Figure 7. Top: correlation between the total pulse energy emitted from FLASH2 as measured with the gas monitor detector (GMD) and the nitrogen fluorescence signal induced by the third harmonic as measured on our detector via the reflection zone plate. The signal dependence is taken as an indication of the relationship between fundamental and third harmonic emission of an FEL. A clear parabolic dependence is observed and indicated with the fitted line. Error bars show the standard deviation of the data points.Bottom: energy integrated fluorescence signal of the different samples after excitation at different wavelengths as a measure of the x-ray absorption of the samples. These data have been normalised by the square of the GMD signal. Since no monochromator was used, energy resolution is given by the intrinsic bandwidth of FLASH2 on the order of 0.5%–1%. Within this resolution, the spectra match published data [49–52].
Download figure:
Standard image High-resolution image
The spectra displayed in figures 6 and 7 match within the experimental resolution with data published for the different compounds [49–52]. As expected for the nitrogen  -edge, the spectra are closely connected to the
  -symmetric density of states as projected onto the nitrogen
  core level via the measured dipole transitions. Since x-ray absorption probes the unoccupied states and x-ray emission shows the occupied states, the energetic separation of the band edges in both spectroscopies are an indicator of the band gap of the materials [56]. The chosen materials all exhibit a band gap on the order of 6 eV [49–52], which is reproduced in our data within the limited resolution of the absorption spectra. We observe a trend in the comparison of the absolute positions of the band edges, with aluminium nitride having band edges at consistently lower energy, followed by silicon nitride bands with the boron nitride bands a the highest energy. We connect this effect to a systematic chemical shift of the nitrogen
  core level in the different compounds. The elements Al, Si and B have increasing electronegativity in this order, such that the electron density at the nitrogen atom will decrease accordingly. This weakens the response of the system to the presence of the core-hole, the so-called screening response, which in turn yields an increased core level binding energy. This is in agreement with the observed trend in the measured spectra.
5. Conclusion
There is the potential for transferring non-linear spectroscopic methods from the realm of optical lasers into the world of x-rays. Some demonstration experiments have already been successful, but, especially in the soft x-ray range, a systematic exploration of the important parameter space, like incident and outgoing angles as well as photon energies has been limited up to now, mainly due to the lack of adequately flexible instrumentation at FELs. With the present MUSIX setup, we can close this gap by freely tuning the angle between samples, beam line and the spectrometer. This enables us to fulfil phase matching conditions for most experimental ideas. Furthermore, the presented setup can serve as a platform to implement more sophisticated ideas for manipulation of the incident beam, like x-ray beam splitting and recombination, focussing or dispersion. The spectrometer is in particular designed in a very flexible way to be able to host different kinds of optical elements, providing large motion ranges for manipulation.
With such a flexible setup now at hand, the exploration of the parameter space to realise new non-linear wave mixing experiments on solids in the soft x-ray range is within reach.
Acknowledgments
The setup as well as MB, PSM, RYE and JOS are funded through a grant to MB for a Helmholtz young investigator group under contract number VH-NG-1105. Many ideas for the fundamental chamber design as well as details of the sample environment have been adapted from designs by Christian Schüßler-Langeheine (Helmholtz-Zentrum Berlin) and his input, also to the present manuscript, is greatly appreciated. The design of the setup was completely performed in the DESY central construction facilities (ZM1) with leading contributions from Daniel Meissner and Ernst-Otto Saemann. The realisation of the project was coordinated by Martin Steudel (ZM2). Support from further colleagues and other support groups at DESY is gratefully acknowledged. We also thank the FLASH machine and photon operators for their support during the experiments.