
Abstract
In BaTiO3 the phase transition from tetragonal to cubic is connected with the disappearance of the ferroelectric polarization. In photoelectron spectroscopy huge transient shifts in the binding energies of all core-level photoemission lines have been observed while heating and cooling through the Curie temperature. Excitation energies from 2 keV to 6 keV have been used to show this to be a bulk effect and not a surface effect alone. These observations are discussed in terms of charging, which results from the disappearance of the ferroelectric polarization. This mechanism has previously been proposed as the origin of electron emission in ferroelectric materials. Besides the jump-like shifts, additional permanent shifts in binding energies have been observed for the tetragonal and the cubic phase. These experimental shifts have been related to theoretical ones from ab initio calculations.
In addition to BaTiO3 single crystals, systems with CoFe2O4 and NiFe2O4 overlayers on BaTiO3 have been investigated. The low conductivity of these layers sets them apart from metallic overlayers like Fe or Co, where the shifts are suppressed. This difference adds further support for charging as the origin of the effect.
Export citation and abstract BibTeX RIS

Original content from this work may be used under the terms of the Creative Commons Attribution 3.0 licence. Any further distribution of this work must maintain attribution to the author(s) and the title of the work, journal citation and DOI.
1. Introduction
Multiferroic materials have recently received increased research interest [1–3]. Due to the lack of single-phase multiferroics [4, 5], the focus of interest has shifted towards layered systems where each layer contributes its specific ferroic property and BaTiO3 has been established as a ferroelectric component [6–16]. In the context of this investigation, two out of the five phases of BaTiO3 are of interest. The tetragonal room temperature phase exhibits spontaneous remanent electric polarization, which vanishes at the phase transition to the cubic, paraelectric phase at a Curie temperature of TC = 120 °C. In general, this phase transition and the spontaneous and remanent polarization are understood in quite some detail [17–20]. This investigation with photoelectron spectroscopy reveals charge ordering induced by the phase transition as well as the related appearance and disappearance of electric fields.
Photoelectron spectroscopy with laboratory based x-ray sources (Mg  , 1253.6 eV and Al
  , 1486.7 eV) on single crystalline BaTiO3 has revealed shifts in binding energies of the Ba 3d and Ti 2p emission lines when passing through the phase transition [21]. Insulating BaTiO3 samples exhibit huge jumps of up to several tens of eV, whereas doped conducting samples present much smaller, but step-like jumps. An overlayer of ZnO has also shown such jumps in Zn photoemission lines [22]. These shifts have been assigned to charging of the surface during the phase transition. On the (0 0 1) surface of a BaTiO3 single crystal, the dynamics of ferroelectric domains have also been investigated using photoemission electron microscopy (PEEM) [23]. Surprisingly, the domains were still present well above the phase transition up to a sample temperature of 510 K. However, no jump-like changes have been observed at the phase transition in these PEEM investigations.
In order to better understand the shifts in photoelectron spectroscopy, experiments at high kinetic energy (HIKE) are presented. Their particular aim is to address the depth-dependence of this effect, i.e. whether the effect is limited to the surface of BaTiO3 or extends to larger depths. In addition, samples with overlayers of nickel and cobalt ferrites (CoFe2O4 and NiFe2O4) will be investigated. These materials are ferrimagnetic and candidates for multiferroic layer systems. After determining the influence of these overlayers on the shifts, a model will be developed, which explains the observed shifts qualitatively in terms of charging by mobile charge carriers, which occurs at the ferroelectric to paraelectric phase transition and has been proposed as the origin of ferroelectric electron emission (FEE) [24–26].
The experimental investigations are substantiated by theoretical calculations, which support the assignment of the small but permanent binding energy shifts for the two BaTiO3 phases to changes in binding energy, which have also been observed in conducting samples.
2. Experimental
Single crystalline BaTiO3 (10 mm × 10 mm × 1 mm) with polished (1 0 0) surfaces have been used as supplied from Mateck. They have been fixed to molybdenum sample holders using tantalum strips along their sides. Cleaning of the surface included rinsing in dilute hydrochloric acid and heating in vacuum.
The experiments have been carried out at the HIKE beamline KMC-1 at the synchrotron light source BESSY II in an ultrahigh vacuum (UHV) chamber with a base pressure below 5 × 10⁻⁹ mbar. Ti 2p, O 1s, and Ba 3d5/2 core-level photoemission lines of BaTiO3 single crystals have been recorded at a series of photon energies (2005, 3000, 4000, 5000, and 6000 eV) with resolutions from 0.1 eV to 0.2 eV. The Ba 3p3/2 photoemission line has been recorded at 6000 eV only. The size of the x-ray beam focus is 0.4 mm × 0.6 mm. In order to record spectra in normal emission, the sample has been rotated resulting in an angle of incidence of 60°. This has increased the x-ray spot size on the sample to 0.8 mm × 0.6 mm. While recording spectra the sample has been heated or cooled in order to pass through the ferroelectric-to-paraelectric phase transition of BaTiO3 at  C. The temperature range has been set to be approximately 5 K below and above the Curie temperature and the temperature ramp to 1 K min−1.
In order to prevent excessive and varying charging of the insulating BaTiO3 substrate an electron flood gun has been used. Even so, some charging has remained and required to calibrate the binding energy scale by setting the binding energy of the O 1s photoemission line of tetragonal BaTiO3 to a value of 530.0 eV. In order to check the reproducibility of effects, two separate cycles of heating and cooling have been performed for each spectral line. A snapshot mode of recording has been used, where a two-dimensional spectrum with a range of 14 eV and 75 frames has been taken every 5 s. With such settings temperature series like in figures 1–3 consist of 120 spectra. For some spectra the signal-to-noise ratio needed improvement by increasing the sampling times. In such series the number of spectra is down to 50.

Figure 1. Photoelectron spectra of Ba 3d5/2 emission lines from BaTiO3 at different photon energies while changing the temperature (a) hν: 2005 eV, heating up, (b) hν: 2005 eV, cooling down, (c) hν: 6000 eV, heating up, (d) hν: 6000 eV, cooling down.
Download figure:
Standard image High-resolution image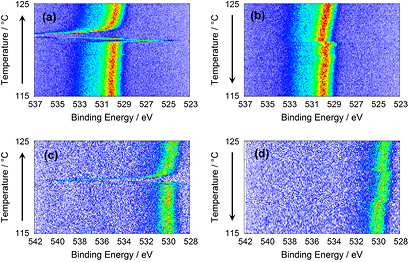
Figure 2. Photoelectron spectra of O 1s emission lines from BaTiO3 at different photon energies while changing the temperature (a) hν: 2005 eV, heating up, (b) hν: 2005 eV, cooling down, (c) hν: 6000 eV, heating up, (d) hν: 6000 eV, cooling down.
Download figure:
Standard image High-resolution image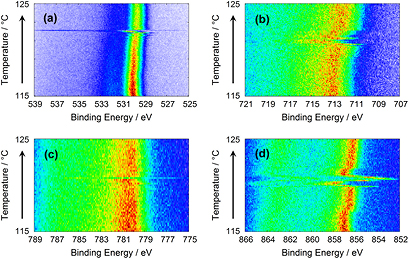
Figure 3. Photoelectron spectra from 10 nm thick CoFe2O4 and NiFe2O4 overlayers at a photon energy of 2005 eV while heating. (a) O 1s from CoFe2O4, (b) Fe 2 p3/2 from NiFe2O4, (c) Co 2 p3/2 from CoFe2O4, and (d) Ni 2 p3/2 from NiFe2O4.
Download figure:
Standard image High-resolution image10 nm thick layers of CoFe2O4 and NiFe2O4 have been prepared on BaTiO3 by ex situ pulsed laser deposition using a KrF (248 nm) excimer laser. The transport of the samples to the measurement chamber has been through air. The layers have been tested regarding their magnetic properties and a magnetoelastic coupling between substrate and overlayer has been found [13]. As with bare BaTiO3 single crystals, two separate cycles of heating and cooling have been applied while recording core-level photoemission lines of all elements. In details, the following emission lines have been recorded: O 1s, Fe 2p3/2, and Ni 2p3/2 for NiFe2O4 and O 1s, Fe 2p3/2, and Co 2p3/2 for CoFe2O4. Checking the Ti 2p and Ba 3d substrate emission lines revealed that their intensities were too small for recording while heating up or cooling down.
3. Ab initio calculations
Core-level binding energy shifts (CLS) have been calculated using density functional theory (DFT), where a complete screening (CS) model has been used. The CLS have been obtained as total energy difference between the unexcited ground state with N electrons and the fully relaxed final state with a core-hole at a single core-ionized atom. In this context, fully relaxed means that the core-hole has completely been screened by valence electrons [27].
The CLS of Ba 3d, Ti 2p and O 1s core-electrons in the tetragonal and cubic phases of BaTiO3 follows from  with
with  , where
  and
and  are the total energies with and without the core hole, respectively.
DFT supercell calculations have been carried out with a periodic approach and a plane wave basis set, as implemented in the VASP code [28, 29]. We have used the projector augmented wave method with a plane wave cutoff of 500 eV [30] and a gradient-corrected PBE functional [31]. All calculations have been based on a  supercell (27 units of BaTiO3) together with a
  Monkhorst–Pack grid.
4. Results
Sets of photoelectron spectra have been recorded from a BaTiO3 single crystal while heating it up from 115 °C to 125 °C and cooling it down. A major challenge has been a certain lack of reproducibility on the quantitative level. The size and shape of the jumps have varied a lot. As a remedy, a large number of spectra has been recorded in order to obtain a general idea of the jumps. Finally, sets of spectra have been selected, which represent the observations best and most clearly.
4.1. BaTiO3 single crystal
Figure 1 shows sets of photoelectron spectra with the Ba 3d5/2 emission line from a BaTiO3 single crystal at photon energies of 2005 eV and 6000 eV. The photoemission intensity is color coded from bright blue to black as indicated by the legend in figure 1. The four sets of spectra have been recorded while the sample has been heated up from 115 °C to 125 °C (left) and cooled down again (right). The top graphs (a) and (b) have been recorded at a photon energy of 2005 eV, the bottom ones (c) and (d) at 6000 eV. The photon intensity of the synchrotron beam line is much higher than laboratory x-ray sources and the spectra could be recorded much faster (see experimental for details). This enables a more detailed monitoring of the shifts. During heating up, transient jump-like shifts of the Ba 3d5/2 emission lines can be observed. When cooling down, these jumps are hardly visible. In addition to the jumps, the Ba 3d5/2 emission lines exhibit different binding energies for the cubic and the tetragonal phase. In order to obtain the characteristic behavior, several sets of spectra have been recorded. Representative examples are given in figure 1. Whereas in figures 1(b) and (c) the binding energies of the cubic phase are higher, it is smaller in figure 1(d). Comparing the sets obtained upon heating up and cooling down a hysteresis of 2 K is observed. We attribute this to temperature differences between sample and sample plate, where the thermocouple has been attached, and not to a significant effect of the phase transition.
Figure 2 shows sets of photoelectron spectra with O 1s emission lines from a BaTiO3 single crystal while heating it up from 115 °C to 125 °C (left) and cooling it down again (right). As in figure 1 the top graphs (a) and (b) have been recorded at a photon energy of 2005 eV, the bottom ones (c) and (d) at 6000 eV. Basically, the same qualitative effects are observed as in figure 1, namely large transient jump-like shifts of the O 1s emission line close to the temperature of the phase transition when heating up. The pronounced initial jump-like shift to smaller binding energies when heating up (figures 2(a) and (c)) is not observed in every run, but the large jump-like shift to higher binding energies is present in every set of spectra. As with the Ba 3d5/2 emission line in figure 1 the shifts are much smaller and sometimes hardly present when cooling down. The cubic phase at higher temperature exhibits a permanent shift to higher binding energies. Again, the size of this shift and in some exceptional cases even its sign change from run to run. No systematic difference between the spectra taken at photon energies of 2005 eV and 6000 eV is observed. Spectra taken at intermediate photon energies (3000, 4000, and 5000 eV) exhibit the same behavior. Therefore, their presentation is not required.
4.2. CoFe2O4 and NiFe2O4 layers on BaTiO3
Aiming for multiferroic layer systems, 10 nm thick overlayers of CoFe2O4 and NiFe2O4 deposited on a BaTiO3 substrate have been investigated. Figure 3 shows jumps in the O 1s, Co 2p3/2, Ni 2p3/2, and Fe 2p3/2 photoemission lines from CoFe2O4 and NiFe2O4 layers during heating. While cooling, the effect is generally smaller than the one while heating as already observed on the bare sample in figures 1 and 2. In figure 3 the effect appears to be the smallest for Co 2p3/2. Summarizing, the time constants of the jump-like shifts are found to be shorter than on the bare sample. The most extreme case is shown in figure 3(c) with the Co 2p3/2 line from the CoFe2O4 layer, where only a single spectrum is shifted. The lines of the other elements in figures 3(a) and (b) show additional small shifts, but also here, the large shift of the O 1s emission line in figure 3(a) is confined to a single spectrum. Figure 3(d) with the Ni 2p3/2 emission line is an exceptional example, because the sequence of the two jumps is reversed. The first jump is to higher binding energies and the second to lower ones.
Contrary to the photoemission lines from bare BaTiO3, no permanent shifts in binding energies before and after the jump can be observed for the photoemission lines from any of the ferrite layers.
5. Discussion
The spectra of figures 1 and 2 clearly show two different shifts of the photoemission lines, when crossing the Curie temperature of the transition from the ferroelectric (tetragonal) to the paraelectric (cubic) phase: huge jump-like transient shifts of several eV and much smaller permanent shifts of several 100 meV. Both shifts show no obvious dependence on excitation energy and hence probing depth. Therefore, surface related effects can clearly be ruled out. It is also noteworthy that the shifted photoemission lines of most spectra do not show any substantial peak broadening. The few exceptions will be discussed later. In the following we will elaborate that charging during the phase transition gives rise to the jump-like shifts, whereas the permanent shifts reflect different core-level binding energies in the two phases.
The huge jump-like shifts are attributed to charging caused by screening charges which remain, when the ferroelectric polarization changes or vanishes. This charging also leads to FEE as observed in various ferroelectrics [24–26]. In single crystalline BaTiO3 for example, FEE has been observed when the ferroelectric polarization is changed by applying an ac electric field to the sample [32]. For FEE to occur, charging must become high enough so that the resulting electric field is above the threshold for field emission. Experiments have qualitatively confirmed the dependence on sample thickness and dielectric constant as expected assuming a parallel plate capacitor model [25]. Compared to recording FEE, photoelectron spectroscopy (XPS) has two advantages: (1) charging can be investigated without any threshold; (2) positive charging can also be detected. The only requirement is a long enough lifetime of the charging. In the following, further details of the charging and its decay will be deduced from our experimental findings.
In the ferroelectric state, displacements of ions results in strong dipoles and screening the dipoles lowers the total energy. Under ambient conditions screening can result from adsorption of charged or polar molecules. However, the UHV conditions of our experiment suppress this mechanisms and screening can only happen by the accumulation of mobile charge carriers. Even in basically insulating samples with a corresponding low density of mobile charge carriers in the bulk, accumulation at the surface can lead to the high charge densities at or close to the surface as required for the screening. The polarization of  + domains are screened by electrons accumulated at or near the surface, the polarization of
  − domains by holes. Screening at the backside of the sample happens through opposite charges. The screening charges for
  domains are located throughout the bulk of the sample in the vicinity of domain boundaries.
At the phase transition the ionic polarization vanishes suddenly, the screening charges remain and create corresponding electric fields [33]. For  domains the fields are between back and front of the sample, for
  domains parallel to the sample surface. Conductivity and relative permittivity of the sample determine the time required for the neutralization of these charges and the concomitant decay of the fields. This model actually suggests an alternative explanation at least for some runs of the previous investigation of domains with PEEM [23]. In the ferroelectric state, the PEEM contrast results from the incomplete compensation of the ferroelectric dipoles. Above the phase transition, the image contrast does not represent ferroelectric domains at the surface but remaining screening charges. The contrast reversal corresponds well to the polarity change from dipole charges to the opposite screening charges.
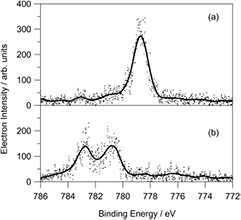
After passing through the phase transition from ferroelectric BaTiO3 to paraelectric, the presence of different domains implies a strongly inhomogeneous distribution of remaining screening charges across the surface. However, splitting of photoemission lines is hardly ever observed. This could simply result from the x-ray beam hitting only one domain. However, previous laboratory based experiments probed the whole sample or at least most of it which includes many domains. The spot size of the beam on sample from the experiment presented here, is at least ten times larger (0.8 × 0.6 mm2) than the size of ferroelectric domains. Furthermore, the domain structure is supposed to change every time the heating/cooling cycle is performed. With the high number of runs on the sample, different domains should have been probed, but a resulting splitting has hardly ever been observed. In a few cases strong broadening and even splitting of emission lines right at the phase transition have been observed. Figure 4 shows two selected spectra from the series in figure 1(c). Spectrum (a) is the first spectrum of the run with the sample at 115 °C. It shows a single Ba 3d5/2 emission line. Spectrum (b) is right at the peak of the jump. Despite the noise, two emission lines can clearly be distinguished, shifted by 2 and 4 eV from the original energy. We attribute the splitting of this particular run to different amounts of remaining screening charges in two domains.
Figure 4. Selected photoelectron spectra of the Ba 3d5/2 emission line of BaTiO3 at a photon energy of 6000 eV, extracted from figure 1(c). Continuous lines from a smoothing spline interpolation give a guide for the eyes. For details about (a) and (b) see the text.
Download figure:
Standard image High-resolution image
As soon as the first spectrum has been recorded, all charges within the probing depth of XPS (15 nm at a photon energy of 6000 eV [34]) are either neutralized or have left the probing volume. Several mechanisms might contribute to the neutralization, but for the subsequent discussion, we will focus on the neutralization current through the sample to the grounded backside of the sample. Only as long as screening charges are present, the corresponding field shifts the photoelectron spectrum.
Right after the phase transition, the remaining screening charges correspond to huge differences in potential, in particular between the areas of previous  + and
+ and  − domains. Together with charges from
  domains this gives rise to large lateral potential differences across the surface. We attribute splitting and broadening of emission lines right at the phase transition to these fields. However, as soon as the charge carriers have left the probing depth of XPS, the lateral potential differences vanish and with them the broadening of the photoemission lines. The remaining shifts of the photoemission lines indicates that there is still a field, because in the bulk the number of excess electrons and holes is still not the same. The shift to higher binding energies indicates an actual excess of holes.
In many cases an additional very fast jump to lower binding energies occurs. This indicates the presence of an initial excess of electrons, which are neutralized on a faster time scale than holes and the excess of electrons changes to an excess of holes. The difference in neutralization speed corresponds well to the mobility difference between electrons and holes. In most oxides, in particular titanates, the electron mobility is higher than the hole mobility.
In summary, the shifts of photoemission lines are explained by a three-step mechanism. Right after the phase transition, screening charges are within the probing depth. The high potential and local differences shift, broaden and even split photoemission lines. An example is shown in figure 4(b). As the charges leave the probing depth, the field differences across the surface vanish. The second step is characterized by an excess of electrons and a corresponding uniform shift to lower binding energies without broadening or splitting of emission lines. This shift has not always been observed, actually in less than 50 % of the cases. This indicates a prevalence of positive screening charges, in other words, a possible prevalence of  − over
  + domains. Due to their higher mobility, electrons are neutralized faster than holes, which comprises the third step with an excess of holes and a corresponding uniform shift to higher binding energies without broadening or splitting of emission lines. If the number of holes exceeds the number of electrons right after the phase transition, the third step (shift to higher binding energies) follows immediately on the first step and the second step (shift to lower binding energies) is skipped.
An interesting fact is the asymmetry with respect to the direction of the phase transition. When heating up, i.e. from the ferroelectric to the paraelectric phase, the jumps are always larger than during cooling down, i.e. from the paraelectric to the ferroelectric phase. We attribute this to the large number of screening charges, which become active when going from the ferroelectric to the paraelectric phase and rule out the influence of the change in the permittivity. Although the permittivity changes dramatically at the Curie temperature [35], it is smaller below the Curie temperature than above it. Therefore, above the Curie temperature the same charge would result in a smaller field than below it. Hence, shifts should be smaller when heating up than when cooling down, contrary to the observation. This means that the change in permittivity at the phase transition is actually overcompensated by the fields, which results from the remaining screening charges.
The CoFe2O4 and NiFe2O4 layers are magnetic insulators and promising candidates for multiferroic layer systems [13]. As with insulating BaTiO3, fast jumps of the photoemission lines have been observed including the lines from elements of the ferrite overlayer. This clearly shows that the main contribution to these shifts originates from fields in the sample and not from local changes around an ion. In comparison to the bare BaTiO3 sample, the jumps are smaller and occur on a faster timescale. For the central part of the BaTiO3 sample, the distance through the bulk to the sample plate (1 mm) is shorter than to the tantalum strips (up to 5 mm) at the side. This implies that in bare BaTiO3 the main neutralization current runs through the bulk to the sample plate. With the ferrite layers the longer distance to the tantalum strips is more than compensated by their higher conductivity. Therefore, the main neutralization current is through the layer to the tantalum strips.
The different neutralization times of the two ferrite layers imply different conductivities. Both bulk materials are wide band gap semiconductors. The difference in conductivity is determined by defects, such as oxygen and metal ion vacancies and site occupation of metal ions. Slow decay times of the transient jumps can be taken as indicator for high quality films with low levels of defects. The central role of the conductivity has been confirmed through experiments with metallic Co and Fe layers, where no huge transient peaks could be observed.
We will now turn to the small but permanent shifts of photoemission lines. With the exceptions of figure 1(d), there is a general trend: In the cubic phase all binding energies are 0.3 ± 0.1 eV higher than in the tetragonal phase. This resembles previous laboratory based investigations [21] taken with Mg  (1253.6 eV) or Al
  (1486.7 eV). Whereas the spectra taken at a photon energy of 2005 eV have a comparable probing depth as the laboratory-based measurements, the probing depth in spectra taken at a photon energy of 6000 eV is considerably larger (15 nm [34]). Since the small permanent shifts do not show any significant dependence on kinetic energy, surface related effects can be ruled out.
Table 1 shows calculated CLS in binding energy using DFT and experimental values of the permanent shifts between tetragonal and cubic phases. Contrary to the calculations the two different oxygen species cannot be distinguished in the experimental spectra and only one experimental value can be given. In summary, all emission lines show shifts in binding energies from tetragonal to cubic. However, the quantitative agreement with differences of 150 meV and more is worse than expected. This indicates that there might be additional mechanisms shifting the kinetic energies.
Table 1. Results of DFT calculations compared to experimental values.
| Core-level | CS model ECLS/meV | Experiment ΔEB/meV |
|---|---|---|
| O 1s | 269 (Ti) | 200 ± 50 |
| 544 (Ba) | ||
| Ti 2p | 42 | 100 ± 25 |
| Ba 3d | 457 | 300 ± 80 |
For the CoFe2O4 and NiFe2O4 layers it is interesting to note that no permanent change in binding energy is observed for elements in the ferrite layers (Fe, Co, Ni). This confirms that the small but permanent shifts are actual chemical shifts in binding energies resulting from the geometrical and electronic differences between the two BaTiO3 phases.
6. Conclusion
In this paper huge transient (several eV) jumps and smaller permanent shifts (several 100 meV) in the binding energies of photoemission lines are shown and discussed. They have been monitored during the phase transition of BaTiO3 from its ferroelectric to its paraelectric phase and reverse. The jumps in binding energy are assigned to changes in kinetic energies of the photoelectrons through a field, which is built up between the backside of the sample and screening charges of the ferroelectric polarization. The same mechanism has previously been suggested to result in ferroelectric electron emission. Using high photon energies it has been possible to probe up to a depth of 15 nm. The uniform line-shape of the shifted emission lines indicates that within the probing depth a lateral homogenous potential is achieved during the time of taking one spectrum. In low conductivity samples the neutralization of the remaining screening charges at the backside of the sample (after passing through the sample) is slow enough to be monitored using XPS. Fast initial shifts to lower binding energies are assigned to fields of excess electrons, subsequent shifts to higher binding energies to the fields of excess holes. The mechanism is also active in the presence of ferrimagnetic overlayers, as long as their conductivities are low enough. Due to the general nature of the mechanism, we expect it in any system with a ferroelectric to paraelectric phase transition. On the basis of theoretical ab initio calculations permanent shifts, which are usually smaller than the large transient jumps, are assigned to actual changes in binding energies.
Acknowledgments
Financial support has been provided by the Deutsche Forschungsgemeinschaft through Sonderforschungsbereich SFB 762 'Functionality of Oxidic Interfaces'. Technical support from G Ramm with the preparation of PLD targets is gratefully acknowledged.